Races in Greenville, South Carolina (SC) Detailed Stats
Data:
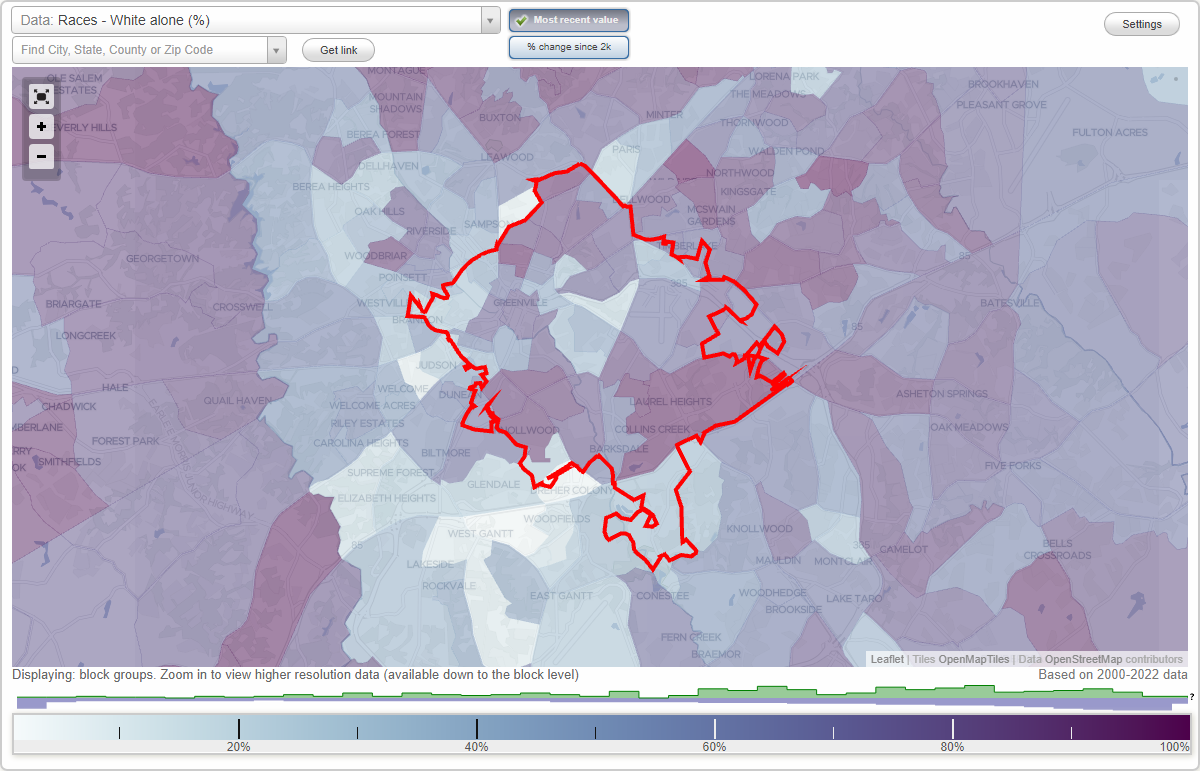
Races - White alone (%)
Races - White alone (% change since 2000)
Races - Black alone (%)
Races - Black alone (% change since 2000)
Races - American Indian alone (%)
Races - American Indian alone (% change since 2000)
Races - Asian alone (%)
Races - Asian alone (% change since 2000)
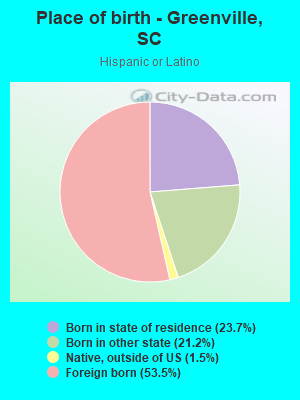
Races - Hispanic (%)
Races - Hispanic (% change since 2000)
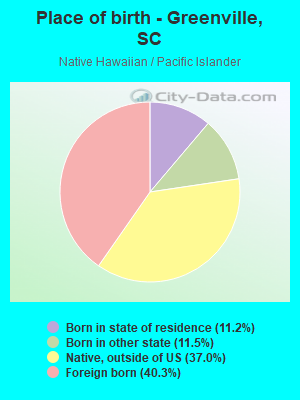
Races - Native Hawaiian and Other Pacific Islander alone (%)
Races - Native Hawaiian and Other Pacific Islander alone (% change since 2000)
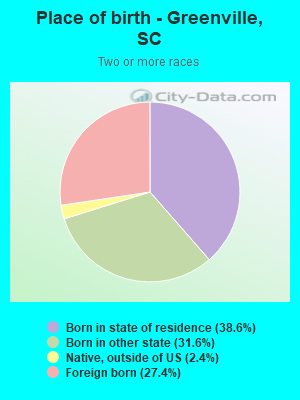
Races - Two or more races(%)
Races - Two or more races(% change since 2000)
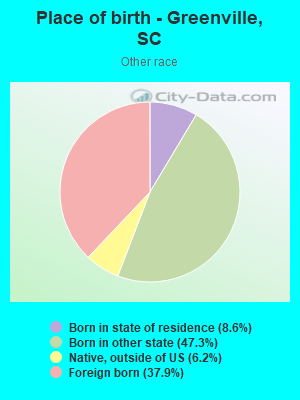
Races - Other race alone (%)
Races - Other race alone (% change since 2000)
Racial diversity
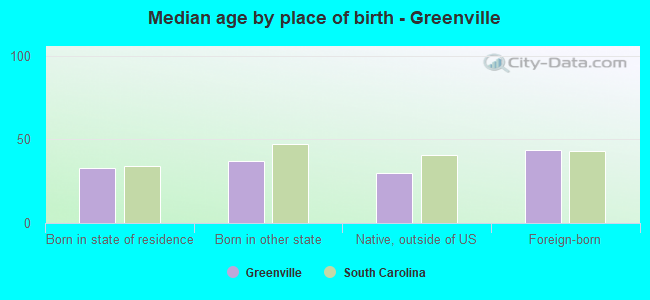
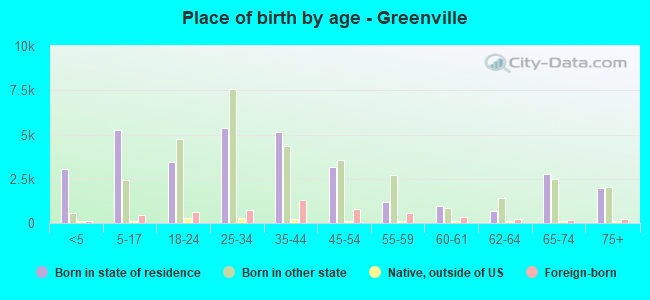
Place of birth - Born in state of residence (%)
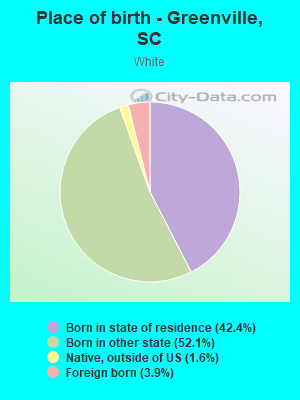
Place of birth - Born in state of residence (%) - White
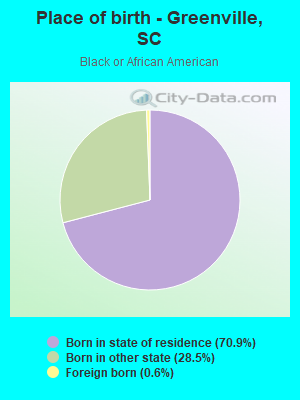
Place of birth - Born in state of residence (%) - Black or African American
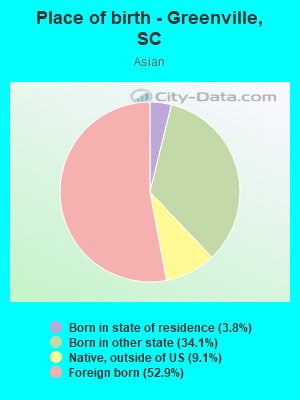
Place of birth - Born in state of residence (%) - Asian
Place of birth - Born in state of residence (%) - Hispanic or Latino
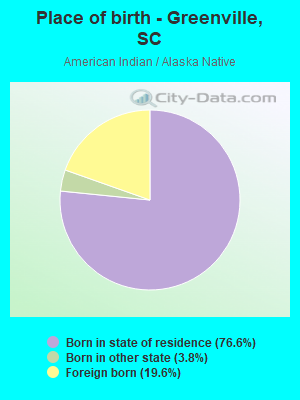
Place of birth - Born in state of residence (%) - American Indian and Alaska Native
Place of birth - Born in state of residence (%) - Multirace
Place of birth - Born in state of residence (%) - Other Race
Place of birth - Born in other state (%)
Place of birth - Born in other state (%) - White
Place of birth - Born in other state (%) - Black or African American
Place of birth - Born in other state (%) - Asian
Place of birth - Born in other state (%) - Hispanic or Latino
Place of birth - Born in other state (%) - American Indian and Alaska Native
Place of birth - Born in other state (%) - Multirace
Place of birth - Born in other state (%) - Other Race
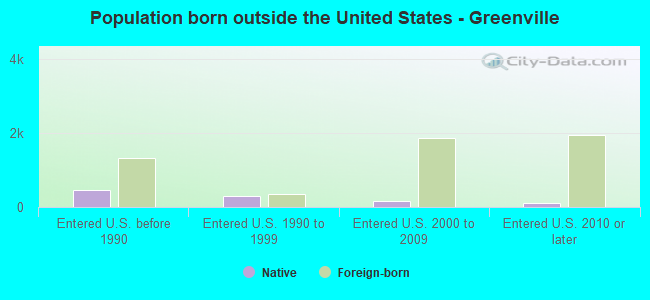
Place of birth - Native, outside of US (%)
Place of birth - Native, outside of US (%) - White
Place of birth - Native, outside of US (%) - Black or African American
Place of birth - Native, outside of US (%) - Asian
Place of birth - Native, outside of US (%) - Hispanic or Latino
Place of birth - Native, outside of US (%) - American Indian and Alaska Native
Place of birth - Native, outside of US (%) - Multirace
Place of birth - Native, outside of US (%) - Other Race
Place of birth - Foreign born (%)
Place of birth - Foreign born (%) - White
Place of birth - Foreign born (%) - Black or African American
Place of birth - Foreign born (%) - Asian
Place of birth - Foreign born (%) - Hispanic or Latino
Place of birth - Foreign born (%) - American Indian and Alaska Native
Place of birth - Foreign born (%) - Multirace
Place of birth - Foreign born (%) - Other Race
Residents speaking English at home (%)
Residents speaking English at home - Born in the United States (%)
Residents speaking English at home - Native, born elsewhere (%)
Residents speaking English at home - Foreign born (%)
Residents speaking Spanish at home (%)
Residents speaking Spanish at home - Born in the United States (%)
Residents speaking Spanish at home - Native, born elsewhere (%)
Residents speaking Spanish at home - Foreign born (%)
Residents speaking other language at home (%)
Residents speaking other language at home - Born in the United States (%)
Residents speaking other language at home - Native, born elsewhere (%)
Residents speaking other language at home - Foreign born (%)
Marital status - Never married (%)
Marital status - Now married (%)
Marital status - Separated (%)
Marital status - Widowed (%)
Marital status - Divorced (%)
Ancestries Reported - Arab (%)
Ancestries Reported - Czech (%)
Ancestries Reported - Danish (%)
Ancestries Reported - Dutch (%)
Ancestries Reported - English (%)
Ancestries Reported - French (%)
Ancestries Reported - French Canadian (%)
Ancestries Reported - German (%)
Ancestries Reported - Greek (%)
Ancestries Reported - Hungarian (%)
Ancestries Reported - Irish (%)
Ancestries Reported - Italian (%)
Ancestries Reported - Lithuanian (%)
Ancestries Reported - Norwegian (%)
Ancestries Reported - Polish (%)
Ancestries Reported - Portuguese (%)
Ancestries Reported - Russian (%)
Ancestries Reported - Scotch-Irish (%)
Ancestries Reported - Scottish (%)
Ancestries Reported - Slovak (%)
Ancestries Reported - Subsaharan African (%)
Ancestries Reported - Swedish (%)
Ancestries Reported - Swiss (%)
Ancestries Reported - Ukrainian (%)
Ancestries Reported - United States (%)
Ancestries Reported - Welsh (%)
Ancestries Reported - West Indian (%)
Ancestries Reported - Other (%)
Geographical mobility - Same house 1 year ago (%)
Geographical mobility - Same house 1 year ago (%) - White
Geographical mobility - Same house 1 year ago (%) - Black or African American
Geographical mobility - Same house 1 year ago (%) - Asian
Geographical mobility - Same house 1 year ago (%) - Hispanic or Latino
Geographical mobility - Same house 1 year ago (%) - American Indian and Alaska Native
Geographical mobility - Same house 1 year ago (%) - Multirace
Geographical mobility - Same house 1 year ago (%) - Other Race
Geographical mobility - Moved within same county (%)
Geographical mobility - Moved within same county (%) - White
Geographical mobility - Moved within same county (%) - Black or African American
Geographical mobility - Moved within same county (%) - Asian
Geographical mobility - Moved within same county (%) - Hispanic or Latino
Geographical mobility - Moved within same county (%) - American Indian and Alaska Native
Geographical mobility - Moved within same county (%) - Multirace
Geographical mobility - Moved within same county (%) - Other Race
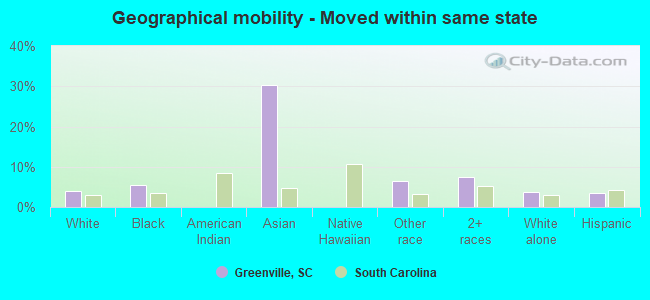
Geographical mobility - Moved from different county within same state (%)
Geographical mobility - Moved from different county within same state (%) - White
Geographical mobility - Moved from different county within same state (%) - Black or African American
Geographical mobility - Moved from different county within same state (%) - Asian
Geographical mobility - Moved from different county within same state (%) - Hispanic or Latino
Geographical mobility - Moved from different county within same state (%) - American Indian and Alaska Native
Geographical mobility - Moved from different county within same state (%) - Multirace
Geographical mobility - Moved from different county within same state (%) - Other Race
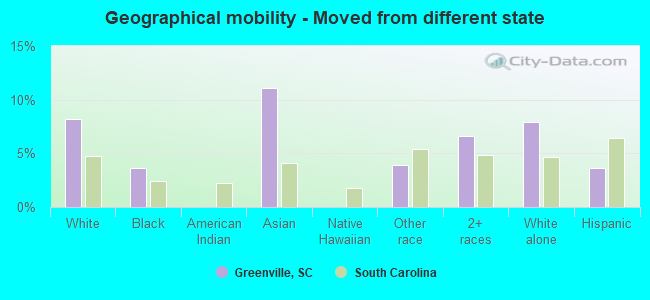
Geographical mobility - Moved from different state (%)
Geographical mobility - Moved from different state (%) - White
Geographical mobility - Moved from different state (%) - Black or African American
Geographical mobility - Moved from different state (%) - Asian
Geographical mobility - Moved from different state (%) - Hispanic or Latino
Geographical mobility - Moved from different state (%) - American Indian and Alaska Native
Geographical mobility - Moved from different state (%) - Multirace
Geographical mobility - Moved from different state (%) - Other Race
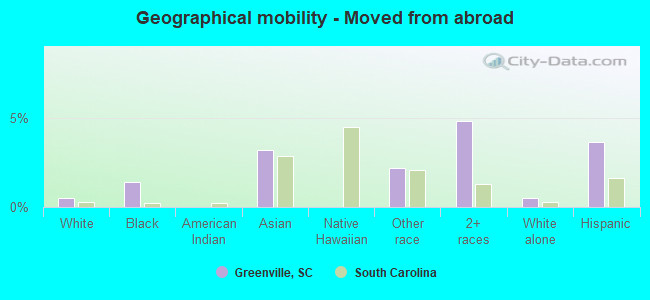
Geographical mobility - Moved from abroad (%)
Geographical mobility - Moved from abroad (%) - White
Geographical mobility - Moved from abroad (%) - Black or African American
Geographical mobility - Moved from abroad (%) - Asian
Geographical mobility - Moved from abroad (%) - Hispanic or Latino
Geographical mobility - Moved from abroad (%) - American Indian and Alaska Native
Geographical mobility - Moved from abroad (%) - Multirace
Geographical mobility - Moved from abroad (%) - Other Race
Place of birth for the foreign-born population - Ireland (%)
Place of birth for the foreign-born population - Denmark (%)
Place of birth for the foreign-born population - Norway (%)
Place of birth for the foreign-born population - Sweden (%)
Place of birth for the foreign-born population - United Kingdom (%)
Place of birth for the foreign-born population - England (%)
Place of birth for the foreign-born population - Scotland (%)
Place of birth for the foreign-born population - Other Northern Europe (%)
Place of birth for the foreign-born population - Austria (%)
Place of birth for the foreign-born population - Belgium (%)
Place of birth for the foreign-born population - France (%)
Place of birth for the foreign-born population - Germany (%)
Place of birth for the foreign-born population - Netherlands (%)
Place of birth for the foreign-born population - Switzerland (%)
Place of birth for the foreign-born population - Other Western Europe (%)
Place of birth for the foreign-born population - Greece (%)
Place of birth for the foreign-born population - Italy (%)
Place of birth for the foreign-born population - Portugal (%)
Place of birth for the foreign-born population - Spain (%)
Place of birth for the foreign-born population - Other Southern Europe (%)
Place of birth for the foreign-born population - Albania (%)
Place of birth for the foreign-born population - Belarus (%)
Place of birth for the foreign-born population - Bosnia and Herzegovina (%)
Place of birth for the foreign-born population - Bulgaria (%)
Place of birth for the foreign-born population - Croatia (%)
Place of birth for the foreign-born population - Czechoslovakia (%)
Place of birth for the foreign-born population - Hungary (%)
Place of birth for the foreign-born population - Latvia (%)
Place of birth for the foreign-born population - Lithuania (%)
Place of birth for the foreign-born population - North Macedonia (Macedonia) (%)
Place of birth for the foreign-born population - Moldova (%)
Place of birth for the foreign-born population - Poland (%)
Place of birth for the foreign-born population - Romania (%)
Place of birth for the foreign-born population - Russia (%)
Place of birth for the foreign-born population - Serbia (%)
Place of birth for the foreign-born population - Ukraine (%)
Place of birth for the foreign-born population - Other Eastern Europe (%)
Place of birth for the foreign-born population - China (%)
Place of birth for the foreign-born population - Hong Kong (%)
Place of birth for the foreign-born population - Taiwan (%)
Place of birth for the foreign-born population - Japan (%)
Place of birth for the foreign-born population - Korea (%)
Place of birth for the foreign-born population - Other Eastern Asia (%)
Place of birth for the foreign-born population - Afghanistan (%)
Place of birth for the foreign-born population - Bangladesh (%)
Place of birth for the foreign-born population - India (%)
Place of birth for the foreign-born population - Iran (%)
Place of birth for the foreign-born population - Kazakhstan (%)
Place of birth for the foreign-born population - Nepal (%)
Place of birth for the foreign-born population - Pakistan (%)
Place of birth for the foreign-born population - Sri Lanka (%)
Place of birth for the foreign-born population - Uzbekistan (%)
Place of birth for the foreign-born population - Other South Central Asia (%)
Place of birth for the foreign-born population - Burma (%)
Place of birth for the foreign-born population - Cambodia (%)
Place of birth for the foreign-born population - Indonesia (%)
Place of birth for the foreign-born population - Laos (%)
Place of birth for the foreign-born population - Malaysia (%)
Place of birth for the foreign-born population - Philippines (%)
Place of birth for the foreign-born population - Singapore (%)
Place of birth for the foreign-born population - Thailand (%)
Place of birth for the foreign-born population - Vietnam (%)
Place of birth for the foreign-born population - Other South Eastern Asia (%)
Place of birth for the foreign-born population - Armenia (%)
Place of birth for the foreign-born population - Iraq (%)
Place of birth for the foreign-born population - Israel (%)
Place of birth for the foreign-born population - Jordan (%)
Place of birth for the foreign-born population - Kuwait (%)
Place of birth for the foreign-born population - Lebanon (%)
Place of birth for the foreign-born population - Saudi Arabia (%)
Place of birth for the foreign-born population - Syria (%)
Place of birth for the foreign-born population - Turkey (%)
Place of birth for the foreign-born population - Yemen (%)
Place of birth for the foreign-born population - Other Western Asia (%)
Place of birth for the foreign-born population - Eritrea (%)
Place of birth for the foreign-born population - Ethiopia (%)
Place of birth for the foreign-born population - Kenya (%)
Place of birth for the foreign-born population - Somalia (%)
Place of birth for the foreign-born population - Uganda (%)
Place of birth for the foreign-born population - Zimbabwe (%)
Place of birth for the foreign-born population - Other Eastern Africa (%)
Place of birth for the foreign-born population - Cameroon (%)
Place of birth for the foreign-born population - Congo (%)
Place of birth for the foreign-born population - Democratic Republic of Congo (Zaire) (%)
Place of birth for the foreign-born population - Other Middle Africa (%)
Place of birth for the foreign-born population - Egypt (%)
Place of birth for the foreign-born population - Morocco (%)
Place of birth for the foreign-born population - Sudan (%)
Place of birth for the foreign-born population - Other Northern Africa (%)
Place of birth for the foreign-born population - South Africa (%)
Place of birth for the foreign-born population - Other Southern Africa (%)
Place of birth for the foreign-born population - Cabo Verde (%)
Place of birth for the foreign-born population - Ghana (%)
Place of birth for the foreign-born population - Liberia (%)
Place of birth for the foreign-born population - Nigeria (%)
Place of birth for the foreign-born population - Senegal (%)
Place of birth for the foreign-born population - Sierra Leone (%)
Place of birth for the foreign-born population - Other Western Africa (%)
Place of birth for the foreign-born population - Australia (%)
Place of birth for the foreign-born population - New Zealand (%)
Place of birth for the foreign-born population - Fiji (%)
Place of birth for the foreign-born population - Micronesia (%)
Place of birth for the foreign-born population - Bahamas (%)
Place of birth for the foreign-born population - Barbados (%)
Place of birth for the foreign-born population - Cuba (%)
Place of birth for the foreign-born population - Dominica (%)
Place of birth for the foreign-born population - Dominican Republic (%)
Place of birth for the foreign-born population - Grenada (%)
Place of birth for the foreign-born population - Haiti (%)
Place of birth for the foreign-born population - Jamaica (%)
Place of birth for the foreign-born population - St. Vincent and the Grenadines (%)
Place of birth for the foreign-born population - Trinidad and Tobago (%)
Place of birth for the foreign-born population - West Indies (%)
Place of birth for the foreign-born population - Other Caribbean (%)
Place of birth for the foreign-born population - Belize (%)
Place of birth for the foreign-born population - Costa Rica (%)
Place of birth for the foreign-born population - El Salvador (%)
Place of birth for the foreign-born population - Guatemala (%)
Place of birth for the foreign-born population - Honduras (%)
Place of birth for the foreign-born population - Mexico (%)
Place of birth for the foreign-born population - Nicaragua (%)
Place of birth for the foreign-born population - Panama (%)
Place of birth for the foreign-born population - Other Central America (%)
Place of birth for the foreign-born population - Argentina (%)
Place of birth for the foreign-born population - Bolivia (%)
Place of birth for the foreign-born population - Brazil (%)
Place of birth for the foreign-born population - Chile (%)
Place of birth for the foreign-born population - Colombia (%)
Place of birth for the foreign-born population - Ecuador (%)
Place of birth for the foreign-born population - Guyana (%)
Place of birth for the foreign-born population - Peru (%)
Place of birth for the foreign-born population - Uruguay (%)
Place of birth for the foreign-born population - Venezuela (%)
Place of birth for the foreign-born population - Other South America (%)
Place of birth for the foreign-born population - Canada (%)
Place of birth for the foreign-born population - Other Northern America (%)
Place of birth for the foreign-born population - Other (%)
Latest news about races in Greenville, SC collected exclusively by city-data.com from local newspapers, TV, and radio stations
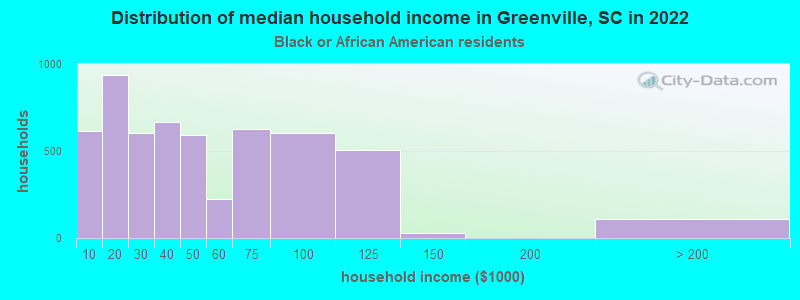
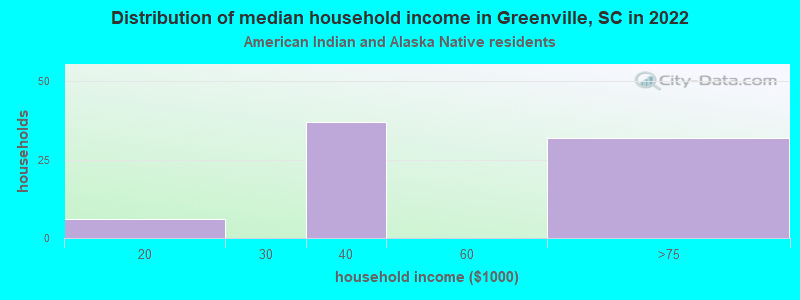
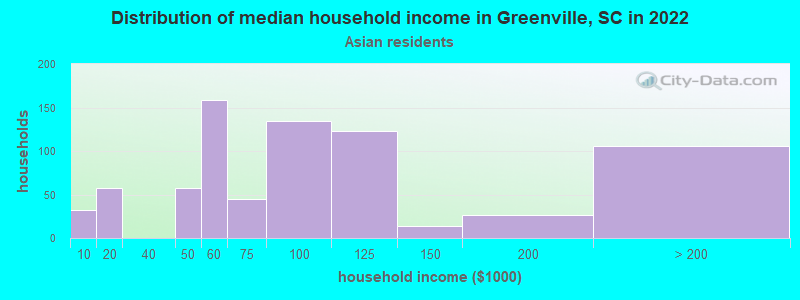
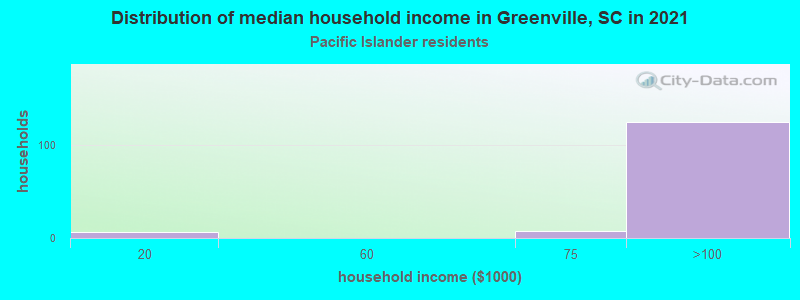
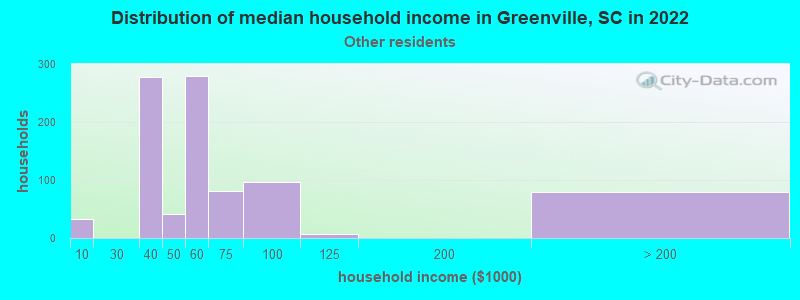
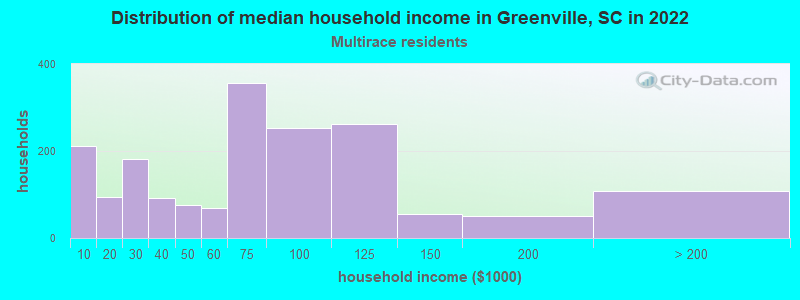
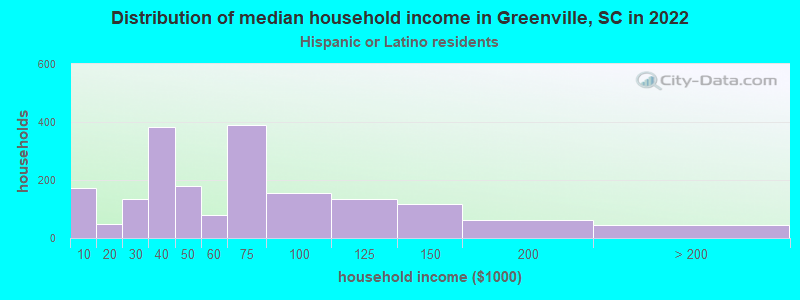
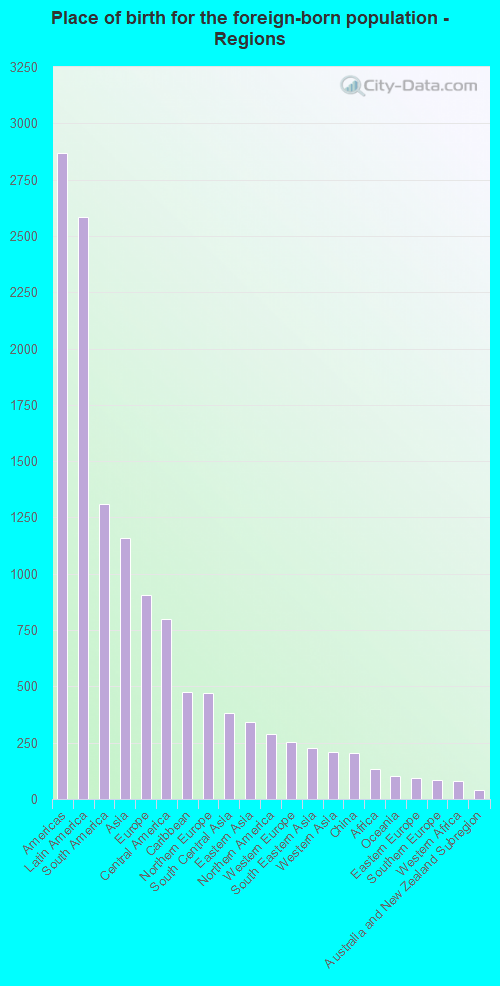
According to 2022 data, the most numerous races in Greenville, SC are White alone (47,889 residents), Black alone (16,513 residents), and Hispanic (4,746 residents). 91.8% of Greenville residents speak English at home. 7.0% of Greenville, SC residents are foreign-born (3.6% born in Latin America, 1.6% born in Asia, 1.3% born in Europe), which is 29.0% greater than the foreign-born rate of 5.0% across the entire state of South Carolina.
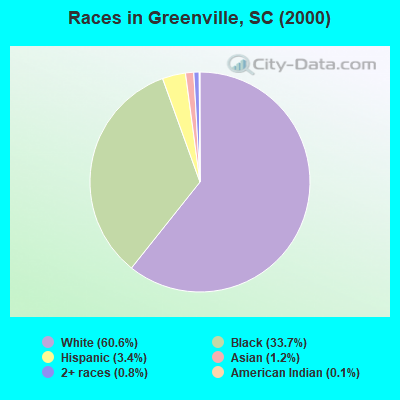
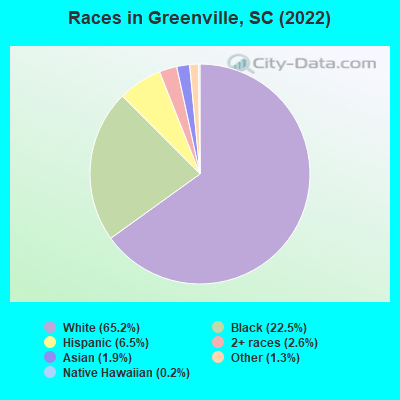
Race distribution in Greenville
2000 2022
2,652,291 66.1% White alone 1,178,486 29.4% Black alone 95,076 2.4% Hispanic 35,568 0.9% Asian alone 33,290 0.8% Two or more races 12,765 0.3% American Indian alone 3,266 0.08% Other race alone 1,270 0.03% Native Hawaiian and Other
3,301,739 62.5% White alone 1,313,290 24.9% Black alone 343,783 6.5% Hispanic 190,508 3.6% Two or more races 89,888 1.7% Asian alone 29,390 0.6% Other race alone 12,112 0.2% American Indian alone 1,924 0.04% Native Hawaiian and Other
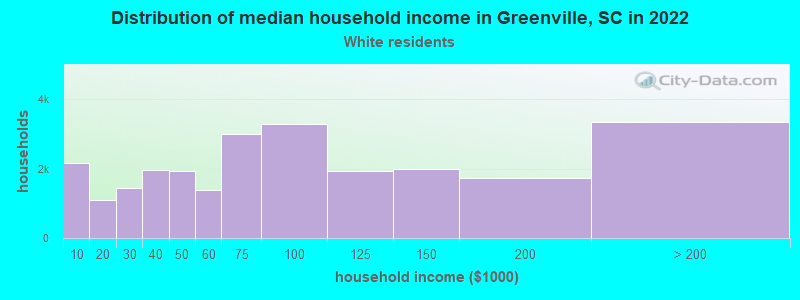
Income and house value in Greenville Median household income in 2022 $73,759 White non-Hispanic householders$37,489 Black householders$71,580 Asian householders$61,899 Some other race householders$80,404 Two or more races householders$67,679 Hispanic or Latino race householdersMedian 2022 house value $542,171 White Non-Hispanic householders$236,280 Black or African American householders$504,382 American Indian or Alaska Native householders $282,820 Asian householders$484,891 Some other race householders$352,033 Two or more races householders$561,264 Hispanic or Latino householders
Median age by race in Greenville
35.9 Median age for White residents36.8 34.6 40.9 Median age for Black or African American residents31.6 50.3 24.5 Median age for American Indian / Alaska Native residents59.9 15.9 30.7 Median age for Asian residents27.9 30.7 -666,666,666.0 Median age for Native Hawaiian / Pacific Islander residents-666,666,666.0 -666,666,666.0 39.4 Median age for Other race residents43.3 39.0 29.2 Median age for Two or more races residents29.3 25.9 36.0 Median age for White alone residents36.8 34.8 39.2 Median age for Hispanic or Latino residents32.5 39.4
Owner/renter occupied households by race in Greenville
House owners and renters - White residents 12,537 49.6% Owner occupied12,728 50.4% Renter occupiedHouse owners and renters - Black or African American residents 1,714 31.1% Owner occupied3,800 68.9% Renter occupiedHouse owners and renters - American Indian / Alaska Native residents 36 60.0% Owner occupied24 40.0% Renter occupiedHouse owners and renters - Asian residents 417 36.5% Owner occupied727 63.5% Renter occupiedHouse owners and renters - Native Hawaiian / Pacific Islander residents 76 100.0% Renter occupiedHouse owners and renters - Other race residents 193 19.9% Owner occupied776 80.1% Renter occupiedHouse owners and renters - Two or more races residents 651 43.0% Owner occupied862 57.0% Renter occupiedHouse owners and renters - White alone residents 12,451 49.7% Owner occupied12,616 50.3% Renter occupiedHouse owners and renters - Hispanic or Latino residents 519 27.4% Owner occupied1,374 72.6% Renter occupied
Language usage in Greenville
English speakers - Total 91.8% of residents of Greenville speak English at home.
5.2% of residents speak Spanish at home 2,050 56.9% Speak English very well1,555 43.1% Speak English less than very well3.2% of residents speak other language at home 1,725 76.8% Speak English very well520 23.2% Speak English less than very well
English speakers - Born in the United States 95.3% of residents of Greenville speak English at home.
3.3% of residents speak Spanish at home 811 76.7% Speak English very well247 23.3% Speak English less than very well1.3% of residents speak other language at home 387 94.4% Speak English very well23 5.6% Speak English less than very well
English speakers - Native, born elsewhere 69.2% of residents of Greenville speak English at home.
26.6% of residents speak Spanish at home 318 95.8% Speak English very well14 4.2% Speak English less than very well3.8% of residents speak other language at home 47 100.0% Speak English very well
English speakers - Foreign-born 28.7% of residents of Greenville speak English at home.
38.6% of residents speak Spanish at home 715 38.2% Speak English very well1,159 61.8% Speak English less than very well34.2% of residents speak other language at home 1,188 71.6% Speak English very well472 28.4% Speak English less than very well
White (Caucasian) - Speak only English Native:
98.0% (44,948)Foreign-born:
42.7% (836)
White (Caucasian) - Speak another language Native:
2.0% (929)Foreign-born:
57.3% (1,121)
Black or African American - Speak only English Native:
97.4% (14,708)Foreign-born:
23.3% (151)
Black or African American - Speak another language Native:
2.4% (359)Foreign-born:
46.9% (304)
American Indian / Alaska Native - Speak only English Native:
33.9% (28)Foreign-born:
2.2% (1)
American Indian / Alaska Native - Speak another language Native:
75.3% (62)Foreign-born:
98.9% (68)
Asian - Speak only English Native:
100.0% (577)Foreign-born:
24.0% (197)
Asian - Speak another language Native:
12.8% (74)Foreign-born:
76.3% (627)
Other race - Speak another language Native:
33.1% (372)Foreign-born:
96.2% (786)
Two or more races - Speak only English Native:
86.7% (2,590)Foreign-born:
2.4% (28)
Two or more races - Speak another language Native:
13.1% (391)Foreign-born:
97.9% (1,143)
White alone - Speak only English Native:
98.2% (44,575)Foreign-born:
42.7% (836)
White alone - Speak another language Native:
1.8% (800)Foreign-born:
57.3% (1,121)
Hispanic or Latino - Speak only English Native:
60.9% (1,412)Foreign-born:
2.1% (56)
Hispanic or Latino - Speak another language Native:
39.1% (907)Foreign-born:
97.9% (2,616)
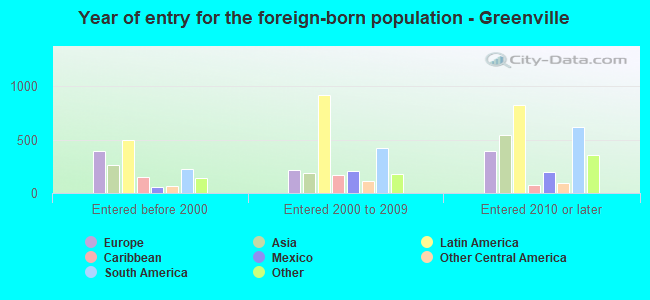
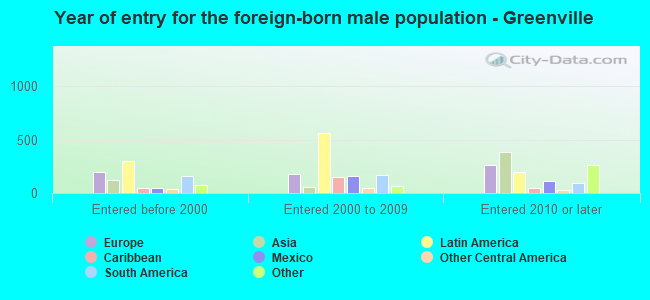
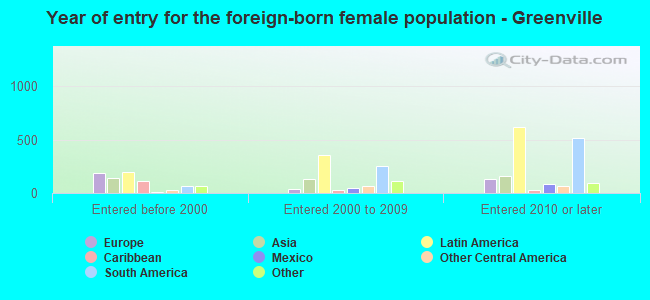
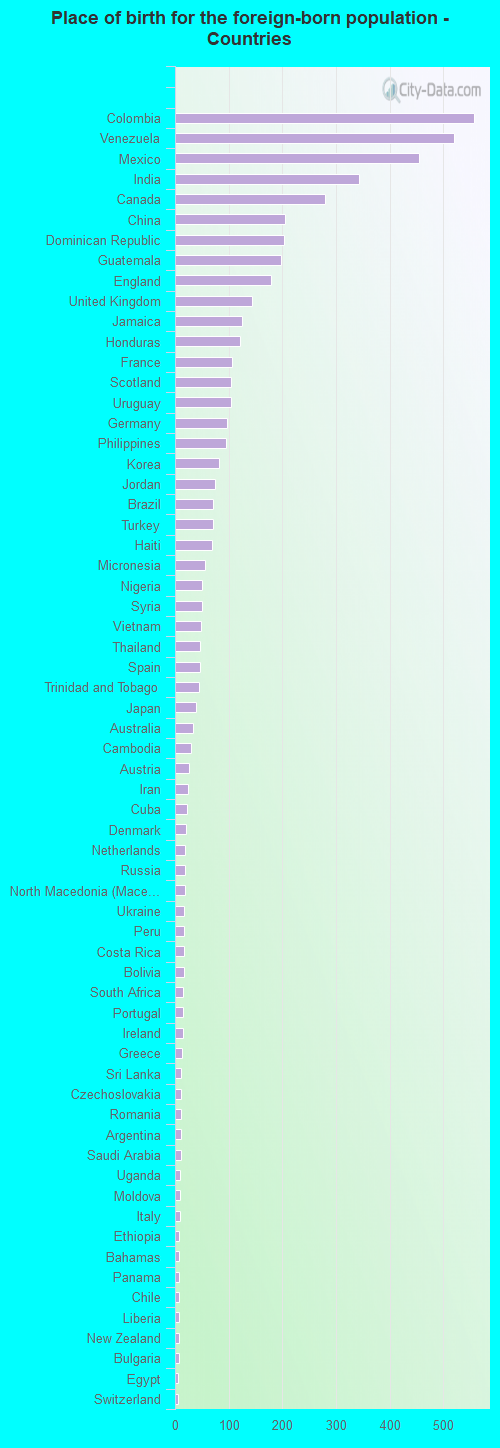
Foreign-born residents in Greenville 5,173 residents are foreign born (3.6% Latin America , 1.6% Asia , 1.3% Europe ).
This city:
7.0%South Carolina:
5.3%
Marital status for residents in Greenville Marital status - White (Caucasian) population 15 years and over
Males 37.5% Never married50.5% Now married1.3% Separated2.8% Widowed7.9% DivorcedFemales 40.8% Never married46.3% Now married1.2% Separated5.1% Widowed6.6% DivorcedWomen who gave birth in the past 12 months Now married:
87.2% (547)Unmarried:
12.8% (80)
Women who did not give birth in the past 12 months Now married:
37.2% (5,448)Unmarried:
62.8% (9,208)
Marital status - Black or African American population 15 years and over
Males 56.7% Never married25.3% Now married2.3% Separated2.6% Widowed13.1% DivorcedFemales 31.5% Never married30.8% Now married11.3% Separated17.3% Widowed9.2% DivorcedWomen who gave birth in the past 12 months Now married:
22.3% (62)Unmarried:
77.7% (217)
Women who did not give birth in the past 12 months Now married:
15.2% (649)Unmarried:
84.8% (3,609)
Marital status - American Indian / Alaska Native population 15 years and over
Males 26.9% Never married61.5% Now married0.0% Separated0.0% Widowed11.5% DivorcedFemales 34.7% Never married53.1% Now married0.0% Separated12.2% Widowed0.0% DivorcedWomen who did not give birth in the past 12 months Now married:
60.5% (36)Unmarried:
39.5% (23)
Marital status - Asian population 15 years and over
Males 40.9% Never married56.7% Now married1.6% Separated0.0% Widowed0.7% DivorcedFemales 31.9% Never married47.6% Now married0.0% Separated2.3% Widowed18.2% DivorcedWomen who gave birth in the past 12 months Now married:
100.0% (19)Unmarried:
0.0% (0)
Women who did not give birth in the past 12 months Now married:
44.8% (289)Unmarried:
55.2% (357)
Marital status - Native Hawaiian / Pacific Islander population 15 years and over
Males 51.4% Never married0.0% Now married0.0% Separated0.0% Widowed48.6% DivorcedFemales 85.0% Never married0.0% Now married15.0% Separated0.0% Widowed0.0% DivorcedWomen who did not give birth in the past 12 months Now married:
17.1% (6)Unmarried:
82.9% (31)
Marital status - Other race population 15 years and over
Males 53.3% Never married21.1% Now married0.0% Separated0.0% Widowed25.6% DivorcedFemales 30.3% Never married31.5% Now married1.9% Separated1.2% Widowed35.0% DivorcedWomen who did not give birth in the past 12 months Now married:
31.5% (172)Unmarried:
68.5% (374)
Marital status - Two or more races population 15 years and over
Males 60.7% Never married32.9% Now married2.4% Separated1.0% Widowed3.0% DivorcedFemales 42.5% Never married40.2% Now married1.6% Separated2.8% Widowed12.9% DivorcedWomen who gave birth in the past 12 months Now married:
20.0% (9)Unmarried:
80.0% (35)
Women who did not give birth in the past 12 months Now married:
39.8% (451)Unmarried:
60.2% (683)
Marital status - White alone, not Hispanic / Latino population 15 years and over
Males 37.4% Never married50.5% Now married1.3% Separated2.8% Widowed8.0% DivorcedFemales 40.3% Never married46.8% Now married1.0% Separated5.2% Widowed6.7% DivorcedWomen who gave birth in the past 12 months Now married:
87.2% (547)Unmarried:
12.8% (80)
Women who did not give birth in the past 12 months Now married:
37.5% (5,402)Unmarried:
62.5% (8,996)
Marital status - Hispanic or Latino population 15 years and over
Males 45.3% Never married46.2% Now married2.4% Separated0.0% Widowed6.1% DivorcedFemales 38.2% Never married35.3% Now married1.7% Separated2.7% Widowed22.1% DivorcedWomen who gave birth in the past 12 months Now married:
28.6% (6)Unmarried:
71.4% (16)
Women who did not give birth in the past 12 months Now married:
38.3% (564)Unmarried:
61.7% (909)
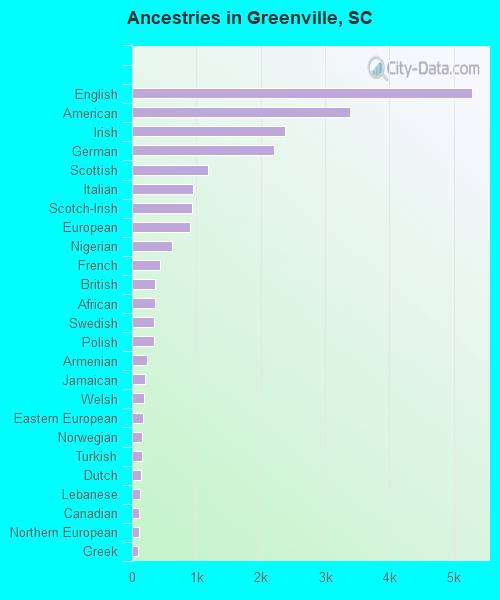
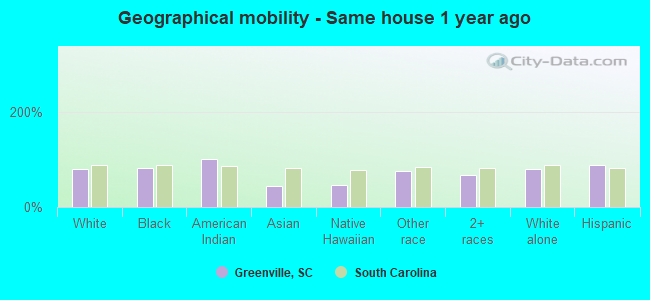
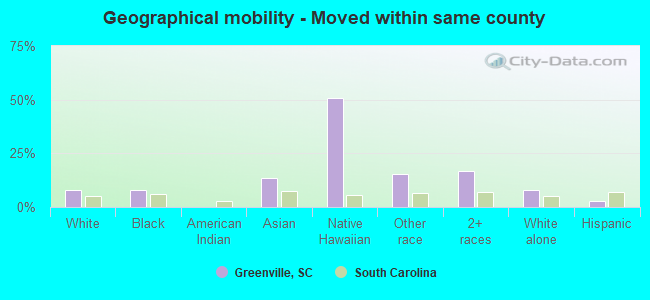
Ancestries in Greenville
5,284 14.0% English3,382 8.9% American2,375 6.3% Irish2,207 5.8% German1,186 3.1% Scottish952 2.5% Italian931 2.5% Scotch-Irish904 2.4% European620 1.6% Nigerian435 1.2% French353 0.9% British353 0.9% African339 0.9% Swedish339 0.9% Polish240 0.6% Armenian204 0.5% Jamaican183 0.5% Welsh166 0.4% Eastern European157 0.4% Norwegian156 0.4% Turkish135 0.4% Dutch131 0.3% Lebanese113 0.3% Canadian102 0.3% Northern European93 0.2% Greek91 0.2% Yugoslavian62 0.2% Hungarian62 0.2% Romanian62 0.2% Ukrainian61 0.2% French Canadian59 0.2% Portuguese58 0.2% Finnish53 0.1% Swiss47 0.1% Russian31 0.08% Trinidadian and Tobagonian30 0.08% Ghanaian29 0.08% South African29 0.08% Danish28 0.07% Czech27 0.07% Brazilian26 0.07% Slovak21 0.06% West Indian20 0.05% Austrian17 0.04% Palestinian16 0.04% Scandinavian10 0.03% Croatian9 0.02% Bulgarian8 0.02% Ethiopian8 0.02% Bahamian7 0.02% Latvian7 0.02% Belgian6 0.02% Iranian6 0.02% New Zealander6 0.02% Ugandan4 0.01% Syrian3 0.01% Serbian2 0.01% Haitian
Geographical mobility in Greenville Same house 1 year ago 39,620 79.6% White (Caucasian)13,183 80.7% Black or African American139 100.0% American Indian / Alaska Native608 43.6% Asian75 46.9% Native Hawaiian / Pacific Islander1,437 74.5% Other race2,933 68.4% Two or more races39,313 79.8% White alone, not Hispanic / Latino4,321 86.6% Hispanic or LatinoMoved within same county 3,874 7.8% White / Caucasian1,276 7.8% Black or African American190 13.6% Asian81 50.7% Native Hawaiian / Pacific Islander294 15.2% Other race723 16.9% Two or more races3,874 7.9% White alone, not Hispanic / Latino133 2.7% Hispanic or LatinoMoved within same state 1,940 3.9% White / Caucasian900 5.5% Black or African American421 30.2% Asian126 6.6% Other race315 7.3% Two or more races1,898 3.9% White alone, not Hispanic / Latino176 3.5% Hispanic or LatinoMoved from different state 4,072 8.2% White / Caucasian593 3.6% Black or African American154 11.1% Asian75 3.9% Other race282 6.6% Two or more races3,919 8.0% White alone, not Hispanic / Latino180 3.6% Hispanic or LatinoMoved from abroad 261 0.5% White232 1.4% Black or African American44 3.2% Asian42 2.2% Other race206 4.8% Two or more races261 0.5% White alone, not Hispanic / Latino181 3.6% Hispanic or Latino
Children Nativity (place of birth) in Greenville
Children under 6 years - Living with two parents Both parents native 2,721 100.0% NativeBoth parents foreign-born 128 77.8% Native37 22.2% Foreign-bornOne native, one foreign-born parent 464 100.0% NativeChildren under 6 years - Living with one parent Native parent 1,229 100.0% NativeForeign-born parent 20 100.0% NativeChildren 6 to 17 years - Living with two parents Both parents native 4,533 99.4% Native25 0.6% Foreign-bornBoth parents foreign-born 172 62.8% Native102 37.2% Foreign-bornOne native, one foreign-born parent 205 100.0% NativeChildren 6 to 17 years - Living with one parent Native parent 2,127 100.0% NativeForeign-born parent 176 67.7% Native84 32.3% Foreign-born
Grandparents responsible for own grandchildren in Greenville
Grandparents (30 to 59 years) White / Caucasian 24 20.2% Responsible for grandchildren95 79.8% Not responsible for grandchildrenBlack or African American 54 41.0% Responsible for grandchildren78 59.0% Not responsible for grandchildrenTwo or more races 10 100.0% Responsible for grandchildrenWhite alone, not Hispanic / Latino 24 19.4% Responsible for grandchildren102 80.6% Not responsible for grandchildrenHispanic or Latino 9 100.0% Not responsible for grandchildrenGrandparents (60 years and over) White / Caucasian 25 28.1% Responsible for grandchildren65 71.9% Not responsible for grandchildrenBlack or African American 71 27.8% Responsible for grandchildren185 72.2% Not responsible for grandchildrenTwo or more races 56 100.0% Responsible for grandchildrenWhite alone, not Hispanic / Latino 26 28.2% Responsible for grandchildren67 71.8% Not responsible for grandchildrenHispanic or Latino 22 100.0% Responsible for grandchildren