Races in Greensboro, Maryland (MD) Detailed Stats
Data:
Races - White alone (%)
Races - White alone (% change since 2000)
Races - Black alone (%)
Races - Black alone (% change since 2000)
Races - American Indian alone (%)
Races - American Indian alone (% change since 2000)
Races - Asian alone (%)
Races - Asian alone (% change since 2000)
Races - Hispanic (%)
Races - Hispanic (% change since 2000)
Races - Native Hawaiian and Other Pacific Islander alone (%)
Races - Native Hawaiian and Other Pacific Islander alone (% change since 2000)
Races - Two or more races(%)
Races - Two or more races(% change since 2000)
Races - Other race alone (%)
Races - Other race alone (% change since 2000)
Racial diversity
Place of birth - Born in state of residence (%)
Place of birth - Born in state of residence (%) - White
Place of birth - Born in state of residence (%) - Black or African American
Place of birth - Born in state of residence (%) - Asian
Place of birth - Born in state of residence (%) - Hispanic or Latino
Place of birth - Born in state of residence (%) - American Indian and Alaska Native
Place of birth - Born in state of residence (%) - Multirace
Place of birth - Born in state of residence (%) - Other Race
Place of birth - Born in other state (%)
Place of birth - Born in other state (%) - White
Place of birth - Born in other state (%) - Black or African American
Place of birth - Born in other state (%) - Asian
Place of birth - Born in other state (%) - Hispanic or Latino
Place of birth - Born in other state (%) - American Indian and Alaska Native
Place of birth - Born in other state (%) - Multirace
Place of birth - Born in other state (%) - Other Race
Place of birth - Native, outside of US (%)
Place of birth - Native, outside of US (%) - White
Place of birth - Native, outside of US (%) - Black or African American
Place of birth - Native, outside of US (%) - Asian
Place of birth - Native, outside of US (%) - Hispanic or Latino
Place of birth - Native, outside of US (%) - American Indian and Alaska Native
Place of birth - Native, outside of US (%) - Multirace
Place of birth - Native, outside of US (%) - Other Race
Place of birth - Foreign born (%)
Place of birth - Foreign born (%) - White
Place of birth - Foreign born (%) - Black or African American
Place of birth - Foreign born (%) - Asian
Place of birth - Foreign born (%) - Hispanic or Latino
Place of birth - Foreign born (%) - American Indian and Alaska Native
Place of birth - Foreign born (%) - Multirace
Place of birth - Foreign born (%) - Other Race
Residents speaking English at home (%)
Residents speaking English at home - Born in the United States (%)
Residents speaking English at home - Native, born elsewhere (%)
Residents speaking English at home - Foreign born (%)
Residents speaking Spanish at home (%)
Residents speaking Spanish at home - Born in the United States (%)
Residents speaking Spanish at home - Native, born elsewhere (%)
Residents speaking Spanish at home - Foreign born (%)
Residents speaking other language at home (%)
Residents speaking other language at home - Born in the United States (%)
Residents speaking other language at home - Native, born elsewhere (%)
Residents speaking other language at home - Foreign born (%)
Marital status - Never married (%)
Marital status - Now married (%)
Marital status - Separated (%)
Marital status - Widowed (%)
Marital status - Divorced (%)
Ancestries Reported - Arab (%)
Ancestries Reported - Czech (%)
Ancestries Reported - Danish (%)
Ancestries Reported - Dutch (%)
Ancestries Reported - English (%)
Ancestries Reported - French (%)
Ancestries Reported - French Canadian (%)
Ancestries Reported - German (%)
Ancestries Reported - Greek (%)
Ancestries Reported - Hungarian (%)
Ancestries Reported - Irish (%)
Ancestries Reported - Italian (%)
Ancestries Reported - Lithuanian (%)
Ancestries Reported - Norwegian (%)
Ancestries Reported - Polish (%)
Ancestries Reported - Portuguese (%)
Ancestries Reported - Russian (%)
Ancestries Reported - Scotch-Irish (%)
Ancestries Reported - Scottish (%)
Ancestries Reported - Slovak (%)
Ancestries Reported - Subsaharan African (%)
Ancestries Reported - Swedish (%)
Ancestries Reported - Swiss (%)
Ancestries Reported - Ukrainian (%)
Ancestries Reported - United States (%)
Ancestries Reported - Welsh (%)
Ancestries Reported - West Indian (%)
Ancestries Reported - Other (%)
Geographical mobility - Same house 1 year ago (%)
Geographical mobility - Same house 1 year ago (%) - White
Geographical mobility - Same house 1 year ago (%) - Black or African American
Geographical mobility - Same house 1 year ago (%) - Asian
Geographical mobility - Same house 1 year ago (%) - Hispanic or Latino
Geographical mobility - Same house 1 year ago (%) - American Indian and Alaska Native
Geographical mobility - Same house 1 year ago (%) - Multirace
Geographical mobility - Same house 1 year ago (%) - Other Race
Geographical mobility - Moved within same county (%)
Geographical mobility - Moved within same county (%) - White
Geographical mobility - Moved within same county (%) - Black or African American
Geographical mobility - Moved within same county (%) - Asian
Geographical mobility - Moved within same county (%) - Hispanic or Latino
Geographical mobility - Moved within same county (%) - American Indian and Alaska Native
Geographical mobility - Moved within same county (%) - Multirace
Geographical mobility - Moved within same county (%) - Other Race
Geographical mobility - Moved from different county within same state (%)
Geographical mobility - Moved from different county within same state (%) - White
Geographical mobility - Moved from different county within same state (%) - Black or African American
Geographical mobility - Moved from different county within same state (%) - Asian
Geographical mobility - Moved from different county within same state (%) - Hispanic or Latino
Geographical mobility - Moved from different county within same state (%) - American Indian and Alaska Native
Geographical mobility - Moved from different county within same state (%) - Multirace
Geographical mobility - Moved from different county within same state (%) - Other Race
Geographical mobility - Moved from different state (%)
Geographical mobility - Moved from different state (%) - White
Geographical mobility - Moved from different state (%) - Black or African American
Geographical mobility - Moved from different state (%) - Asian
Geographical mobility - Moved from different state (%) - Hispanic or Latino
Geographical mobility - Moved from different state (%) - American Indian and Alaska Native
Geographical mobility - Moved from different state (%) - Multirace
Geographical mobility - Moved from different state (%) - Other Race
Geographical mobility - Moved from abroad (%)
Geographical mobility - Moved from abroad (%) - White
Geographical mobility - Moved from abroad (%) - Black or African American
Geographical mobility - Moved from abroad (%) - Asian
Geographical mobility - Moved from abroad (%) - Hispanic or Latino
Geographical mobility - Moved from abroad (%) - American Indian and Alaska Native
Geographical mobility - Moved from abroad (%) - Multirace
Geographical mobility - Moved from abroad (%) - Other Race
Place of birth for the foreign-born population - Ireland (%)
Place of birth for the foreign-born population - Denmark (%)
Place of birth for the foreign-born population - Norway (%)
Place of birth for the foreign-born population - Sweden (%)
Place of birth for the foreign-born population - United Kingdom (%)
Place of birth for the foreign-born population - England (%)
Place of birth for the foreign-born population - Scotland (%)
Place of birth for the foreign-born population - Other Northern Europe (%)
Place of birth for the foreign-born population - Austria (%)
Place of birth for the foreign-born population - Belgium (%)
Place of birth for the foreign-born population - France (%)
Place of birth for the foreign-born population - Germany (%)
Place of birth for the foreign-born population - Netherlands (%)
Place of birth for the foreign-born population - Switzerland (%)
Place of birth for the foreign-born population - Other Western Europe (%)
Place of birth for the foreign-born population - Greece (%)
Place of birth for the foreign-born population - Italy (%)
Place of birth for the foreign-born population - Portugal (%)
Place of birth for the foreign-born population - Spain (%)
Place of birth for the foreign-born population - Other Southern Europe (%)
Place of birth for the foreign-born population - Albania (%)
Place of birth for the foreign-born population - Belarus (%)
Place of birth for the foreign-born population - Bosnia and Herzegovina (%)
Place of birth for the foreign-born population - Bulgaria (%)
Place of birth for the foreign-born population - Croatia (%)
Place of birth for the foreign-born population - Czechoslovakia (%)
Place of birth for the foreign-born population - Hungary (%)
Place of birth for the foreign-born population - Latvia (%)
Place of birth for the foreign-born population - Lithuania (%)
Place of birth for the foreign-born population - North Macedonia (Macedonia) (%)
Place of birth for the foreign-born population - Moldova (%)
Place of birth for the foreign-born population - Poland (%)
Place of birth for the foreign-born population - Romania (%)
Place of birth for the foreign-born population - Russia (%)
Place of birth for the foreign-born population - Serbia (%)
Place of birth for the foreign-born population - Ukraine (%)
Place of birth for the foreign-born population - Other Eastern Europe (%)
Place of birth for the foreign-born population - China (%)
Place of birth for the foreign-born population - Hong Kong (%)
Place of birth for the foreign-born population - Taiwan (%)
Place of birth for the foreign-born population - Japan (%)
Place of birth for the foreign-born population - Korea (%)
Place of birth for the foreign-born population - Other Eastern Asia (%)
Place of birth for the foreign-born population - Afghanistan (%)
Place of birth for the foreign-born population - Bangladesh (%)
Place of birth for the foreign-born population - India (%)
Place of birth for the foreign-born population - Iran (%)
Place of birth for the foreign-born population - Kazakhstan (%)
Place of birth for the foreign-born population - Nepal (%)
Place of birth for the foreign-born population - Pakistan (%)
Place of birth for the foreign-born population - Sri Lanka (%)
Place of birth for the foreign-born population - Uzbekistan (%)
Place of birth for the foreign-born population - Other South Central Asia (%)
Place of birth for the foreign-born population - Burma (%)
Place of birth for the foreign-born population - Cambodia (%)
Place of birth for the foreign-born population - Indonesia (%)
Place of birth for the foreign-born population - Laos (%)
Place of birth for the foreign-born population - Malaysia (%)
Place of birth for the foreign-born population - Philippines (%)
Place of birth for the foreign-born population - Singapore (%)
Place of birth for the foreign-born population - Thailand (%)
Place of birth for the foreign-born population - Vietnam (%)
Place of birth for the foreign-born population - Other South Eastern Asia (%)
Place of birth for the foreign-born population - Armenia (%)
Place of birth for the foreign-born population - Iraq (%)
Place of birth for the foreign-born population - Israel (%)
Place of birth for the foreign-born population - Jordan (%)
Place of birth for the foreign-born population - Kuwait (%)
Place of birth for the foreign-born population - Lebanon (%)
Place of birth for the foreign-born population - Saudi Arabia (%)
Place of birth for the foreign-born population - Syria (%)
Place of birth for the foreign-born population - Turkey (%)
Place of birth for the foreign-born population - Yemen (%)
Place of birth for the foreign-born population - Other Western Asia (%)
Place of birth for the foreign-born population - Eritrea (%)
Place of birth for the foreign-born population - Ethiopia (%)
Place of birth for the foreign-born population - Kenya (%)
Place of birth for the foreign-born population - Somalia (%)
Place of birth for the foreign-born population - Uganda (%)
Place of birth for the foreign-born population - Zimbabwe (%)
Place of birth for the foreign-born population - Other Eastern Africa (%)
Place of birth for the foreign-born population - Cameroon (%)
Place of birth for the foreign-born population - Congo (%)
Place of birth for the foreign-born population - Democratic Republic of Congo (Zaire) (%)
Place of birth for the foreign-born population - Other Middle Africa (%)
Place of birth for the foreign-born population - Egypt (%)
Place of birth for the foreign-born population - Morocco (%)
Place of birth for the foreign-born population - Sudan (%)
Place of birth for the foreign-born population - Other Northern Africa (%)
Place of birth for the foreign-born population - South Africa (%)
Place of birth for the foreign-born population - Other Southern Africa (%)
Place of birth for the foreign-born population - Cabo Verde (%)
Place of birth for the foreign-born population - Ghana (%)
Place of birth for the foreign-born population - Liberia (%)
Place of birth for the foreign-born population - Nigeria (%)
Place of birth for the foreign-born population - Senegal (%)
Place of birth for the foreign-born population - Sierra Leone (%)
Place of birth for the foreign-born population - Other Western Africa (%)
Place of birth for the foreign-born population - Australia (%)
Place of birth for the foreign-born population - New Zealand (%)
Place of birth for the foreign-born population - Fiji (%)
Place of birth for the foreign-born population - Micronesia (%)
Place of birth for the foreign-born population - Bahamas (%)
Place of birth for the foreign-born population - Barbados (%)
Place of birth for the foreign-born population - Cuba (%)
Place of birth for the foreign-born population - Dominica (%)
Place of birth for the foreign-born population - Dominican Republic (%)
Place of birth for the foreign-born population - Grenada (%)
Place of birth for the foreign-born population - Haiti (%)
Place of birth for the foreign-born population - Jamaica (%)
Place of birth for the foreign-born population - St. Vincent and the Grenadines (%)
Place of birth for the foreign-born population - Trinidad and Tobago (%)
Place of birth for the foreign-born population - West Indies (%)
Place of birth for the foreign-born population - Other Caribbean (%)
Place of birth for the foreign-born population - Belize (%)
Place of birth for the foreign-born population - Costa Rica (%)
Place of birth for the foreign-born population - El Salvador (%)
Place of birth for the foreign-born population - Guatemala (%)
Place of birth for the foreign-born population - Honduras (%)
Place of birth for the foreign-born population - Mexico (%)
Place of birth for the foreign-born population - Nicaragua (%)
Place of birth for the foreign-born population - Panama (%)
Place of birth for the foreign-born population - Other Central America (%)
Place of birth for the foreign-born population - Argentina (%)
Place of birth for the foreign-born population - Bolivia (%)
Place of birth for the foreign-born population - Brazil (%)
Place of birth for the foreign-born population - Chile (%)
Place of birth for the foreign-born population - Colombia (%)
Place of birth for the foreign-born population - Ecuador (%)
Place of birth for the foreign-born population - Guyana (%)
Place of birth for the foreign-born population - Peru (%)
Place of birth for the foreign-born population - Uruguay (%)
Place of birth for the foreign-born population - Venezuela (%)
Place of birth for the foreign-born population - Other South America (%)
Place of birth for the foreign-born population - Canada (%)
Place of birth for the foreign-born population - Other Northern America (%)
Place of birth for the foreign-born population - Other (%)
Latest news about races in Greensboro, MD collected exclusively by city-data.com from local newspapers, TV, and radio stations
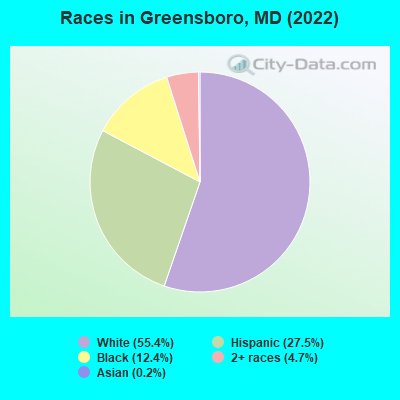
According to 2022 data, the most numerous races in Greensboro, MD are White alone (1,542 residents), Black alone (346 residents), and Hispanic (766 residents). 77.4% of Greensboro residents speak English at home. 16.1% of Greensboro, MD residents are foreign-born (13.1% born in Latin America, 1.9% born in Europe), which is about the same as the foreign-born rate of 16.0% across the entire state of Maryland.
Race distribution in Greensboro
2000 2022
3,286,547 62.1% White alone 1,464,735 27.7% Black alone 227,916 4.3% Hispanic 209,738 4.0% Asian alone 82,946 1.6% Two or more races 13,312 0.3% American Indian alone 9,379 0.2% Other race alone 1,913 0.04% Native Hawaiian and Other
2,906,492 47.1% White alone 1,800,914 29.2% Black alone 705,842 11.4% Hispanic 401,818 6.5% Asian alone 291,317 4.7% Two or more races 46,930 0.8% Other race alone 8,930 0.1% American Indian alone 2,417 0.04% Native Hawaiian and Other
Income and house value in Greensboro Median household income in 2022 $40,722 White non-Hispanic householders$25,467 Black householders$54,291 Hispanic or Latino race householdersMedian 2022 house value $206,185 White Non-Hispanic householders$192,471 Black or African American householders$132,324 Some other race householders$204,500 Two or more races householders$132,324 Hispanic or Latino householders
Median age by race in Greensboro
32.8 Median age for White residents33.2 31.6 35.9 Median age for Black or African American residents37.5 27.3 8.7 Median age for American Indian / Alaska Native residents19.1 4.8 -686,817,799.5 Median age for Asian residents-680,447,889.1 -688,013,135.6 -763,333,332.6 Median age for Native Hawaiian / Pacific Islander residents-720,061,021.4 -760,942,760.2 -666,666,666.0 Median age for Other race residents-662,222,221.6 -673,492,604.6 21.2 Median age for Two or more races residents34.3 17.9 33.5 Median age for White alone residents35.0 33.1 14.3 Median age for Hispanic or Latino residents28.6 11.3
Owner/renter occupied households by race in Greensboro
House owners and renters - White residents 328 54.1% Owner occupied278 45.9% Renter occupiedHouse owners and renters - Black or African American residents 64 57.7% Owner occupied47 42.3% Renter occupiedHouse owners and renters - American Indian / Alaska Native residents 15 100.0% Renter occupiedHouse owners and renters - Other race residents 14 100.0% Renter occupiedHouse owners and renters - Two or more races residents 55 54.1% Owner occupied46 45.9% Renter occupiedHouse owners and renters - White alone residents 330 54.3% Owner occupied278 45.7% Renter occupiedHouse owners and renters - Hispanic or Latino residents 36 34.5% Owner occupied68 65.5% Renter occupied
Language usage in Greensboro
English speakers - Total 77.4% of residents of Greensboro speak English at home.
20.9% of residents speak Spanish at home 96 18.9% Speak English very well413 81.1% Speak English less than very well2.0% of residents speak other language at home 44 89.8% Speak English very well5 10.2% Speak English less than very well
English speakers - Born in the United States 99.8% of residents of Greensboro speak English at home.
English speakers - Native, born elsewhere 76.7% of residents of Greensboro speak English at home.
25.6% of residents speak Spanish at home 11 100.0% Speak English less than very well
English speakers - Foreign-born 2.5% of residents of Greensboro speak English at home.
88.8% of residents speak Spanish at home 35 8.8% Speak English very well363 91.2% Speak English less than very well10.7% of residents speak other language at home 45 93.8% Speak English very well3 6.2% Speak English less than very well
White (Caucasian) - Speak only English Native:
99.7% (1,350)Foreign-born:
8.8% (6)
White (Caucasian) - Speak another language Native:
0.9% (13)Foreign-born:
86.5% (64)
American Indian / Alaska Native - Speak another language Native:
100.0% (42)Foreign-born:
100.0% (218)
Asian - Speak another language Native:
100.0% (2)Foreign-born:
97.8% (3)
Two or more races - Speak only English Native:
77.3% (223)Foreign-born:
2.0% (6)
Two or more races - Speak another language Native:
23.0% (66)Foreign-born:
98.2% (279)
White alone - Speak only English Native:
100.0% (1,302)Foreign-born:
13.8% (7)
Hispanic or Latino - Speak another language Native:
45.0% (111)Foreign-born:
100.0% (388)
Foreign-born residents in Greensboro 448 residents are foreign born (13.1% Latin America , 1.9% Europe ).
This city:
16.1%Maryland:
15.7%
Marital status for residents in Greensboro Marital status - White (Caucasian) population 15 years and over
Males 31.4% Never married45.5% Now married1.7% Separated13.8% Widowed7.6% DivorcedFemales 39.4% Never married36.4% Now married2.8% Separated9.4% Widowed12.0% DivorcedWomen who gave birth in the past 12 months Now married:
64.5% (19)Unmarried:
35.5% (10)
Women who did not give birth in the past 12 months Now married:
38.4% (171)Unmarried:
61.6% (273)
Marital status - Black or African American population 15 years and over
Males 20.5% Never married65.0% Now married0.0% Separated5.1% Widowed9.4% DivorcedFemales 64.9% Never married32.1% Now married0.0% Separated3.1% Widowed0.0% DivorcedWomen who gave birth in the past 12 months Now married:
0.0% (0)Unmarried:
100.0% (9)
Women who did not give birth in the past 12 months Now married:
28.4% (26)Unmarried:
71.6% (67)
Marital status - American Indian / Alaska Native population 15 years and over
Males 53.2% Never married46.8% Now married0.0% Separated0.0% Widowed0.0% DivorcedFemales 0.0% Never married38.7% Now married0.0% Separated0.0% Widowed61.3% DivorcedWomen who gave birth in the past 12 months Now married:
0.0% (0)Unmarried:
100.0% (28)
Women who did not give birth in the past 12 months Now married:
100.0% (18)Unmarried:
0.0% (0)
Marital status - Two or more races population 15 years and over
Males 18.6% Never married81.4% Now married0.0% Separated0.0% Widowed0.0% DivorcedFemales 65.1% Never married31.0% Now married0.0% Separated1.6% Widowed2.3% DivorcedWomen who gave birth in the past 12 months Now married:
100.0% (15)Unmarried:
0.0% (0)
Women who did not give birth in the past 12 months Now married:
21.6% (29)Unmarried:
78.4% (106)
Marital status - White alone, not Hispanic / Latino population 15 years and over
Males 29.1% Never married47.1% Now married1.8% Separated14.2% Widowed7.8% DivorcedFemales 36.9% Never married37.1% Now married3.0% Separated10.1% Widowed12.9% DivorcedWomen who gave birth in the past 12 months Now married:
64.5% (19)Unmarried:
35.5% (11)
Women who did not give birth in the past 12 months Now married:
40.6% (170)Unmarried:
59.4% (249)
Marital status - Hispanic or Latino population 15 years and over
Males 37.7% Never married57.1% Now married5.2% Separated0.0% Widowed0.0% DivorcedFemales 44.1% Never married42.7% Now married0.0% Separated0.0% Widowed13.3% DivorcedWomen who gave birth in the past 12 months Now married:
38.7% (13)Unmarried:
61.3% (20)
Women who did not give birth in the past 12 months Now married:
40.6% (46)Unmarried:
59.4% (67)
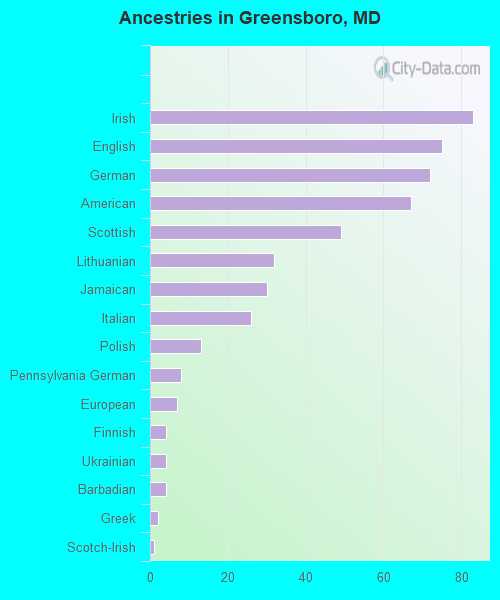
Ancestries in Greensboro
83 5.9% Irish75 5.3% English72 5.1% German67 4.7% American49 3.5% Scottish32 2.3% Lithuanian30 2.1% Jamaican26 1.8% Italian13 0.9% Polish8 0.6% Pennsylvania German7 0.5% European4 0.3% Finnish4 0.3% Ukrainian4 0.3% Barbadian2 0.1% Greek1 0.07% Scotch-Irish
Children Nativity (place of birth) in Greensboro
Children under 6 years - Living with two parents Both parents native 104 100.0% NativeBoth parents foreign-born 18 50.7% Native18 49.3% Foreign-bornOne native, one foreign-born parent 67 100.0% NativeChildren under 6 years - Living with one parent Native parent 64 100.0% NativeForeign-born parent 111 100.0% NativeChildren 6 to 17 years - Living with two parents Both parents native 254 99.7% Native1 0.3% Foreign-bornBoth parents foreign-born 30 35.5% Native54 64.5% Foreign-bornOne native, one foreign-born parent 8 100.0% NativeChildren 6 to 17 years - Living with one parent Native parent 134 100.0% NativeForeign-born parent 86 61.2% Native54 38.8% Foreign-born
Grandparents responsible for own grandchildren in Greensboro
Grandparents (30 to 59 years) White / Caucasian 2 11.8% Responsible for grandchildren13 88.2% Not responsible for grandchildrenBlack or African American 11 79.9% Responsible for grandchildren3 20.1% Not responsible for grandchildrenWhite alone, not Hispanic / Latino 2 11.2% Responsible for grandchildren14 88.8% Not responsible for grandchildrenGrandparents (60 years and over) White / Caucasian 14 62.3% Responsible for grandchildren8 37.7% Not responsible for grandchildrenBlack or African American 3 100.0% Not responsible for grandchildrenWhite alone, not Hispanic / Latino 14 60.7% Responsible for grandchildren9 39.3% Not responsible for grandchildren