Races in Green Valley, Maryland (MD) Detailed Stats
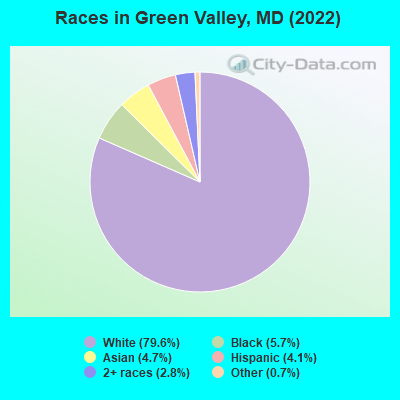
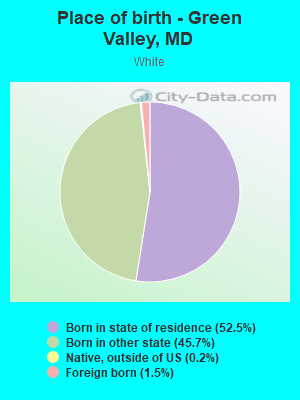
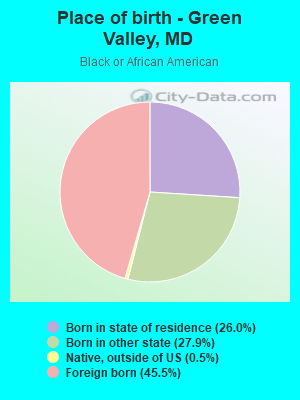
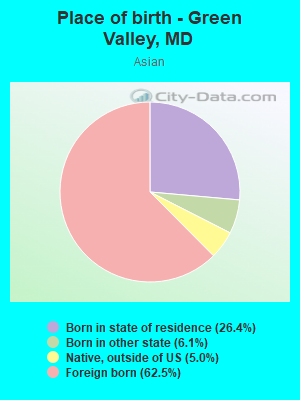
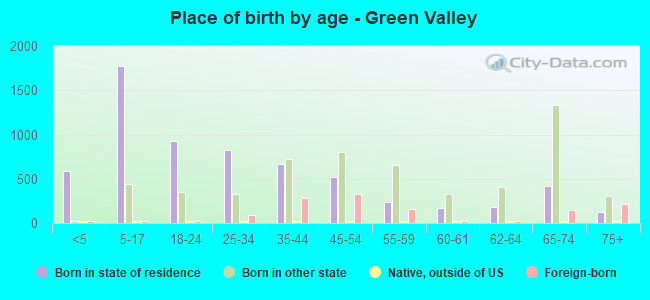
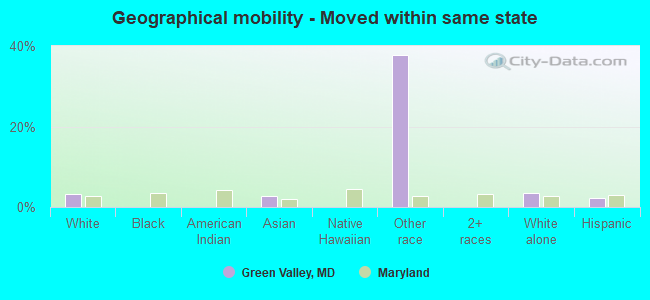
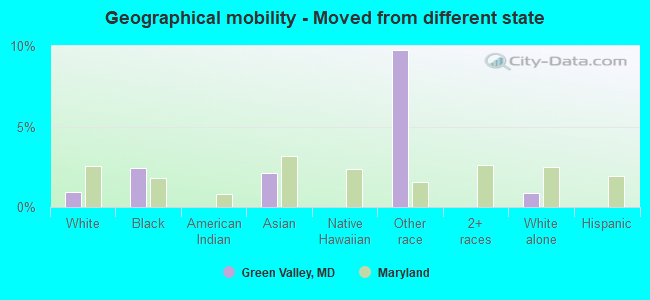
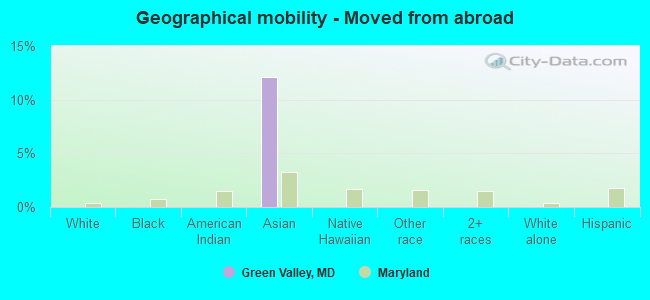
According to 2022 data, the most numerous races in Green Valley, MD are White alone (10,828 residents), Black alone (773 residents), and Hispanic (559 residents). 88.9% of Green Valley residents speak English at home. 7.9% of Green Valley, MD residents are foreign-born (2.8% born in Africa, 2.7% born in Asia, 1.2% born in Latin America, 1.0% born in Europe), which is 103.5% less than the foreign-born rate of 16.0% across the entire state of Maryland.
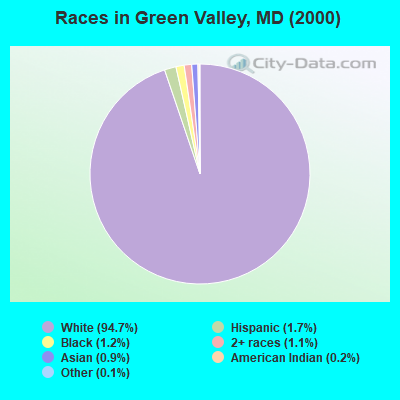
Race distribution in Green Valley
2000 2022
3,286,547 62.1% White alone 1,464,735 27.7% Black alone 227,916 4.3% Hispanic 209,738 4.0% Asian alone 82,946 1.6% Two or more races 13,312 0.3% American Indian alone 9,379 0.2% Other race alone 1,913 0.04% Native Hawaiian and Other
2,906,492 47.1% White alone 1,800,914 29.2% Black alone 705,842 11.4% Hispanic 401,818 6.5% Asian alone 291,317 4.7% Two or more races 46,930 0.8% Other race alone 8,930 0.1% American Indian alone 2,417 0.04% Native Hawaiian and Other
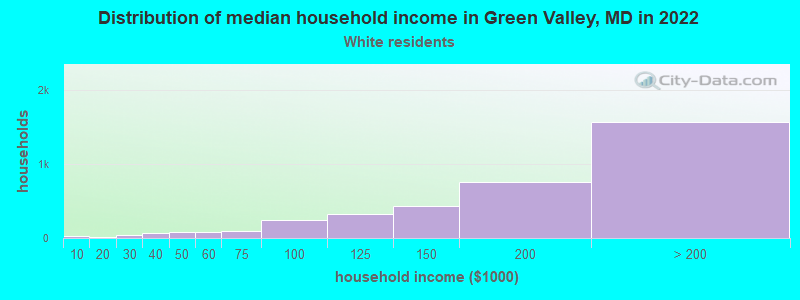
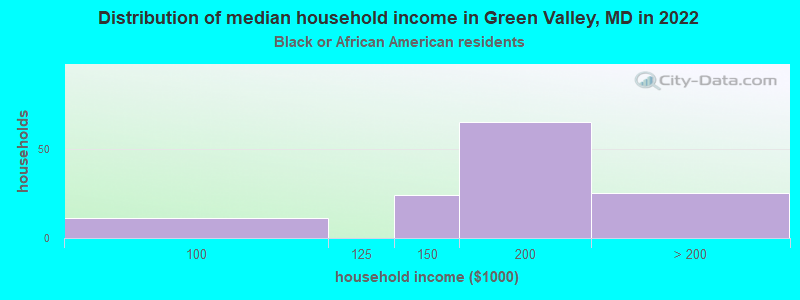
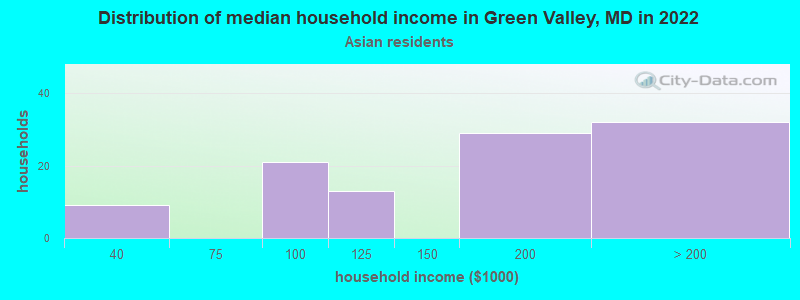
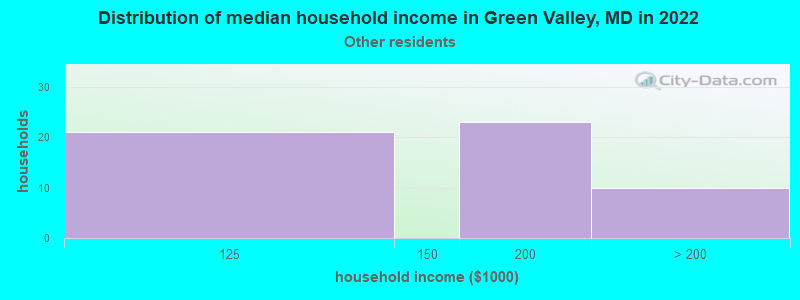
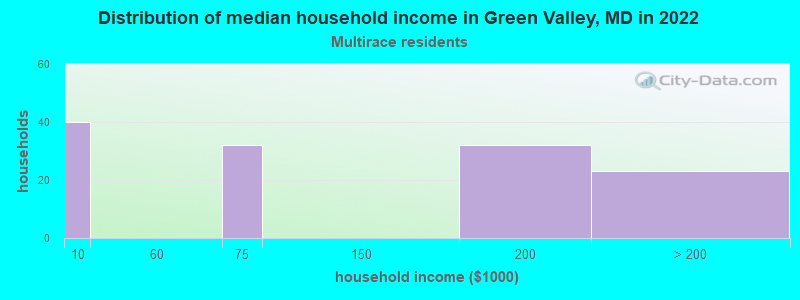
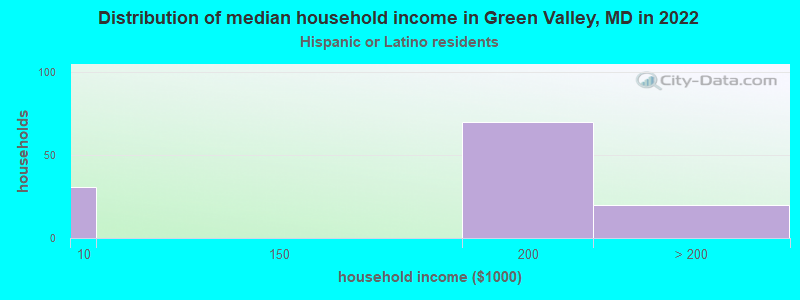
Income and house value in Green Valley Median household income in 2022 $164,748 White non-Hispanic householdersover $200,000 Black householders$151,151 Asian householders$187,620 Some other race householdersover $200,000 Hispanic or Latino race householdersMedian 2022 house value $599,080 White Non-Hispanic householders$499,379 Two or more races householders$473,725 Hispanic or Latino householders
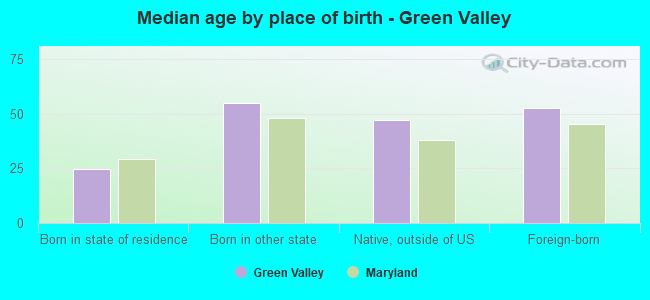
Median age by race in Green Valley
44.5 Median age for White residents44.3 44.5 49.2 Median age for Black or African American residents48.5 37.8 -478,555,304.3 Median age for American Indian / Alaska Native residents-405,255,877.9 -532,350,531.8 39.7 Median age for Asian residents27.1 46.3 -763,333,332.6 Median age for Native Hawaiian / Pacific Islander residents-720,061,021.4 -760,942,760.2 27.8 Median age for Other race residents44.3 26.2 33.0 Median age for Two or more races residents31.7 45.5 44.6 Median age for White alone residents43.8 44.8 32.4 Median age for Hispanic or Latino residents34.0 11.0
Owner/renter occupied households by race in Green Valley
House owners and renters - White residents 3,498 96.6% Owner occupied123 3.4% Renter occupiedHouse owners and renters - Black or African American residents 135 100.0% Owner occupiedHouse owners and renters - Asian residents 148 100.0% Owner occupiedHouse owners and renters - Native Hawaiian / Pacific Islander residents 5 100.0% Owner occupiedHouse owners and renters - Other race residents 86 100.0% Owner occupiedHouse owners and renters - Two or more races residents 162 100.0% Owner occupiedHouse owners and renters - White alone residents 3,541 96.5% Owner occupied130 3.5% Renter occupiedHouse owners and renters - Hispanic or Latino residents 148 100.0% Owner occupied
Language usage in Green Valley
English speakers - Total 88.9% of residents of Green Valley speak English at home.
2.4% of residents speak Spanish at home 209 67.2% Speak English very well102 32.8% Speak English less than very well7.8% of residents speak other language at home 521 51.1% Speak English very well499 48.9% Speak English less than very well
English speakers - Born in the United States 95.0% of residents of Green Valley speak English at home.
1.4% of residents speak Spanish at home 81 100.0% Speak English very well2.2% of residents speak other language at home 117 92.1% Speak English very well10 7.9% Speak English less than very well
All residents speak only English at home
English speakers - Foreign-born 23.1% of residents of Green Valley speak English at home.
14.1% of residents speak Spanish at home 124 71.3% Speak English very well50 28.7% Speak English less than very well69.9% of residents speak other language at home 370 42.9% Speak English very well492 57.1% Speak English less than very well
White (Caucasian) - Speak only English Native:
99.7% (10,078)Foreign-born:
43.9% (71)
White (Caucasian) - Speak another language Native:
0.9% (94)Foreign-born:
56.7% (92)
Black or African American - Speak only English Native:
82.5% (386)Foreign-born:
27.2% (109)
Black or African American - Speak another language Native:
21.0% (98)Foreign-born:
73.3% (295)
Asian - Speak only English Native:
84.3% (129)Foreign-born:
22.5% (91)
Asian - Speak another language Native:
24.3% (37)Foreign-born:
77.3% (311)
Other race - Speak only English Native:
52.4% (57)Foreign-born:
14.0% (8)
Other race - Speak another language Native:
38.1% (41)Foreign-born:
83.8% (49)
Two or more races - Speak only English Native:
95.3% (498)Foreign-born:
10.3% (20)
Two or more races - Speak another language Native:
4.4% (23)Foreign-born:
89.8% (172)
White alone - Speak only English Native:
99.0% (10,098)Foreign-born:
37.1% (80)
White alone - Speak another language Native:
1.1% (109)Foreign-born:
62.1% (134)
Hispanic or Latino - Speak only English Native:
84.9% (262)Foreign-born:
4.0% (7)
Hispanic or Latino - Speak another language Native:
14.1% (43)Foreign-born:
96.7% (175)
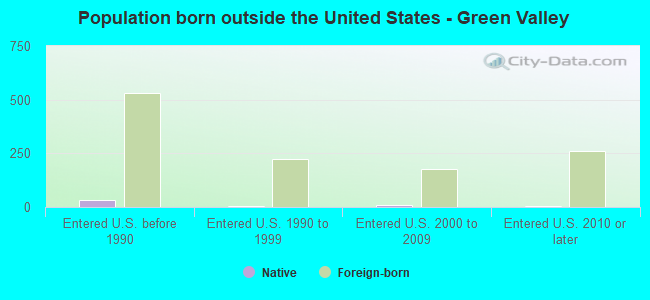
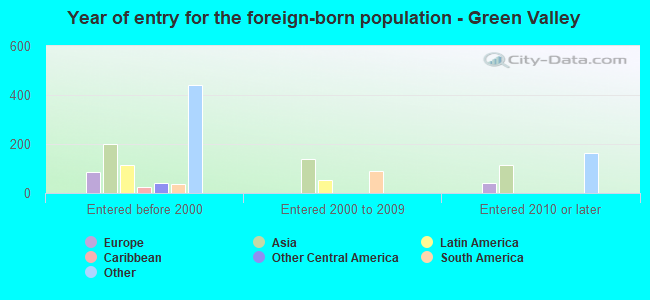
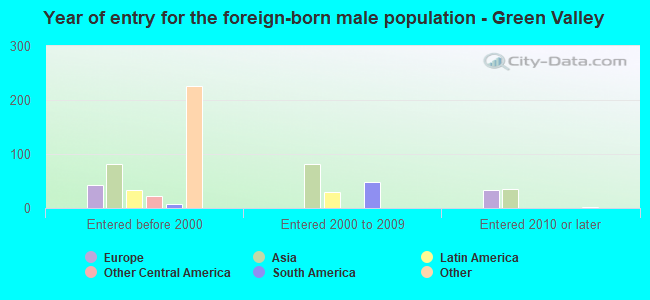
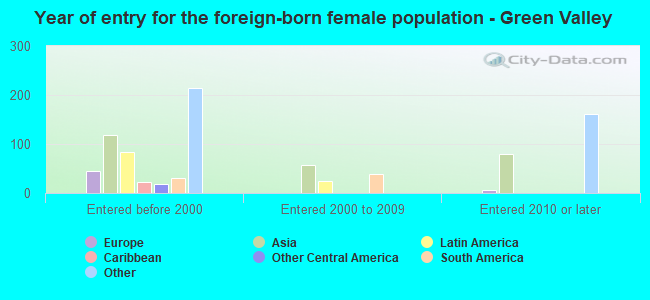
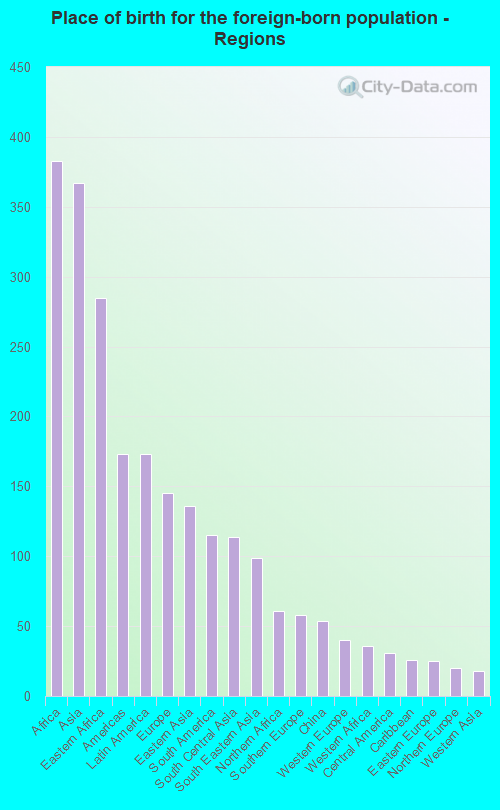
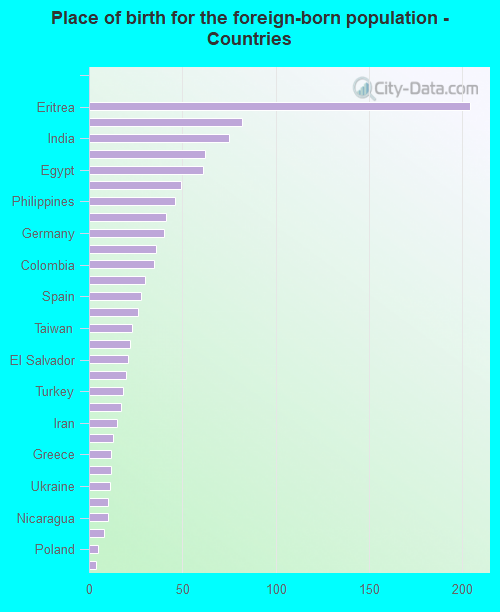
Foreign-born residents in Green Valley 1,070 residents are foreign born (2.8% Africa , 2.7% Asia , 1.2% Latin America , 1.0% Europe ).
This city:
7.9%Maryland:
15.7%
Marital status for residents in Green Valley Marital status - White (Caucasian) population 15 years and over
Males 27.4% Never married62.6% Now married1.1% Separated2.1% Widowed6.8% DivorcedFemales 22.8% Never married68.5% Now married0.0% Separated5.3% Widowed3.4% DivorcedWomen who gave birth in the past 12 months Now married:
100.0% (81)Unmarried:
0.0% (0)
Women who did not give birth in the past 12 months Now married:
49.0% (863)Unmarried:
51.0% (899)
Marital status - Black or African American population 15 years and over
Males 61.6% Never married38.4% Now married0.0% Separated0.0% Widowed0.0% DivorcedFemales 45.0% Never married48.5% Now married0.0% Separated2.8% Widowed3.8% DivorcedWomen who gave birth in the past 12 months Now married:
100.0% (9)Unmarried:
0.0% (0)
Women who did not give birth in the past 12 months Now married:
8.4% (19)Unmarried:
91.6% (206)
Marital status - Asian population 15 years and over
Males 37.6% Never married51.6% Now married0.0% Separated0.0% Widowed10.8% DivorcedFemales 11.7% Never married59.6% Now married0.0% Separated13.0% Widowed15.7% DivorcedWomen who gave birth in the past 12 months Now married:
100.0% (22)Unmarried:
0.0% (0)
Women who did not give birth in the past 12 months Now married:
54.8% (60)Unmarried:
45.2% (50)
Marital status - Other race population 15 years and over
Males 0.0% Never married100.0% Now married0.0% Separated0.0% Widowed0.0% DivorcedFemales 0.0% Never married100.0% Now married0.0% Separated0.0% Widowed0.0% DivorcedWomen who did not give birth in the past 12 months Now married:
100.0% (79)Unmarried:
0.0% (0)
Marital status - Two or more races population 15 years and over
Males 48.9% Never married35.1% Now married0.0% Separated0.0% Widowed16.1% DivorcedFemales 17.1% Never married55.9% Now married0.0% Separated6.6% Widowed20.4% DivorcedWomen who did not give birth in the past 12 months Now married:
44.0% (57)Unmarried:
56.0% (73)
Marital status - White alone, not Hispanic / Latino population 15 years and over
Males 27.3% Never married62.7% Now married1.1% Separated2.1% Widowed6.9% DivorcedFemales 23.1% Never married68.0% Now married0.0% Separated5.4% Widowed3.5% DivorcedWomen who gave birth in the past 12 months Now married:
100.0% (86)Unmarried:
0.0% (0)
Women who did not give birth in the past 12 months Now married:
47.7% (865)Unmarried:
52.3% (947)
Marital status - Hispanic or Latino population 15 years and over
Males 27.8% Never married72.2% Now married0.0% Separated0.0% Widowed0.0% DivorcedFemales 0.0% Never married81.6% Now married0.0% Separated0.0% Widowed18.4% DivorcedWomen who did not give birth in the past 12 months Now married:
72.2% (76)Unmarried:
27.8% (29)
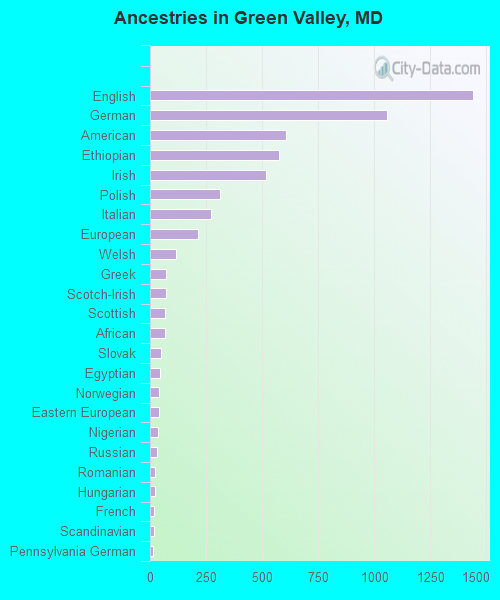
Ancestries in Green Valley
1,440 23.0% English1,055 16.8% German606 9.7% American577 9.2% Ethiopian519 8.3% Irish312 5.0% Polish274 4.4% Italian212 3.4% European117 1.9% Welsh71 1.1% Greek71 1.1% Scotch-Irish65 1.0% Scottish65 1.0% African51 0.8% Slovak45 0.7% Egyptian42 0.7% Norwegian40 0.6% Eastern European34 0.5% Nigerian31 0.5% Russian24 0.4% Romanian24 0.4% Hungarian16 0.3% French16 0.3% Scandinavian15 0.2% Pennsylvania German13 0.2% Brazilian13 0.2% Dutch12 0.2% Ukrainian10 0.2% Basque10 0.2% British10 0.2% Northern European7 0.1% Iranian7 0.1% Swedish1 0.02% Kenyan
Children Nativity (place of birth) in Green Valley
Children under 6 years - Living with two parents Both parents native 692 100.0% NativeBoth parents foreign-born 82 100.0% NativeOne native, one foreign-born parent 90 100.0% NativeChildren under 6 years - Living with one parent Native parent 36 100.0% NativeChildren 6 to 17 years - Living with two parents Both parents native 1,544 99.5% Native8 0.5% Foreign-bornBoth parents foreign-born 111 86.5% Native17 13.5% Foreign-bornOne native, one foreign-born parent 211 100.0% NativeChildren 6 to 17 years - Living with one parent Native parent 146 100.0% NativeForeign-born parent 38 46.4% Native44 53.6% Foreign-born
Grandparents responsible for own grandchildren in Green Valley
Grandparents (30 to 59 years) White / Caucasian 14 100.0% Not responsible for grandchildrenWhite alone, not Hispanic / Latino 15 100.0% Not responsible for grandchildrenGrandparents (60 years and over) White / Caucasian 39 11.1% Responsible for grandchildren317 88.9% Not responsible for grandchildrenWhite alone, not Hispanic / Latino 39 10.2% Responsible for grandchildren347 89.8% Not responsible for grandchildren