Races in Green River, Wyoming (WY) Detailed Stats
Ancestries, Foreign-born residents, place of birth
Settings
X


Recent posts about races in Green River, Wyoming on our local forum with over 2,400,000 registered users:
 | Lander or Riverton to buy a house , any recommendations Please ? ! (23 replies) |
| Green River / Rock Springs Acceptance? (32 replies) |
| Do you see the Urban Sprawl of Ft. Collins and Denver Coming to Cheyenne? (68 replies) |
| Well, It's Official I am Moving to the Rock Springs Area (82 replies) |
| possible retirement move to WY (49 replies) |
| Where to retire in Wyoming (25 replies) |
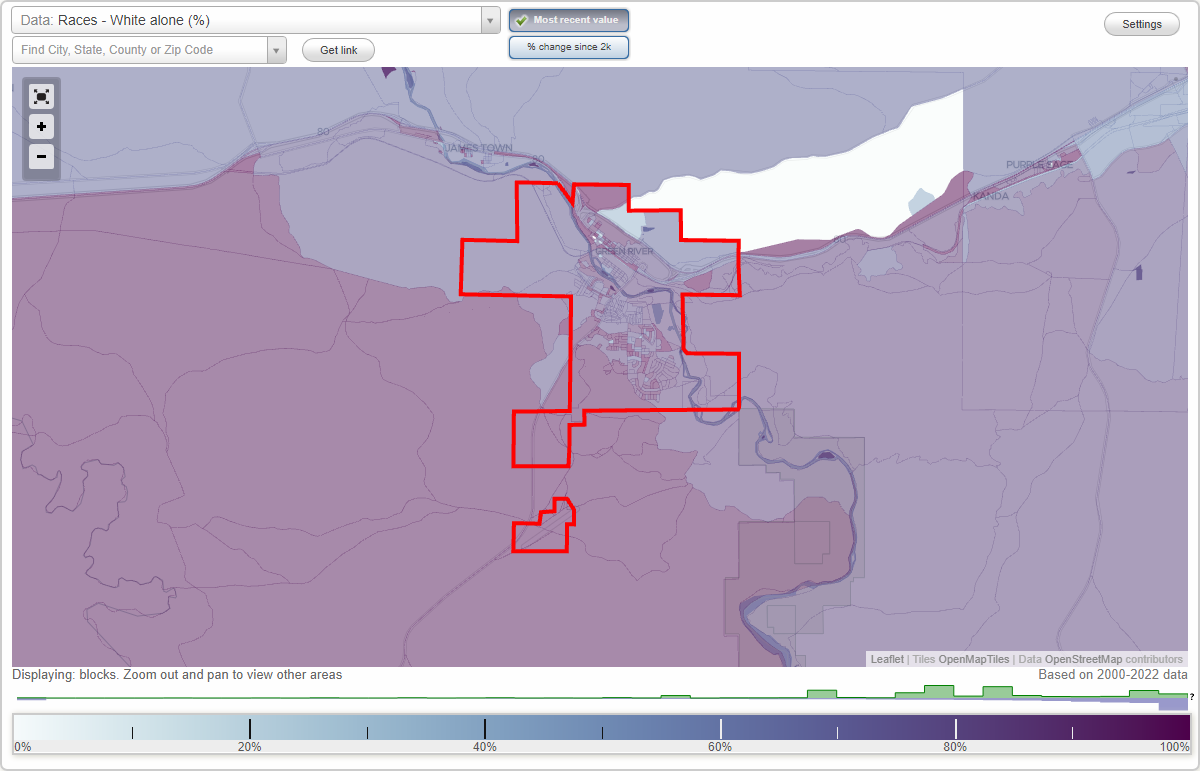
According to 2022 data, the most numerous races in Green River, WY are White alone (9,477 residents), Hispanic (1,778 residents), and Two or more races (293 residents). 93.0% of Green River residents speak English at home. 3.8% of Green River, WY residents are foreign-born (1.7% born in Latin America, 0.9% born in Europe, 0.9% born in Asia), which is 20.5% greater than the foreign-born rate of 3.0% across the entire state of Wyoming.
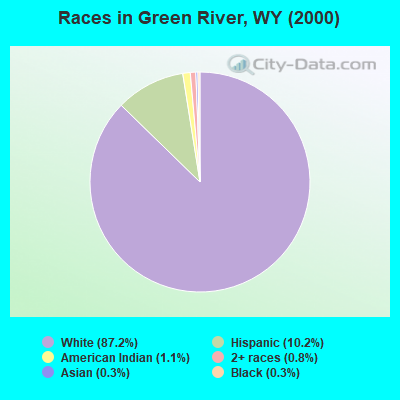
Race distribution in Green River
2000
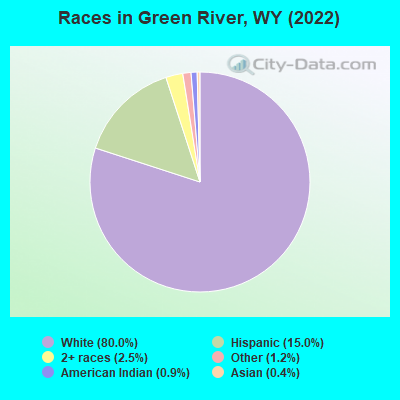
2022

- 10,29387.2%White alone
- 1,20610.2%Hispanic
- 1341.1%American Indian alone
- 970.8%Two or more races
- 320.3%Black alone
- 360.3%Asian alone
- 60.05%Other race alone
- 40.03%Native Hawaiian and Other
Pacific Islander alone
-
- 9,47780.0%White alone
- 1,77815.0%Hispanic
- 2932.5%Two or more races
- 1461.2%Other race alone
- 1100.9%American Indian alone
- 470.4%Asian alone
- 110.09%Native Hawaiian and Other
Pacific Islander alone
2000
2022
-
- 438,79988.9%White alone
- 31,6696.4%Hispanic
- 10,2382.1%American Indian alone
- 6,1641.2%Two or more races
- 3,5040.7%Black alone
- 2,6700.5%Asian alone
- 4740.10%Other race alone
- 2640.05%Native Hawaiian and Other
Pacific Islander alone

-
- 473,22081.4%White alone
- 62,80310.8%Hispanic
- 22,9113.9%Two or more races
- 9,5891.6%American Indian alone
- 4,9970.9%Other race alone
- 3,9900.7%Black alone
- 3,5770.6%Asian alone
- 2940.05%Native Hawaiian and Other
Pacific Islander alone

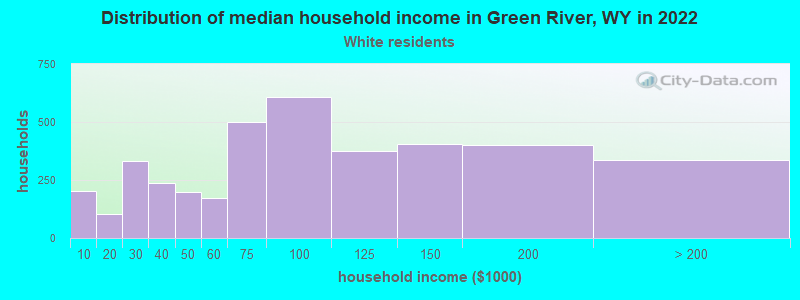
Income and house value in Green River
- Median household income in 2022
- $83,110White non-Hispanic householders
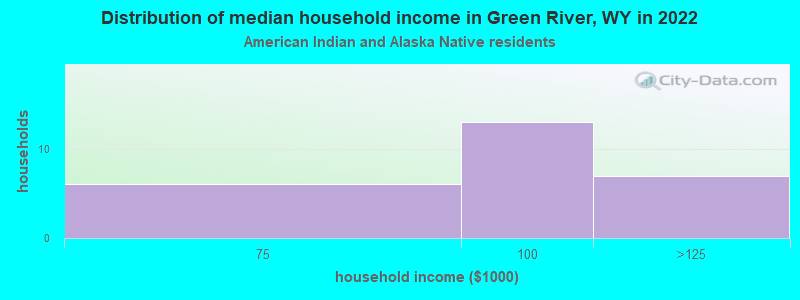
- $52,810American Indian and Alaska Native householders
- $64,439Two or more races householders
- $69,952Hispanic or Latino race householders
- Median 2022 house value
- $283,187White Non-Hispanic householders
- $264,362Black or African American householders
- $320,838American Indian or Alaska Native householders
- $302,551Asian householders
- $288,566Some other race householders
- $228,594Two or more races householders
- $259,521Hispanic or Latino householders
Household income for White non-Hispanic householders
Household income for American Indian and Alaska Native householders
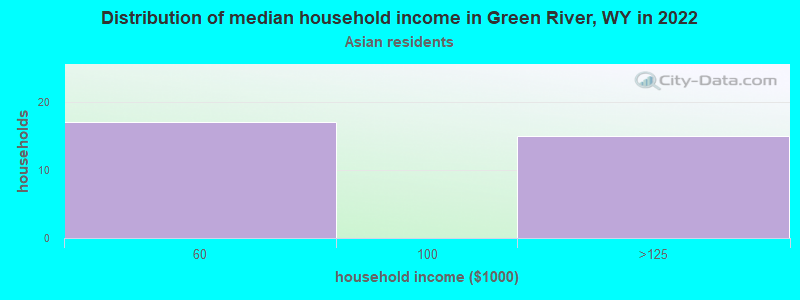
Household income for Asian householders
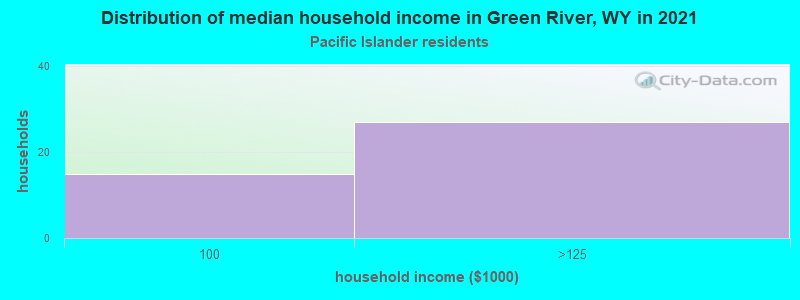
Household income for Native Hawaiian and other Pacific Islander householders
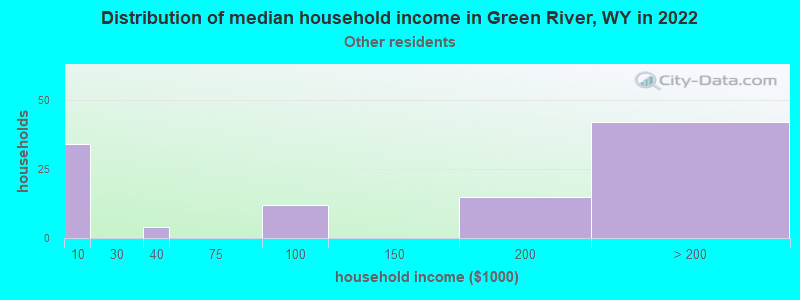
Household income for Some other race householders
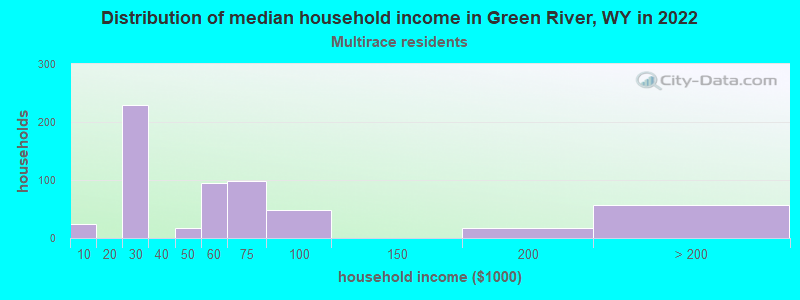
Household income for Two or more races householders
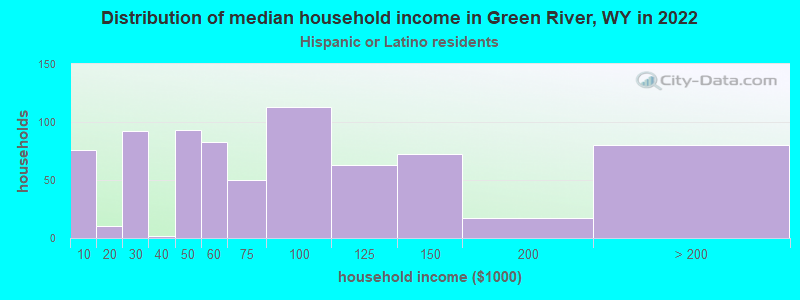
Household income for Hispanic or Latino race householders
Median age by race in Green River
- 40.2Median age for White residents
- 39.6Males
- 40.5Females
- -662,146,892.0Median age for Black or African American residents
- -558,558,558.0Males
- -746,302,615.9Females
- 53.1Median age for American Indian / Alaska Native residents
- 62.6Males
- 45.6Females
- 60.8Median age for Asian residents
- -684,684,684.0Males
- 68.9Females
- -594,708,994.1Median age for Native Hawaiian / Pacific Islander residents
- -652,729,383.8Males
- -865,828,091.4Females
- 36.0Median age for Other race residents
- 42.3Males
- 20.3Females
- 22.1Median age for Two or more races residents
- 24.7Males
- 22.9Females
- 39.3Median age for White alone residents
- 39.1Males
- 39.4Females
- 32.6Median age for Hispanic or Latino residents
- 38.3Males
- 22.4Females
Owner/renter occupied households by race in Green River
- House owners and renters - White residents
- 2,99876.7%Owner occupied
- 91223.3%Renter occupied
- House owners and renters - American Indian / Alaska Native residents
- 1841.3%Owner occupied
- 2658.7%Renter occupied
- House owners and renters - Asian residents
- 38100.0%Renter occupied
- House owners and renters - Native Hawaiian / Pacific Islander residents
- 2955.5%Owner occupied
- 2344.5%Renter occupied
- House owners and renters - Other race residents
- 3736.0%Owner occupied
- 6564.0%Renter occupied
- House owners and renters - Two or more races residents
- 47280.9%Owner occupied
- 11219.1%Renter occupied
- House owners and renters - White alone residents
- 2,83177.1%Owner occupied
- 84122.9%Renter occupied
- House owners and renters - Hispanic or Latino residents
- 55176.4%Owner occupied
- 17023.6%Renter occupied
Language usage in Green River
- English speakers - Total
- 93.0% of residents of Green River speak English at home.
- 5.8% of residents speak Spanish at home
- 38660.0%Speak English very well
- 25740.0%Speak English less than very well
- 1.4% of residents speak other language at home
- 13388.1%Speak English very well
- 1811.9%Speak English less than very well
- English speakers - Born in the United States
- 97.2% of residents of Green River speak English at home.
- 2.4% of residents speak Spanish at home
- 10272.3%Speak English very well
- 3927.7%Speak English less than very well
- 0.5% of residents speak other language at home
- 27100.0%Speak English very well
- English speakers - Native, born elsewhere
- 53.8% of residents of Green River speak English at home.
- 29.7% of residents speak Spanish at home
- 27100.0%Speak English very well
- 8.8% of residents speak other language at home
- 8100.0%Speak English very well
- English speakers - Foreign-born
- 8.1% of residents of Green River speak English at home.
- 64.1% of residents speak Spanish at home
- 10943.1%Speak English very well
- 14456.9%Speak English less than very well
- 28.1% of residents speak other language at home
- 9081.1%Speak English very well
- 2118.9%Speak English less than very well
White (Caucasian) - Speak only English
| Native: | 98.6% (9,129) |
| Foreign-born: | 9.2% (11) |
White (Caucasian) - Speak another language
| Native: | 1.5% (135) |
| Foreign-born: | 81.2% (96) |
Asian - Speak only English
| Native: | 100.0% (3) |
| Foreign-born: | 48.5% (25) |
Other race - Speak another language
| Native: | 29.0% (68) |
| Foreign-born: | 100.0% (175) |
Two or more races - Speak only English
| Native: | 86.1% (1,093) |
| Foreign-born: | 5.3% (2) |
Two or more races - Speak another language
| Native: | 13.9% (176) |
| Foreign-born: | 92.2% (40) |
White alone - Speak only English
| Native: | 99.4% (8,796) |
| Foreign-born: | 15.7% (12) |
White alone - Speak another language
| Native: | 0.8% (73) |
| Foreign-born: | 86.2% (67) |
Hispanic or Latino - Speak another language
| Native: | 22.2% (325) |
| Foreign-born: | 100.0% (242) |
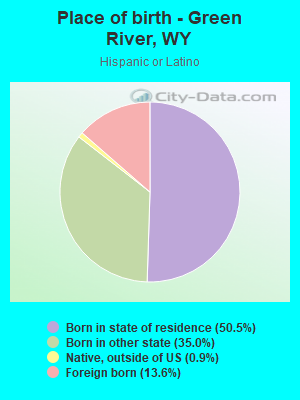
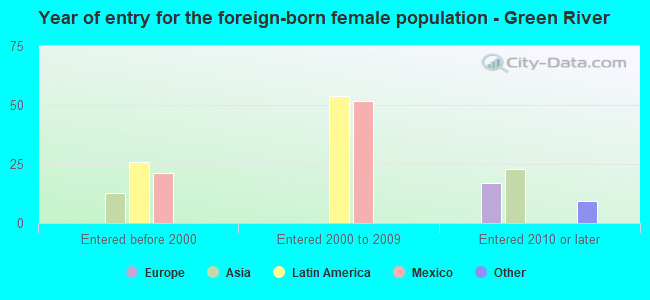
Foreign-born residents in Green River
447 residents are foreign born (1.7% Latin America, 0.9% Europe, 0.9% Asia).
| This city: | 3.8% |
| Wyoming: | 3.4% |

Marital status for residents in Green River
Marital status - White (Caucasian) population 15 years and over
- Males
- 22.5%Never married
- 62.5%Now married
- 1.4%Separated
- 5.9%Widowed
- 7.8%Divorced
- Females
- 18.0%Never married
- 61.5%Now married
- 0.3%Separated
- 7.9%Widowed
- 12.3%Divorced
Women who gave birth in the past 12 months
| Now married: | 94.2% (78) |
| Unmarried: | 5.8% (5) |
Women who did not give birth in the past 12 months
| Now married: | 56.8% (1,240) |
| Unmarried: | 43.2% (942) |
Marital status - American Indian / Alaska Native population 15 years and over
- Males
- 44.4%Never married
- 55.6%Now married
- 0.0%Separated
- 0.0%Widowed
- 0.0%Divorced
- Females
- 36.2%Never married
- 10.3%Now married
- 0.0%Separated
- 53.4%Widowed
- 0.0%Divorced
Women who did not give birth in the past 12 months
| Now married: | 22.2% (5) |
| Unmarried: | 77.8% (19) |
Marital status - Asian population 15 years and over
- Males
- 54.8%Never married
- 45.2%Now married
- 0.0%Separated
- 0.0%Widowed
- 0.0%Divorced
- Females
- 0.0%Never married
- 100.0%Now married
- 0.0%Separated
- 0.0%Widowed
- 0.0%Divorced
Women who did not give birth in the past 12 months
| Now married: | 100.0% (25) |
| Unmarried: | 0.0% (0) |
Marital status - Other race population 15 years and over
- Males
- 31.4%Never married
- 68.6%Now married
- 0.0%Separated
- 0.0%Widowed
- 0.0%Divorced
- Females
- 53.4%Never married
- 35.6%Now married
- 0.0%Separated
- 0.0%Widowed
- 11.0%Divorced
Women who did not give birth in the past 12 months
| Now married: | 35.6% (31) |
| Unmarried: | 64.4% (56) |
Marital status - Two or more races population 15 years and over
- Males
- 34.8%Never married
- 37.3%Now married
- 0.0%Separated
- 14.2%Widowed
- 13.7%Divorced
- Females
- 33.7%Never married
- 37.5%Now married
- 17.5%Separated
- 1.8%Widowed
- 9.5%Divorced
Women who gave birth in the past 12 months
| Now married: | 100.0% (70) |
| Unmarried: | 0.0% (0) |
Women who did not give birth in the past 12 months
| Now married: | 37.5% (150) |
| Unmarried: | 62.5% (250) |
Marital status - White alone, not Hispanic / Latino population 15 years and over
- Males
- 22.2%Never married
- 61.7%Now married
- 1.5%Separated
- 6.3%Widowed
- 8.3%Divorced
- Females
- 18.6%Never married
- 60.8%Now married
- 0.3%Separated
- 8.1%Widowed
- 12.1%Divorced
Women who gave birth in the past 12 months
| Now married: | 94.2% (80) |
| Unmarried: | 5.8% (5) |
Women who did not give birth in the past 12 months
| Now married: | 58.0% (1,243) |
| Unmarried: | 42.0% (901) |
Marital status - Hispanic or Latino population 15 years and over
- Males
- 23.9%Never married
- 68.7%Now married
- 0.0%Separated
- 4.8%Widowed
- 2.6%Divorced
- Females
- 26.6%Never married
- 53.1%Now married
- 4.5%Separated
- 2.2%Widowed
- 13.6%Divorced
Women who gave birth in the past 12 months
| Now married: | 100.0% (26) |
| Unmarried: | 0.0% (0) |
Women who did not give birth in the past 12 months
| Now married: | 28.0% (94) |
| Unmarried: | 72.0% (241) |
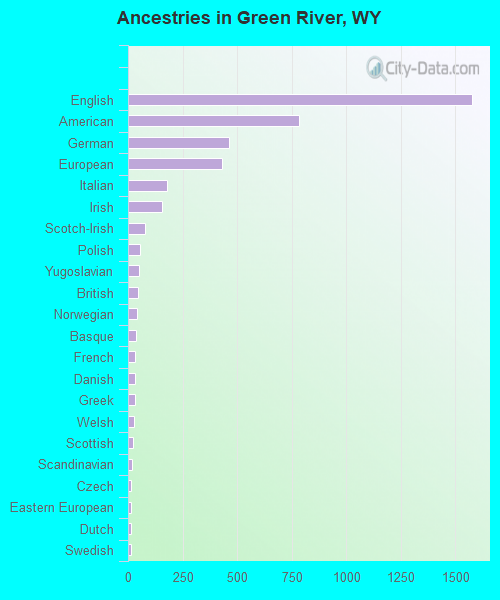
Ancestries in Green River

- 1,57728.0%English
- 78313.9%American
- 4658.2%German
- 4327.7%European
- 1773.1%Italian
- 1552.7%Irish
- 791.4%Scotch-Irish
- 551.0%Polish
- 500.9%Yugoslavian
- 440.8%British
- 430.8%Norwegian
- 380.7%Basque
- 340.6%French
- 310.5%Danish
- 310.5%Greek
- 280.5%Welsh
- 240.4%Scottish
- 180.3%Scandinavian
- 160.3%Czech
- 160.3%Eastern European
- 150.3%Dutch
- 150.3%Swedish
- 90.2%Canadian
- 90.2%Czechoslovakian
- 90.2%Finnish
- 90.2%Ukrainian
- 30.05%Swiss
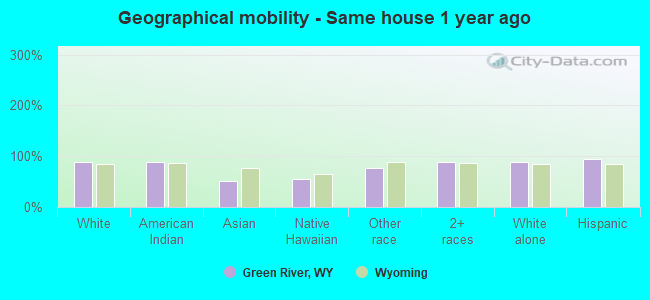
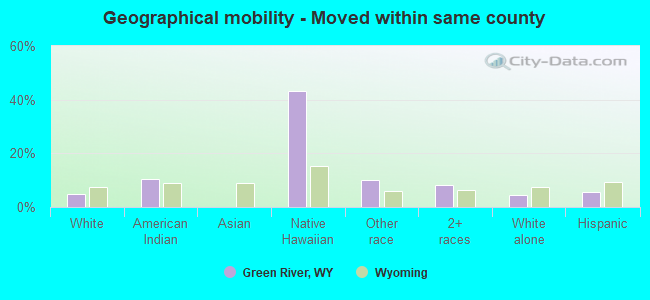
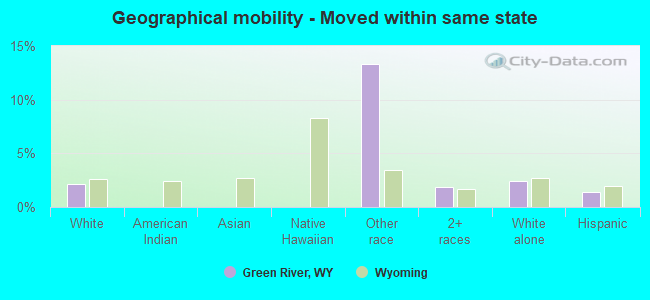
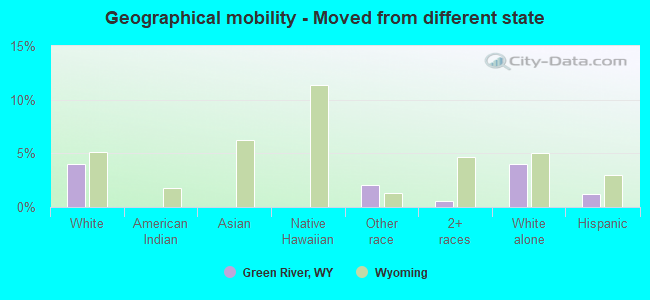
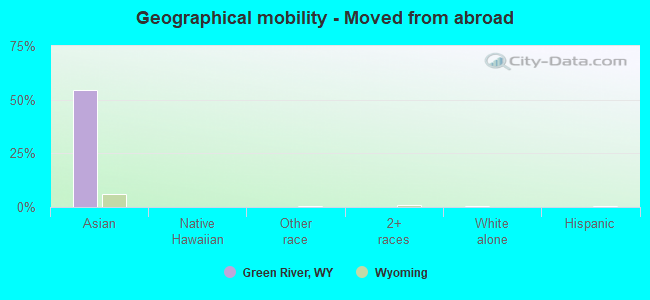
Geographical mobility in Green River

- Same house 1 year ago
- 8,79888.7%White (Caucasian)
- 11289.6%American Indian / Alaska Native
- 3250.7%Asian
- 2754.9%Native Hawaiian / Pacific Islander
- 32376.5%Other race
- 1,20488.8%Two or more races
- 8,35388.5%White alone, not Hispanic / Latino
- 1,65894.1%Hispanic or Latino
-
- Moved within same county
- 4694.7%White / Caucasian
- 1310.6%American Indian / Alaska Native
- 2143.2%Native Hawaiian / Pacific Islander
- 4210.0%Other race
- 1148.4%Two or more races
- 4284.5%White alone, not Hispanic / Latino
- 975.5%Hispanic or Latino
-
- Moved within same state
- 2162.2%White / Caucasian
- 5613.4%Other race
- 251.8%Two or more races
- 2302.4%White alone, not Hispanic / Latino
- 251.4%Hispanic or Latino
-
- Moved from different state
- 4014.0%White / Caucasian
- 82.0%Other race
- 80.6%Two or more races
- 3814.0%White alone, not Hispanic / Latino
- 221.2%Hispanic or Latino
-
- Moved from abroad
- 420.4%White
- 3454.6%Asian
- 470.5%White alone, not Hispanic / Latino
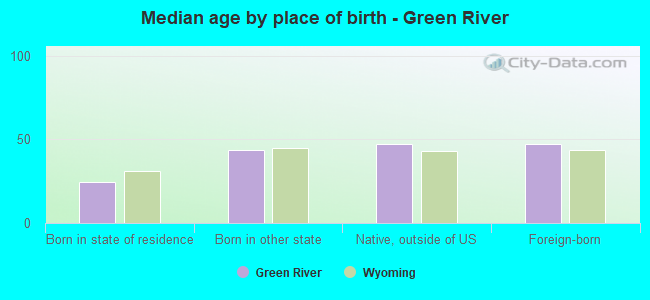
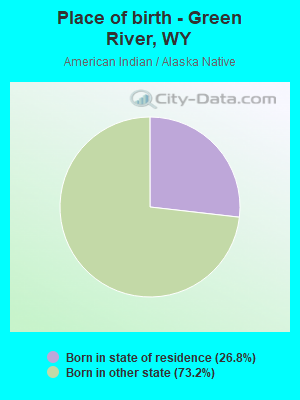
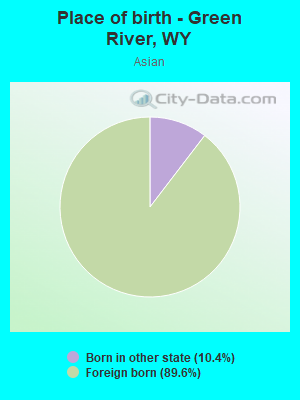
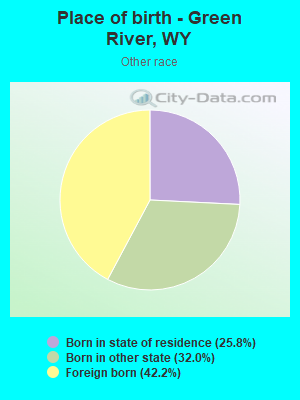
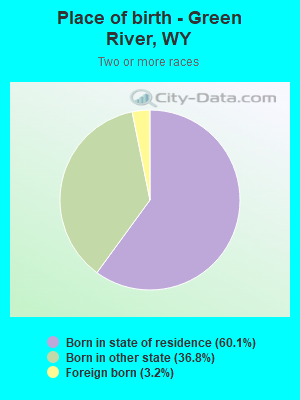
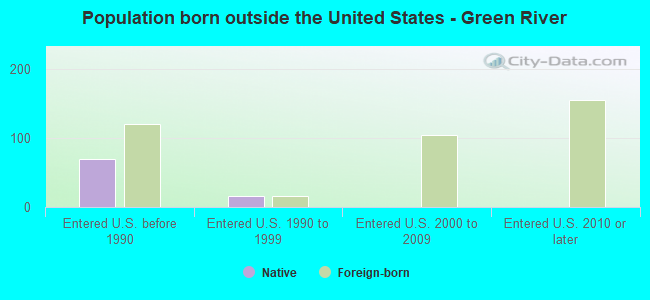
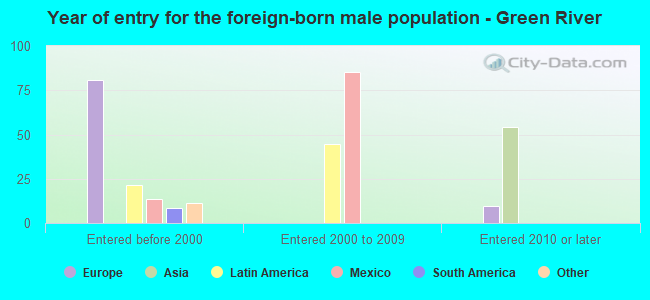
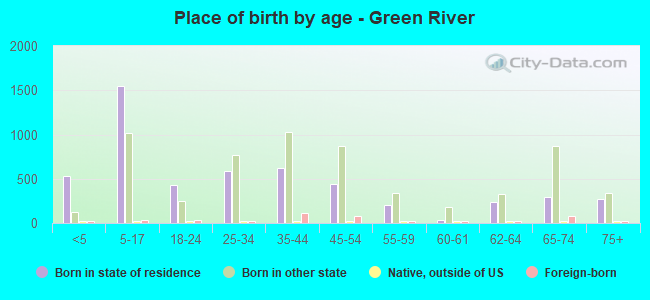
Children Nativity (place of birth) in Green River
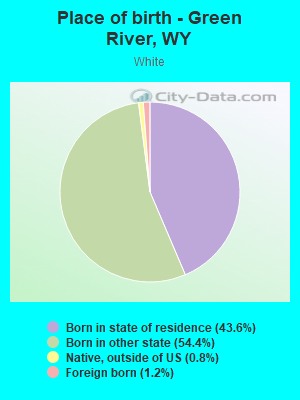
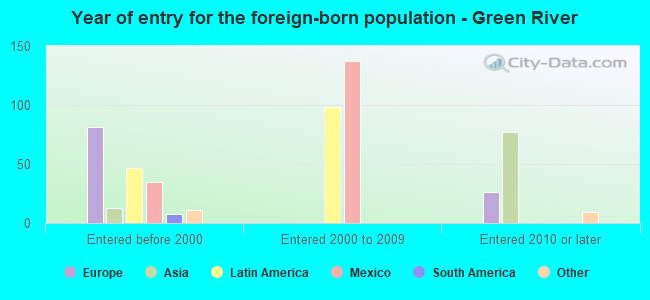
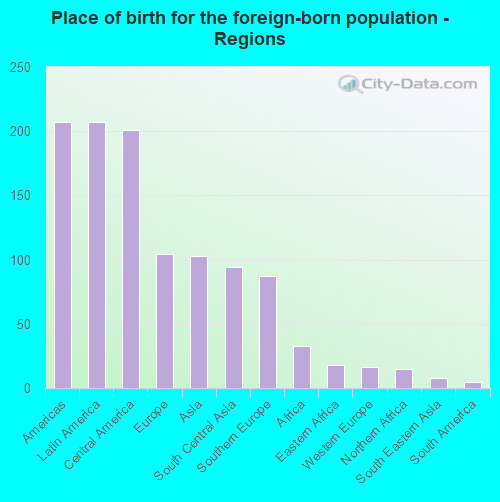
Place of birth for residents in Green River
![Place of birth for the foreign-born population - Regions]()
- 207Americas
- 207Latin America
- 201Central America
- 104Europe
- 103Asia
- 94South Central Asia
- 87Southern Europe
- 33Africa
- 18Eastern Africa
- 16Western Europe
- 15Northern Africa
- 8South Eastern Asia
- 5South America
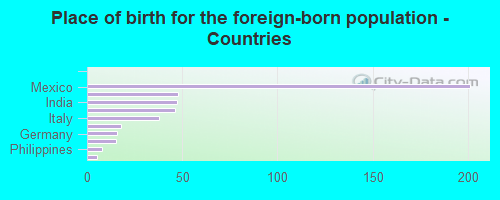
![Place of birth for the foreign-born population - Countries]()
- 201Mexico
- 48Spain
- 47India
- 46Iran
- 38Italy
- 18Uganda
- 16Germany
- 15Morocco
- 8Philippines
- 5Brazil
Grandparents responsible for own grandchildren in Green River
Zip codes: 82935.