Races in Greater Galesburg, Michigan (MI) Detailed Stats
Ancestries, Foreign-born residents, place of birth

Discuss Greater Galesburg, Michigan races on our local forum with over 2,400,000 registered users
0.5% of Greater Galesburg, MI residents are foreign-born , which is 1123.3% less than the foreign-born rate of 6.0% across the entire state of Michigan.
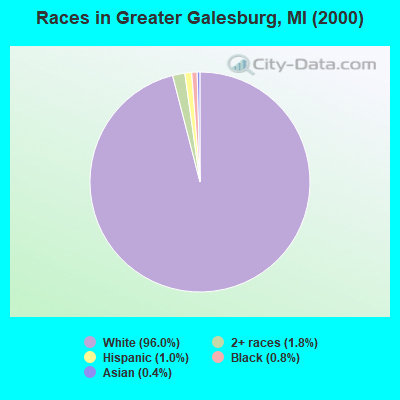
Race distribution in Greater Galesburg

- 1,56596.0%White alone
- 291.8%Two or more races
- 171.0%Hispanic
- 130.8%Black alone
- 60.4%Asian alone
- 10.06%American Indian alone
2000
2022
-
- 7,806,69178.6%White alone
- 1,402,04714.1%Black alone
- 323,8773.3%Hispanic
- 175,3111.8%Asian alone
- 163,4871.6%Two or more races
- 53,4210.5%American Indian alone
- 11,4650.1%Other race alone
- 2,1450.02%Native Hawaiian and Other
Pacific Islander alone

-
- 7,289,05172.6%White alone
- 1,310,46413.1%Black alone
- 572,4055.7%Hispanic
- 450,0314.5%Two or more races
- 335,7323.3%Asian alone
- 45,2170.5%Other race alone
- 29,0110.3%American Indian alone
- 2,2070.02%Native Hawaiian and Other
Pacific Islander alone

Income and house value in Greater Galesburg
- Median household income in 2022
- $78,288White non-Hispanic householders
- $98,845Some other race householders
- $147,011Two or more races householders
- $89,609Hispanic or Latino race householders
- Median 2022 house value
- $238,096White Non-Hispanic householders
- $252,697Some other race householders
- $190,926Two or more races householders
- $252,697Hispanic or Latino householders
Household income for White non-Hispanic householders

Household income for Two or more races householders

Household income for Hispanic or Latino race householders

Foreign-born residents in Greater Galesburg
8 residents are foreign born
| This city: | 0.5% |
| Michigan: | 5.3% |
Ancestries in Greater Galesburg

- 39622.5%German
- 26615.1%Irish
- 18710.6%Dutch
- 17610.0%English
- 1448.2%Other
- 1327.5%United States
- 985.6%French
- 804.5%Polish
- 794.5%Italian
- 523.0%Scottish
- 251.4%French Canadian
- 241.4%Norwegian
- 241.4%Scotch-Irish
- 201.1%Swedish
- 160.9%Welsh
- 100.6%Hungarian
- 100.6%Ukrainian
- 80.5%Slovak
- 30.2%Swiss
- 20.1%Czech
- 20.1%Danish
- 20.1%Lithuanian
- 20.1%Russian
- 10.06%Subsaharan African

Zip codes: 49053.