Races in Granbury, Texas (TX) Detailed Stats
Ancestries, Foreign-born residents, place of birth
Settings
X


Recent posts about races in Granbury, Texas on our local forum with over 2,400,000 registered users:
 | Moving- Looking to live amongst others in my community (8 replies) |
| Granbury tx crime rate (3 replies) |
| Advice About Moving to Granbury (5 replies) |
| Serious question (16 replies) |
| Granbury TX (4 replies) |
| why are texans moving to colorado? (233 replies) |
Latest news about races in Granbury, TX collected exclusively by city-data.com from local newspapers, TV, and radio stations
According to 2022 data, the most numerous races in Granbury, TX are Hispanic (1,222 residents), White alone (10,007 residents), and Black alone (139 residents). 93.0% of Granbury residents speak English at home. 2.0% of Granbury, TX residents are foreign-born , which is 762.4% less than the foreign-born rate of 17.0% across the entire state of Texas.
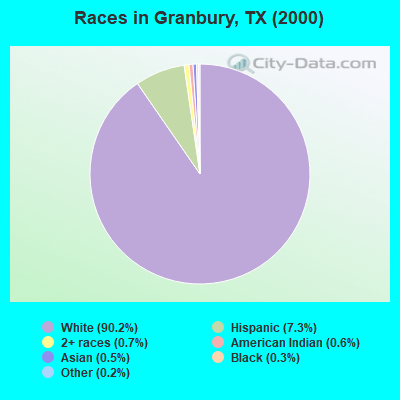
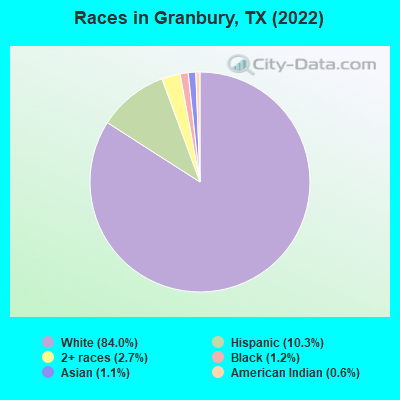
Race distribution in Granbury
2000
2022

- 5,15990.2%White alone
- 4187.3%Hispanic
- 420.7%Two or more races
- 360.6%American Indian alone
- 300.5%Asian alone
- 190.3%Black alone
- 120.2%Other race alone
- 20.03%Native Hawaiian and Other
Pacific Islander alone
-
- 10,00784.0%White alone
- 1,22210.3%Hispanic
- 3232.7%Two or more races
- 1391.2%Black alone
- 1321.1%Asian alone
- 710.6%American Indian alone
2000
2022
-
- 10,933,31352.4%White alone
- 6,669,66632.0%Hispanic
- 2,364,25511.3%Black alone
- 554,4452.7%Asian alone
- 230,5671.1%Two or more races
- 68,8590.3%American Indian alone
- 19,9580.10%Other race alone
- 10,7570.05%Native Hawaiian and Other
Pacific Islander alone

-
- 12,070,64240.2%Hispanic
- 11,683,43038.9%White alone
- 3,508,70611.7%Black alone
- 1,608,1735.4%Asian alone
- 956,5603.2%Two or more races
- 125,7630.4%Other race alone
- 47,0230.2%American Indian alone
- 29,2750.10%Native Hawaiian and Other
Pacific Islander alone

Income and house value in Granbury
- Median household income in 2022
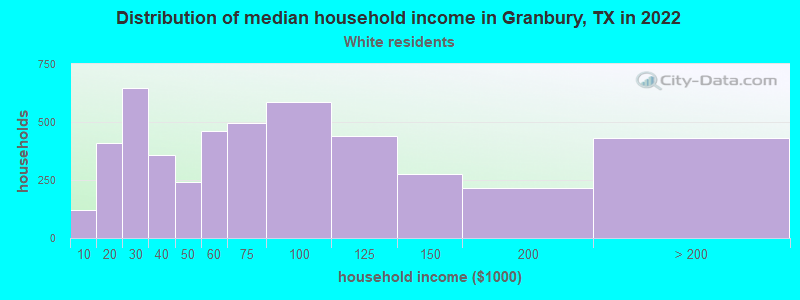
- $59,424White non-Hispanic householders
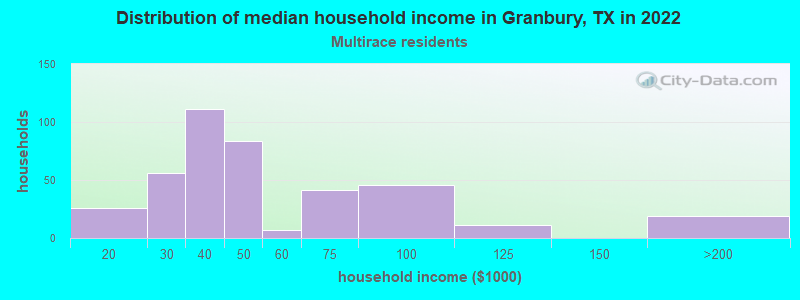
- $39,279Two or more races householders
- $53,376Hispanic or Latino race householders
- Median 2022 house value
- $291,569White Non-Hispanic householders
- $475,009American Indian or Alaska Native householders
- $129,548Asian householders
- $155,457Some other race householders
- $167,894Two or more races householders
- $198,640Hispanic or Latino householders
Household income for White non-Hispanic householders
Household income for Asian householders

Household income for Two or more races householders
Household income for Hispanic or Latino race householders

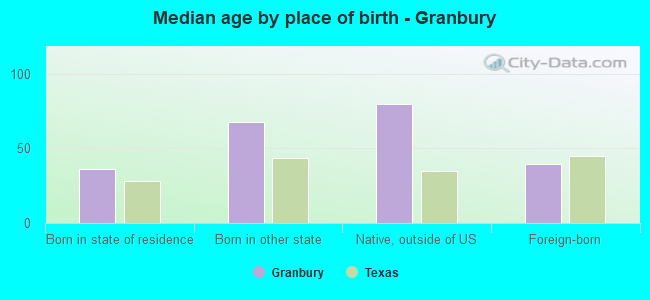
Median age by race in Granbury
- 55.1Median age for White residents
- 52.4Males
- 57.3Females
- 48.5Median age for Black or African American residents
- 33.8Males
- 102.7Females
- 92.5Median age for American Indian / Alaska Native residents
- -1,050,071,529.7Males
- -938,381,587.8Females
- 71.7Median age for Asian residents
- -667,735,042.1Males
- 92.0Females
- -666,666,666.0Median age for Native Hawaiian / Pacific Islander residents
- -666,666,666.0Males
- -666,666,666.0Females
- 61.3Median age for Other race residents
- 43.9Males
- -605,080,830.8Females
- 25.3Median age for Two or more races residents
- 24.9Males
- 16.6Females
- 56.8Median age for White alone residents
- 54.6Males
- 58.3Females
- 31.2Median age for Hispanic or Latino residents
- 30.1Males
- 29.4Females
Owner/renter occupied households by race in Granbury
- House owners and renters - White residents
- 2,87959.5%Owner occupied
- 1,96240.5%Renter occupied
- House owners and renters - Black or African American residents
- 17100.0%Renter occupied
- House owners and renters - American Indian / Alaska Native residents
- 8100.0%Renter occupied
- House owners and renters - Asian residents
- 933.2%Owner occupied
- 1966.8%Renter occupied
- House owners and renters - Two or more races residents
- 11847.4%Owner occupied
- 13152.6%Renter occupied
- House owners and renters - White alone residents
- 2,93561.7%Owner occupied
- 1,82338.3%Renter occupied
- House owners and renters - Hispanic or Latino residents
- 9139.8%Owner occupied
- 13760.2%Renter occupied
Language usage in Granbury
- English speakers - Total
- 93.0% of residents of Granbury speak English at home.
- 5.1% of residents speak Spanish at home
- 37766.1%Speak English very well
- 19333.9%Speak English less than very well
- 1.5% of residents speak other language at home
- 6638.4%Speak English very well
- 10661.6%Speak English less than very well
- English speakers - Born in the United States
- 94.6% of residents of Granbury speak English at home.
- 1.9% of residents speak Spanish at home
- 80100.0%Speak English very well
- 1.8% of residents speak other language at home
- 77100.0%Speak English very well
All residents speak only English at home
- English speakers - Foreign-born
- 12.1% of residents of Granbury speak English at home.
- 58.7% of residents speak Spanish at home
- 5326.6%Speak English very well
- 14673.4%Speak English less than very well
- 32.7% of residents speak other language at home
- 1614.4%Speak English very well
- 9585.6%Speak English less than very well
White (Caucasian) - Speak only English
| Native: | 98.3% (9,490) |
| Foreign-born: | 26.3% (16) |
White (Caucasian) - Speak another language
| Native: | 1.7% (169) |
| Foreign-born: | 31.2% (19) |
Black or African American - Speak only English
| Native: | 100.0% (139) |
| Foreign-born: | 90.7% (5) |
Asian - Speak another language
| Native: | 23.3% (9) |
| Foreign-born: | 99.6% (64) |
Two or more races - Speak only English
| Native: | 93.7% (599) |
| Foreign-born: | 9.0% (13) |
Two or more races - Speak another language
| Native: | 11.3% (72) |
| Foreign-born: | 89.6% (125) |
White alone - Speak only English
| Native: | 98.8% (9,328) |
| Foreign-born: | 100.0% (14) |
Hispanic or Latino - Speak only English
| Native: | 65.5% (580) |
| Foreign-born: | 5.0% (11) |
Hispanic or Latino - Speak another language
| Native: | 35.6% (315) |
| Foreign-born: | 93.4% (205) |
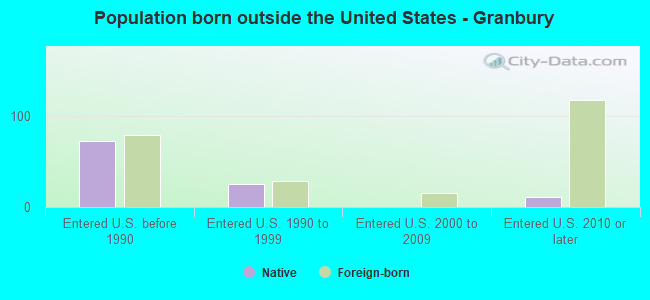
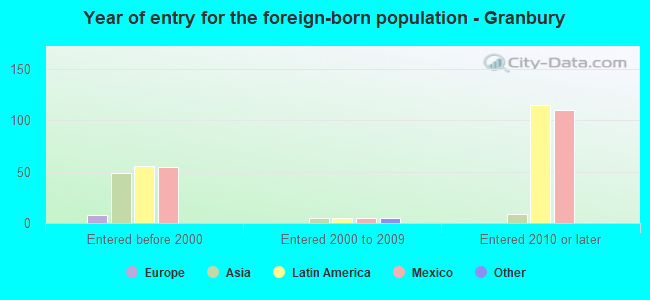
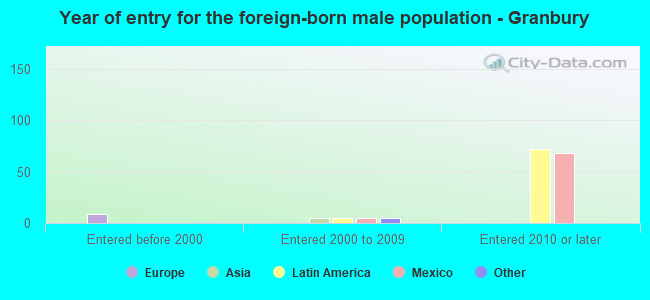
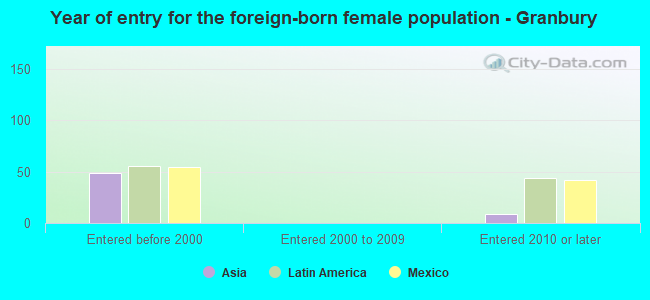
Foreign-born residents in Granbury
235 residents are foreign born
| This city: | 2.0% |
| Texas: | 17.1% |

Marital status for residents in Granbury
Marital status - White (Caucasian) population 15 years and over
- Males
- 19.1%Never married
- 65.0%Now married
- 0.3%Separated
- 4.7%Widowed
- 10.9%Divorced
- Females
- 15.7%Never married
- 52.3%Now married
- 2.1%Separated
- 15.1%Widowed
- 15.0%Divorced
Women who gave birth in the past 12 months
| Now married: | 51.7% (89) |
| Unmarried: | 48.3% (83) |
Women who did not give birth in the past 12 months
| Now married: | 55.5% (924) |
| Unmarried: | 44.5% (742) |
Marital status - Black or African American population 15 years and over
- Males
- 53.8%Never married
- 32.1%Now married
- 0.0%Separated
- 7.7%Widowed
- 6.4%Divorced
- Females
- 80.8%Never married
- 19.2%Now married
- 0.0%Separated
- 0.0%Widowed
- 0.0%Divorced
Women who did not give birth in the past 12 months
| Now married: | 0.0% (0) |
| Unmarried: | 100.0% (6) |
Marital status - American Indian / Alaska Native population 15 years and over
- Males
- 100.0%Never married
- 0.0%Now married
- 0.0%Separated
- 0.0%Widowed
- 0.0%Divorced
- Females
- 24.0%Never married
- 76.0%Now married
- 0.0%Separated
- 0.0%Widowed
- 0.0%Divorced
Women who did not give birth in the past 12 months
| Now married: | 0.0% (0) |
| Unmarried: | 100.0% (9) |
Marital status - Asian population 15 years and over
- Males
- 0.0%Never married
- 100.0%Now married
- 0.0%Separated
- 0.0%Widowed
- 0.0%Divorced
- Females
- 29.2%Never married
- 14.6%Now married
- 0.0%Separated
- 24.7%Widowed
- 31.5%Divorced
Women who did not give birth in the past 12 months
| Now married: | 0.0% (0) |
| Unmarried: | 100.0% (28) |
Marital status - Other race population 15 years and over
- Males
- 65.5%Never married
- 34.5%Now married
- 0.0%Separated
- 0.0%Widowed
- 0.0%Divorced
- Females
- 0.0%Never married
- 100.0%Now married
- 0.0%Separated
- 0.0%Widowed
- 0.0%Divorced
Marital status - Two or more races population 15 years and over
- Males
- 76.6%Never married
- 19.2%Now married
- 0.0%Separated
- 0.0%Widowed
- 4.2%Divorced
- Females
- 75.1%Never married
- 8.5%Now married
- 2.3%Separated
- 5.6%Widowed
- 8.5%Divorced
Women who gave birth in the past 12 months
| Now married: | 0.0% (0) |
| Unmarried: | 100.0% (54) |
Women who did not give birth in the past 12 months
| Now married: | 17.4% (31) |
| Unmarried: | 82.6% (147) |
Marital status - White alone, not Hispanic / Latino population 15 years and over
- Males
- 19.0%Never married
- 64.1%Now married
- 0.2%Separated
- 4.9%Widowed
- 11.9%Divorced
- Females
- 14.6%Never married
- 53.0%Now married
- 2.2%Separated
- 15.0%Widowed
- 15.3%Divorced
Women who gave birth in the past 12 months
| Now married: | 51.7% (95) |
| Unmarried: | 48.3% (88) |
Women who did not give birth in the past 12 months
| Now married: | 58.2% (927) |
| Unmarried: | 41.8% (666) |
Marital status - Hispanic or Latino population 15 years and over
- Males
- 40.3%Never married
- 55.4%Now married
- 1.2%Separated
- 2.1%Widowed
- 1.0%Divorced
- Females
- 50.4%Never married
- 33.8%Now married
- 0.0%Separated
- 10.1%Widowed
- 5.8%Divorced
Women who gave birth in the past 12 months
| Now married: | 0.0% (0) |
| Unmarried: | 100.0% (42) |
Women who did not give birth in the past 12 months
| Now married: | 25.5% (83) |
| Unmarried: | 74.5% (241) |
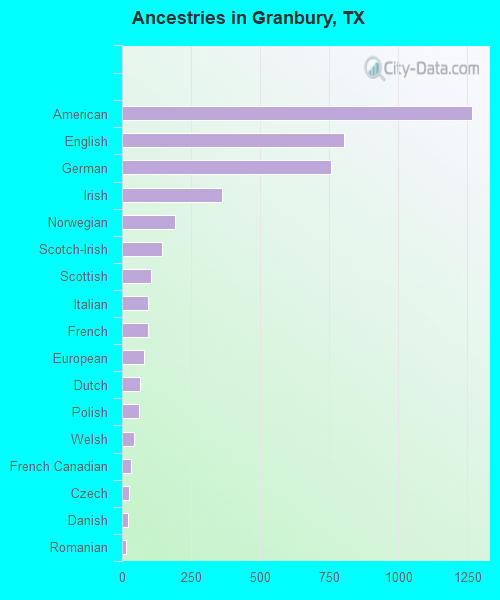
Ancestries in Granbury

- 1,26521.5%American
- 80313.7%English
- 75712.9%German
- 3626.2%Irish
- 1913.3%Norwegian
- 1452.5%Scotch-Irish
- 1041.8%Scottish
- 951.6%Italian
- 931.6%French
- 811.4%European
- 641.1%Dutch
- 601.0%Polish
- 440.7%Welsh
- 340.6%French Canadian
- 240.4%Czech
- 200.3%Danish
- 130.2%Romanian
- 90.2%Swedish
- 60.1%Greek
- 50.09%Eastern European
- 40.07%African
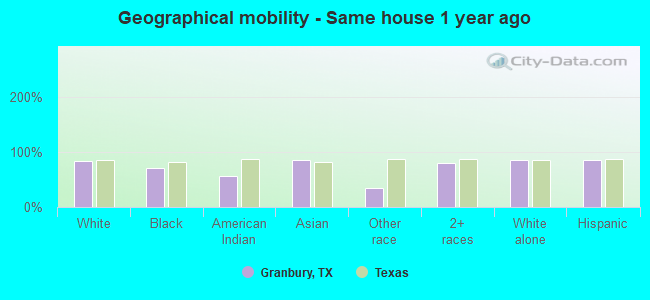
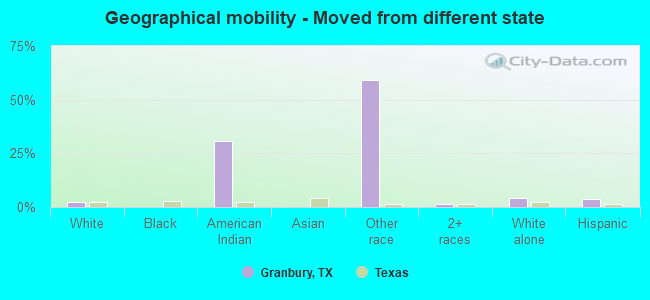
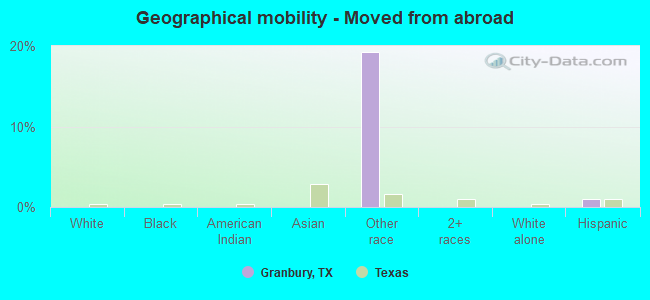
Geographical mobility in Granbury

- Same house 1 year ago
- 8,54784.6%White (Caucasian)
- 10471.8%Black or African American
- 2955.7%American Indian / Alaska Native
- 8785.5%Asian
- 2734.0%Other race
- 83681.1%Two or more races
- 8,38484.8%White alone, not Hispanic / Latino
- 91785.0%Hispanic or Latino
-
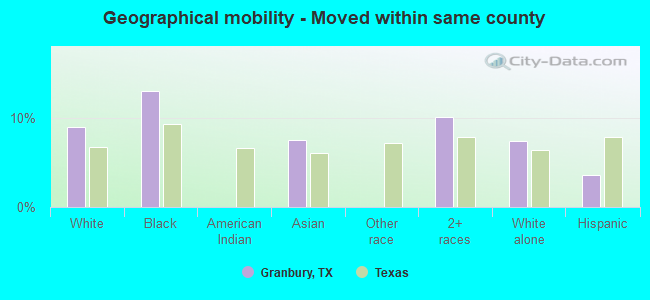
- Moved within same county
- 9069.0%White / Caucasian
- 1912.9%Black or African American
- 87.5%Asian
- 10410.1%Two or more races
- 7297.4%White alone, not Hispanic / Latino
- 393.6%Hispanic or Latino
-
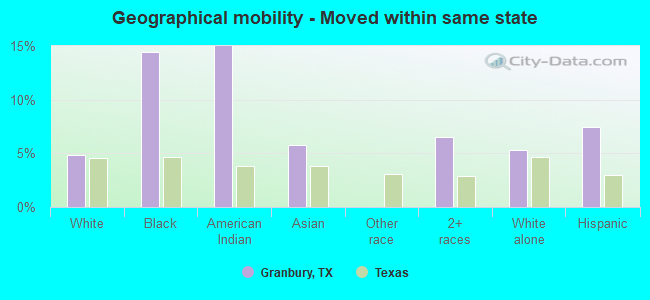
- Moved within same state
- 4914.9%White / Caucasian
- 2114.4%Black or African American
- 815.0%American Indian / Alaska Native
- 65.8%Asian
- 686.6%Two or more races
- 5215.3%White alone, not Hispanic / Latino
- 817.5%Hispanic or Latino
-
- Moved from different state
- 2132.1%White / Caucasian
- 1630.9%American Indian / Alaska Native
- 4659.2%Other race
- 161.6%Two or more races
- 4174.2%White alone, not Hispanic / Latino
- 393.6%Hispanic or Latino
-
- Moved from abroad
- 1519.3%Other race
- 111.0%Hispanic or Latino
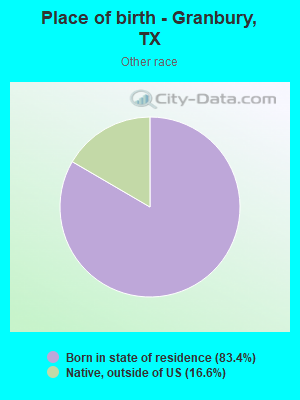
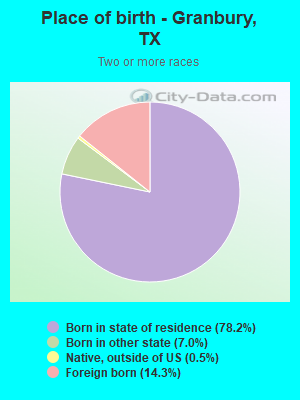
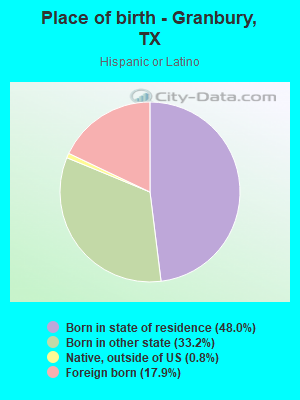
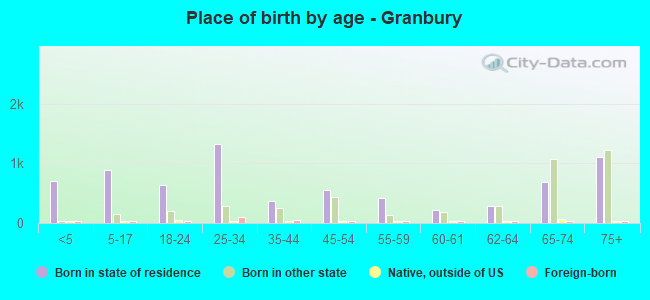
Children Nativity (place of birth) in Granbury
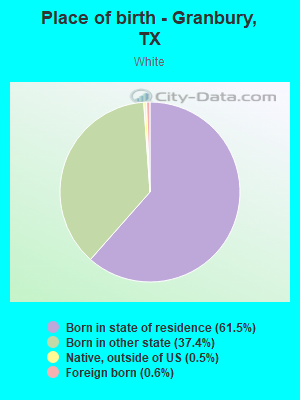
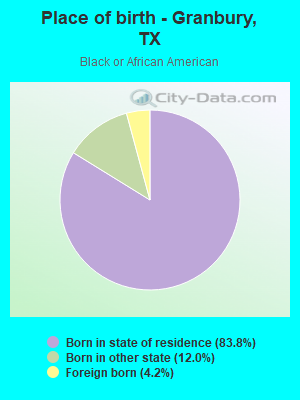
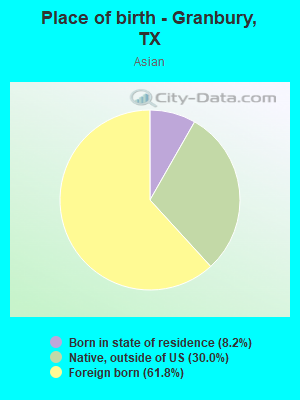
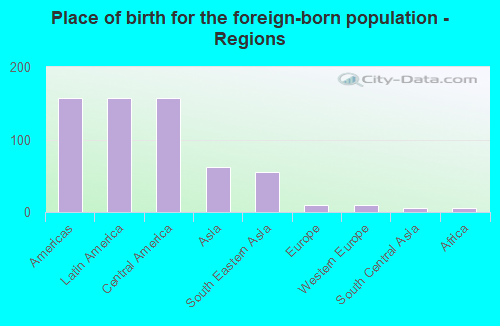
Place of birth for residents in Granbury
![Place of birth for the foreign-born population - Regions]()
- 157Americas
- 157Latin America
- 157Central America
- 62Asia
- 55South Eastern Asia
- 9Europe
- 9Western Europe
- 6South Central Asia
- 6Africa
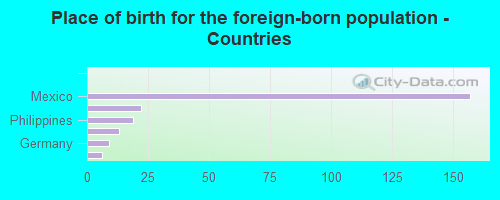
![Place of birth for the foreign-born population - Countries]()
- 157Mexico
- 22Vietnam
- 19Philippines
- 13Thailand
- 9Germany
- 6Pakistan
Zip codes: 76048.