Races in Goshen, Indiana (IN) Detailed Stats
Data:
Races - White alone (%)
Races - White alone (% change since 2000)
Races - Black alone (%)
Races - Black alone (% change since 2000)
Races - American Indian alone (%)
Races - American Indian alone (% change since 2000)
Races - Asian alone (%)
Races - Asian alone (% change since 2000)
Races - Hispanic (%)
Races - Hispanic (% change since 2000)
Races - Native Hawaiian and Other Pacific Islander alone (%)
Races - Native Hawaiian and Other Pacific Islander alone (% change since 2000)
Races - Two or more races(%)
Races - Two or more races(% change since 2000)
Races - Other race alone (%)
Races - Other race alone (% change since 2000)
Racial diversity
Place of birth - Born in state of residence (%)
Place of birth - Born in state of residence (%) - White
Place of birth - Born in state of residence (%) - Black or African American
Place of birth - Born in state of residence (%) - Asian
Place of birth - Born in state of residence (%) - Hispanic or Latino
Place of birth - Born in state of residence (%) - American Indian and Alaska Native
Place of birth - Born in state of residence (%) - Multirace
Place of birth - Born in state of residence (%) - Other Race
Place of birth - Born in other state (%)
Place of birth - Born in other state (%) - White
Place of birth - Born in other state (%) - Black or African American
Place of birth - Born in other state (%) - Asian
Place of birth - Born in other state (%) - Hispanic or Latino
Place of birth - Born in other state (%) - American Indian and Alaska Native
Place of birth - Born in other state (%) - Multirace
Place of birth - Born in other state (%) - Other Race
Place of birth - Native, outside of US (%)
Place of birth - Native, outside of US (%) - White
Place of birth - Native, outside of US (%) - Black or African American
Place of birth - Native, outside of US (%) - Asian
Place of birth - Native, outside of US (%) - Hispanic or Latino
Place of birth - Native, outside of US (%) - American Indian and Alaska Native
Place of birth - Native, outside of US (%) - Multirace
Place of birth - Native, outside of US (%) - Other Race
Place of birth - Foreign born (%)
Place of birth - Foreign born (%) - White
Place of birth - Foreign born (%) - Black or African American
Place of birth - Foreign born (%) - Asian
Place of birth - Foreign born (%) - Hispanic or Latino
Place of birth - Foreign born (%) - American Indian and Alaska Native
Place of birth - Foreign born (%) - Multirace
Place of birth - Foreign born (%) - Other Race
Residents speaking English at home (%)
Residents speaking English at home - Born in the United States (%)
Residents speaking English at home - Native, born elsewhere (%)
Residents speaking English at home - Foreign born (%)
Residents speaking Spanish at home (%)
Residents speaking Spanish at home - Born in the United States (%)
Residents speaking Spanish at home - Native, born elsewhere (%)
Residents speaking Spanish at home - Foreign born (%)
Residents speaking other language at home (%)
Residents speaking other language at home - Born in the United States (%)
Residents speaking other language at home - Native, born elsewhere (%)
Residents speaking other language at home - Foreign born (%)
Marital status - Never married (%)
Marital status - Now married (%)
Marital status - Separated (%)
Marital status - Widowed (%)
Marital status - Divorced (%)
Ancestries Reported - Arab (%)
Ancestries Reported - Czech (%)
Ancestries Reported - Danish (%)
Ancestries Reported - Dutch (%)
Ancestries Reported - English (%)
Ancestries Reported - French (%)
Ancestries Reported - French Canadian (%)
Ancestries Reported - German (%)
Ancestries Reported - Greek (%)
Ancestries Reported - Hungarian (%)
Ancestries Reported - Irish (%)
Ancestries Reported - Italian (%)
Ancestries Reported - Lithuanian (%)
Ancestries Reported - Norwegian (%)
Ancestries Reported - Polish (%)
Ancestries Reported - Portuguese (%)
Ancestries Reported - Russian (%)
Ancestries Reported - Scotch-Irish (%)
Ancestries Reported - Scottish (%)
Ancestries Reported - Slovak (%)
Ancestries Reported - Subsaharan African (%)
Ancestries Reported - Swedish (%)
Ancestries Reported - Swiss (%)
Ancestries Reported - Ukrainian (%)
Ancestries Reported - United States (%)
Ancestries Reported - Welsh (%)
Ancestries Reported - West Indian (%)
Ancestries Reported - Other (%)
Geographical mobility - Same house 1 year ago (%)
Geographical mobility - Same house 1 year ago (%) - White
Geographical mobility - Same house 1 year ago (%) - Black or African American
Geographical mobility - Same house 1 year ago (%) - Asian
Geographical mobility - Same house 1 year ago (%) - Hispanic or Latino
Geographical mobility - Same house 1 year ago (%) - American Indian and Alaska Native
Geographical mobility - Same house 1 year ago (%) - Multirace
Geographical mobility - Same house 1 year ago (%) - Other Race
Geographical mobility - Moved within same county (%)
Geographical mobility - Moved within same county (%) - White
Geographical mobility - Moved within same county (%) - Black or African American
Geographical mobility - Moved within same county (%) - Asian
Geographical mobility - Moved within same county (%) - Hispanic or Latino
Geographical mobility - Moved within same county (%) - American Indian and Alaska Native
Geographical mobility - Moved within same county (%) - Multirace
Geographical mobility - Moved within same county (%) - Other Race
Geographical mobility - Moved from different county within same state (%)
Geographical mobility - Moved from different county within same state (%) - White
Geographical mobility - Moved from different county within same state (%) - Black or African American
Geographical mobility - Moved from different county within same state (%) - Asian
Geographical mobility - Moved from different county within same state (%) - Hispanic or Latino
Geographical mobility - Moved from different county within same state (%) - American Indian and Alaska Native
Geographical mobility - Moved from different county within same state (%) - Multirace
Geographical mobility - Moved from different county within same state (%) - Other Race
Geographical mobility - Moved from different state (%)
Geographical mobility - Moved from different state (%) - White
Geographical mobility - Moved from different state (%) - Black or African American
Geographical mobility - Moved from different state (%) - Asian
Geographical mobility - Moved from different state (%) - Hispanic or Latino
Geographical mobility - Moved from different state (%) - American Indian and Alaska Native
Geographical mobility - Moved from different state (%) - Multirace
Geographical mobility - Moved from different state (%) - Other Race
Geographical mobility - Moved from abroad (%)
Geographical mobility - Moved from abroad (%) - White
Geographical mobility - Moved from abroad (%) - Black or African American
Geographical mobility - Moved from abroad (%) - Asian
Geographical mobility - Moved from abroad (%) - Hispanic or Latino
Geographical mobility - Moved from abroad (%) - American Indian and Alaska Native
Geographical mobility - Moved from abroad (%) - Multirace
Geographical mobility - Moved from abroad (%) - Other Race
Place of birth for the foreign-born population - Ireland (%)
Place of birth for the foreign-born population - Denmark (%)
Place of birth for the foreign-born population - Norway (%)
Place of birth for the foreign-born population - Sweden (%)
Place of birth for the foreign-born population - United Kingdom (%)
Place of birth for the foreign-born population - England (%)
Place of birth for the foreign-born population - Scotland (%)
Place of birth for the foreign-born population - Other Northern Europe (%)
Place of birth for the foreign-born population - Austria (%)
Place of birth for the foreign-born population - Belgium (%)
Place of birth for the foreign-born population - France (%)
Place of birth for the foreign-born population - Germany (%)
Place of birth for the foreign-born population - Netherlands (%)
Place of birth for the foreign-born population - Switzerland (%)
Place of birth for the foreign-born population - Other Western Europe (%)
Place of birth for the foreign-born population - Greece (%)
Place of birth for the foreign-born population - Italy (%)
Place of birth for the foreign-born population - Portugal (%)
Place of birth for the foreign-born population - Spain (%)
Place of birth for the foreign-born population - Other Southern Europe (%)
Place of birth for the foreign-born population - Albania (%)
Place of birth for the foreign-born population - Belarus (%)
Place of birth for the foreign-born population - Bosnia and Herzegovina (%)
Place of birth for the foreign-born population - Bulgaria (%)
Place of birth for the foreign-born population - Croatia (%)
Place of birth for the foreign-born population - Czechoslovakia (%)
Place of birth for the foreign-born population - Hungary (%)
Place of birth for the foreign-born population - Latvia (%)
Place of birth for the foreign-born population - Lithuania (%)
Place of birth for the foreign-born population - North Macedonia (Macedonia) (%)
Place of birth for the foreign-born population - Moldova (%)
Place of birth for the foreign-born population - Poland (%)
Place of birth for the foreign-born population - Romania (%)
Place of birth for the foreign-born population - Russia (%)
Place of birth for the foreign-born population - Serbia (%)
Place of birth for the foreign-born population - Ukraine (%)
Place of birth for the foreign-born population - Other Eastern Europe (%)
Place of birth for the foreign-born population - China (%)
Place of birth for the foreign-born population - Hong Kong (%)
Place of birth for the foreign-born population - Taiwan (%)
Place of birth for the foreign-born population - Japan (%)
Place of birth for the foreign-born population - Korea (%)
Place of birth for the foreign-born population - Other Eastern Asia (%)
Place of birth for the foreign-born population - Afghanistan (%)
Place of birth for the foreign-born population - Bangladesh (%)
Place of birth for the foreign-born population - India (%)
Place of birth for the foreign-born population - Iran (%)
Place of birth for the foreign-born population - Kazakhstan (%)
Place of birth for the foreign-born population - Nepal (%)
Place of birth for the foreign-born population - Pakistan (%)
Place of birth for the foreign-born population - Sri Lanka (%)
Place of birth for the foreign-born population - Uzbekistan (%)
Place of birth for the foreign-born population - Other South Central Asia (%)
Place of birth for the foreign-born population - Burma (%)
Place of birth for the foreign-born population - Cambodia (%)
Place of birth for the foreign-born population - Indonesia (%)
Place of birth for the foreign-born population - Laos (%)
Place of birth for the foreign-born population - Malaysia (%)
Place of birth for the foreign-born population - Philippines (%)
Place of birth for the foreign-born population - Singapore (%)
Place of birth for the foreign-born population - Thailand (%)
Place of birth for the foreign-born population - Vietnam (%)
Place of birth for the foreign-born population - Other South Eastern Asia (%)
Place of birth for the foreign-born population - Armenia (%)
Place of birth for the foreign-born population - Iraq (%)
Place of birth for the foreign-born population - Israel (%)
Place of birth for the foreign-born population - Jordan (%)
Place of birth for the foreign-born population - Kuwait (%)
Place of birth for the foreign-born population - Lebanon (%)
Place of birth for the foreign-born population - Saudi Arabia (%)
Place of birth for the foreign-born population - Syria (%)
Place of birth for the foreign-born population - Turkey (%)
Place of birth for the foreign-born population - Yemen (%)
Place of birth for the foreign-born population - Other Western Asia (%)
Place of birth for the foreign-born population - Eritrea (%)
Place of birth for the foreign-born population - Ethiopia (%)
Place of birth for the foreign-born population - Kenya (%)
Place of birth for the foreign-born population - Somalia (%)
Place of birth for the foreign-born population - Uganda (%)
Place of birth for the foreign-born population - Zimbabwe (%)
Place of birth for the foreign-born population - Other Eastern Africa (%)
Place of birth for the foreign-born population - Cameroon (%)
Place of birth for the foreign-born population - Congo (%)
Place of birth for the foreign-born population - Democratic Republic of Congo (Zaire) (%)
Place of birth for the foreign-born population - Other Middle Africa (%)
Place of birth for the foreign-born population - Egypt (%)
Place of birth for the foreign-born population - Morocco (%)
Place of birth for the foreign-born population - Sudan (%)
Place of birth for the foreign-born population - Other Northern Africa (%)
Place of birth for the foreign-born population - South Africa (%)
Place of birth for the foreign-born population - Other Southern Africa (%)
Place of birth for the foreign-born population - Cabo Verde (%)
Place of birth for the foreign-born population - Ghana (%)
Place of birth for the foreign-born population - Liberia (%)
Place of birth for the foreign-born population - Nigeria (%)
Place of birth for the foreign-born population - Senegal (%)
Place of birth for the foreign-born population - Sierra Leone (%)
Place of birth for the foreign-born population - Other Western Africa (%)
Place of birth for the foreign-born population - Australia (%)
Place of birth for the foreign-born population - New Zealand (%)
Place of birth for the foreign-born population - Fiji (%)
Place of birth for the foreign-born population - Micronesia (%)
Place of birth for the foreign-born population - Bahamas (%)
Place of birth for the foreign-born population - Barbados (%)
Place of birth for the foreign-born population - Cuba (%)
Place of birth for the foreign-born population - Dominica (%)
Place of birth for the foreign-born population - Dominican Republic (%)
Place of birth for the foreign-born population - Grenada (%)
Place of birth for the foreign-born population - Haiti (%)
Place of birth for the foreign-born population - Jamaica (%)
Place of birth for the foreign-born population - St. Vincent and the Grenadines (%)
Place of birth for the foreign-born population - Trinidad and Tobago (%)
Place of birth for the foreign-born population - West Indies (%)
Place of birth for the foreign-born population - Other Caribbean (%)
Place of birth for the foreign-born population - Belize (%)
Place of birth for the foreign-born population - Costa Rica (%)
Place of birth for the foreign-born population - El Salvador (%)
Place of birth for the foreign-born population - Guatemala (%)
Place of birth for the foreign-born population - Honduras (%)
Place of birth for the foreign-born population - Mexico (%)
Place of birth for the foreign-born population - Nicaragua (%)
Place of birth for the foreign-born population - Panama (%)
Place of birth for the foreign-born population - Other Central America (%)
Place of birth for the foreign-born population - Argentina (%)
Place of birth for the foreign-born population - Bolivia (%)
Place of birth for the foreign-born population - Brazil (%)
Place of birth for the foreign-born population - Chile (%)
Place of birth for the foreign-born population - Colombia (%)
Place of birth for the foreign-born population - Ecuador (%)
Place of birth for the foreign-born population - Guyana (%)
Place of birth for the foreign-born population - Peru (%)
Place of birth for the foreign-born population - Uruguay (%)
Place of birth for the foreign-born population - Venezuela (%)
Place of birth for the foreign-born population - Other South America (%)
Place of birth for the foreign-born population - Canada (%)
Place of birth for the foreign-born population - Other Northern America (%)
Place of birth for the foreign-born population - Other (%)
Latest news about races in Goshen, IN collected exclusively by city-data.com from local newspapers, TV, and radio stations
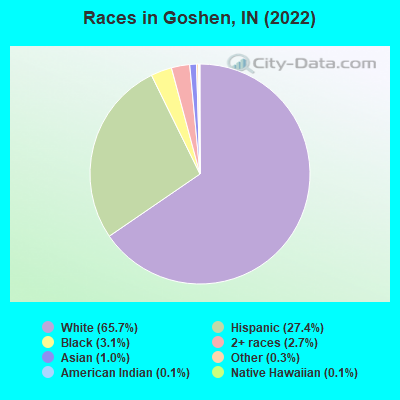
According to 2022 data, the most numerous races in Goshen, IN are White alone (22,802 residents), Black alone (1,071 residents), and Hispanic (9,498 residents). 75.1% of Goshen residents speak English at home. 15.4% of Goshen, IN residents are foreign-born (10.4% born in Latin America, 1.7% born in Africa), which is 61.1% greater than the foreign-born rate of 6.0% across the entire state of Indiana.
Race distribution in Goshen
2000 2022
5,219,373 85.8% White alone 505,462 8.3% Black alone 214,536 3.5% Hispanic 61,115 1.0% Two or more races 58,424 1.0% Asian alone 13,654 0.2% American Indian alone 6,348 0.1% Other race alone 1,573 0.03% Native Hawaiian and Other
5,192,455 76.0% White alone 628,054 9.2% Black alone 534,528 7.8% Hispanic 263,242 3.9% Two or more races 172,880 2.5% Asian alone 33,467 0.5% Other race alone 5,866 0.09% American Indian alone 2,545 0.04% Native Hawaiian and Other
Income and house value in Goshen Median household income in 2022 $53,726 White non-Hispanic householders$20,532 Black householders$49,499 Asian householders$47,243 Some other race householders$47,458 Two or more races householders$57,310 Hispanic or Latino race householdersMedian 2022 house value $195,694 White Non-Hispanic householders$128,026 Black or African American householders$469,917 American Indian or Alaska Native householders $303,462 Asian householders$203,004 Some other race householders$154,968 Two or more races householders$193,397 Hispanic or Latino householders
Median age by race in Goshen
43.2 Median age for White residents42.2 44.2 34.2 Median age for Black or African American residents36.3 31.0 23.6 Median age for American Indian / Alaska Native residents-546,271,338.2 13.8 24.0 Median age for Asian residents14.5 40.0 -664,335,663.7 Median age for Native Hawaiian / Pacific Islander residents-644,025,156.6 -664,437,011.6 21.8 Median age for Other race residents18.6 28.8 22.1 Median age for Two or more races residents24.7 16.8 46.3 Median age for White alone residents45.8 46.8 23.9 Median age for Hispanic or Latino residents22.8 25.9
Owner/renter occupied households by race in Goshen
House owners and renters - White residents 6,748 65.9% Owner occupied3,486 34.1% Renter occupiedHouse owners and renters - Black or African American residents 108 20.5% Owner occupied417 79.5% Renter occupiedHouse owners and renters - American Indian / Alaska Native residents 83 100.0% Owner occupiedHouse owners and renters - Asian residents 24 17.7% Owner occupied110 82.3% Renter occupiedHouse owners and renters - Native Hawaiian / Pacific Islander residents 46 100.0% Renter occupiedHouse owners and renters - Other race residents 604 43.4% Owner occupied787 56.6% Renter occupiedHouse owners and renters - Two or more races residents 434 47.4% Owner occupied483 52.6% Renter occupiedHouse owners and renters - White alone residents 6,627 66.3% Owner occupied3,371 33.7% Renter occupiedHouse owners and renters - Hispanic or Latino residents 941 42.4% Owner occupied1,281 57.6% Renter occupied
Language usage in Goshen
English speakers - Total 75.1% of residents of Goshen speak English at home.
21.9% of residents speak Spanish at home 4,288 60.0% Speak English very well2,863 40.0% Speak English less than very well3.2% of residents speak other language at home 774 74.8% Speak English very well261 25.2% Speak English less than very well
English speakers - Born in the United States 86.6% of residents of Goshen speak English at home.
9.4% of residents speak Spanish at home 660 88.8% Speak English very well83 11.2% Speak English less than very well2.6% of residents speak other language at home 205 100.0% Speak English very well
English speakers - Native, born elsewhere 47.3% of residents of Goshen speak English at home.
77.2% of residents speak Spanish at home 321 49.6% Speak English very well326 50.4% Speak English less than very well
English speakers - Foreign-born 28.0% of residents of Goshen speak English at home.
68.6% of residents speak Spanish at home 1,345 35.7% Speak English very well2,418 64.3% Speak English less than very well5.1% of residents speak other language at home 115 41.2% Speak English very well164 58.8% Speak English less than very well
White (Caucasian) - Speak only English Native:
93.3% (20,668)Foreign-born:
56.1% (509)
White (Caucasian) - Speak another language Native:
7.2% (1,599)Foreign-born:
54.9% (498)
Black or African American - Speak only English Native:
99.5% (584)Foreign-born:
30.2% (188)
American Indian / Alaska Native - Speak only English Native:
84.9% (138)Foreign-born:
15.2% (12)
Asian - Speak only English Native:
37.8% (34)Foreign-born:
100.0% (243)
Asian - Speak another language Native:
37.9% (34)Foreign-born:
19.9% (48)
Other race - Speak only English Native:
10.5% (280)Foreign-born:
10.2% (219)
Other race - Speak another language Native:
86.6% (2,313)Foreign-born:
83.4% (1,797)
Two or more races - Speak only English Native:
73.5% (1,724)Foreign-born:
2.5% (41)
Two or more races - Speak another language Native:
18.0% (421)Foreign-born:
98.0% (1,576)
White alone - Speak only English Native:
95.9% (20,570)Foreign-born:
80.9% (300)
White alone - Speak another language Native:
4.2% (902)Foreign-born:
25.7% (95)
Hispanic or Latino - Speak only English Native:
26.3% (1,166)Foreign-born:
19.7% (847)
Hispanic or Latino - Speak another language Native:
72.1% (3,190)Foreign-born:
84.5% (3,638)
Foreign-born residents in Goshen 5,356 residents are foreign born (10.4% Latin America , 1.7% Africa ).
This city:
15.4%Indiana:
5.6%
Marital status for residents in Goshen Marital status - White (Caucasian) population 15 years and over
Males 36.3% Never married52.1% Now married1.4% Separated2.5% Widowed7.6% DivorcedFemales 25.1% Never married44.9% Now married2.1% Separated12.1% Widowed15.9% DivorcedWomen who gave birth in the past 12 months Now married:
42.9% (101)Unmarried:
57.1% (135)
Women who did not give birth in the past 12 months Now married:
40.6% (1,998)Unmarried:
59.4% (2,927)
Marital status - Black or African American population 15 years and over
Males 38.9% Never married18.0% Now married0.2% Separated0.0% Widowed42.9% DivorcedFemales 8.6% Never married31.2% Now married0.4% Separated14.5% Widowed45.4% DivorcedWomen who gave birth in the past 12 months Now married:
0.0% (0)Unmarried:
99.6% (1)
Women who did not give birth in the past 12 months Now married:
62.2% (84)Unmarried:
37.8% (51)
Marital status - American Indian / Alaska Native population 15 years and over
Males 100.0% Never married0.0% Now married0.0% Separated0.0% Widowed0.0% DivorcedFemales 100.0% Never married0.0% Now married0.0% Separated0.0% Widowed0.0% DivorcedWomen who did not give birth in the past 12 months Now married:
0.0% (0)Unmarried:
100.0% (113)
Marital status - Asian population 15 years and over
Males 8.2% Never married91.8% Now married0.0% Separated0.0% Widowed0.0% DivorcedFemales 20.5% Never married53.6% Now married8.0% Separated17.9% Widowed0.0% DivorcedWomen who did not give birth in the past 12 months Now married:
56.1% (57)Unmarried:
43.9% (45)
Marital status - Other race population 15 years and over
Males 38.1% Never married54.9% Now married2.8% Separated0.0% Widowed4.3% DivorcedFemales 32.8% Never married56.1% Now married0.0% Separated1.7% Widowed9.3% DivorcedWomen who gave birth in the past 12 months Now married:
19.3% (31)Unmarried:
80.7% (130)
Women who did not give birth in the past 12 months Now married:
55.2% (773)Unmarried:
44.8% (626)
Marital status - Two or more races population 15 years and over
Males 63.4% Never married36.4% Now married0.0% Separated0.2% Widowed0.0% DivorcedFemales 33.6% Never married55.4% Now married3.6% Separated0.1% Widowed7.4% DivorcedWomen who gave birth in the past 12 months Now married:
70.5% (38)Unmarried:
29.5% (16)
Women who did not give birth in the past 12 months Now married:
56.2% (480)Unmarried:
43.8% (374)
Marital status - White alone, not Hispanic / Latino population 15 years and over
Males 31.9% Never married55.7% Now married1.5% Separated2.7% Widowed8.1% DivorcedFemales 23.8% Never married45.2% Now married2.2% Separated12.6% Widowed16.2% DivorcedWomen who gave birth in the past 12 months Now married:
51.2% (105)Unmarried:
48.8% (100)
Women who did not give birth in the past 12 months Now married:
40.9% (1,871)Unmarried:
59.1% (2,706)
Marital status - Hispanic or Latino population 15 years and over
Males 57.2% Never married38.4% Now married1.4% Separated0.3% Widowed2.7% DivorcedFemales 37.0% Never married52.0% Now married1.4% Separated1.9% Widowed7.6% DivorcedWomen who gave birth in the past 12 months Now married:
33.3% (68)Unmarried:
66.7% (135)
Women who did not give birth in the past 12 months Now married:
51.8% (1,322)Unmarried:
48.2% (1,230)
Ancestries in Goshen
3,298 20.6% German1,812 11.3% American972 6.1% English930 5.8% European688 4.3% Irish424 2.6% African149 0.9% Dutch149 0.9% Pennsylvania German131 0.8% Swiss119 0.7% French106 0.7% Polish85 0.5% Italian78 0.5% Scotch-Irish54 0.3% Hungarian48 0.3% Eastern European40 0.2% Kenyan36 0.2% Northern European32 0.2% Norwegian26 0.2% Scottish23 0.1% Scandinavian20 0.1% Basque20 0.1% Belizean15 0.09% Estonian14 0.09% Russian11 0.07% Arab11 0.07% British10 0.06% Austrian10 0.06% Czech9 0.06% Romanian9 0.06% Welsh7 0.04% Ukrainian2 0.01% Finnish
Geographical mobility in Goshen Same house 1 year ago 20,387 84.1% White (Caucasian)1,065 94.6% Black or African American168 61.8% American Indian / Alaska Native359 94.2% Asian44 100.0% Native Hawaiian / Pacific Islander4,129 99.6% Other race2,911 74.3% Two or more races19,449 86.0% White alone, not Hispanic / Latino7,622 82.8% Hispanic or LatinoMoved within same county 2,047 8.4% White / Caucasian45 4.0% Black or African American74 27.3% American Indian / Alaska Native18 4.8% Asian50 1.2% Other race718 18.3% Two or more races1,936 8.6% White alone, not Hispanic / Latino512 5.6% Hispanic or LatinoMoved within same state 1,256 5.2% White / Caucasian4 0.3% Black or African American34 0.8% Other race264 6.7% Two or more races1,174 5.2% White alone, not Hispanic / Latino293 3.2% Hispanic or LatinoMoved from different state 281 1.2% White / Caucasian20 1.7% Black or African American21 0.5% Two or more races161 0.7% White alone, not Hispanic / Latino447 4.9% Hispanic or LatinoMoved from abroad 439 1.8% White39 0.9% Other race38 0.2% White alone, not Hispanic / Latino287 3.1% Hispanic or Latino
Children Nativity (place of birth) in Goshen
Children under 6 years - Living with two parents Both parents native 862 100.0% NativeBoth parents foreign-born 304 76.6% Native93 23.4% Foreign-bornOne native, one foreign-born parent 64 100.0% NativeChildren under 6 years - Living with one parent Native parent 819 100.0% NativeForeign-born parent 169 100.0% NativeChildren 6 to 17 years - Living with two parents Both parents native 2,129 91.2% Native205 8.8% Foreign-bornBoth parents foreign-born 725 98.0% Native14 2.0% Foreign-bornOne native, one foreign-born parent 163 100.0% NativeChildren 6 to 17 years - Living with one parent Native parent 1,750 100.0% NativeForeign-born parent 402 59.1% Native278 40.9% Foreign-born
Grandparents responsible for own grandchildren in Goshen
Grandparents (30 to 59 years) White / Caucasian 75 40.9% Responsible for grandchildren109 59.1% Not responsible for grandchildrenOther race 210 100.0% Not responsible for grandchildrenTwo or more races 312 67.8% Responsible for grandchildren148 32.2% Not responsible for grandchildrenWhite alone, not Hispanic / Latino 75 40.2% Responsible for grandchildren111 59.8% Not responsible for grandchildrenHispanic or Latino 267 50.5% Responsible for grandchildren261 49.5% Not responsible for grandchildrenGrandparents (60 years and over) White / Caucasian 107 38.5% Responsible for grandchildren171 61.5% Not responsible for grandchildrenWhite alone, not Hispanic / Latino 107 42.5% Responsible for grandchildren144 57.5% Not responsible for grandchildrenHispanic or Latino 28 100.0% Not responsible for grandchildren