Races in Goldsboro, North Carolina (NC) Detailed Stats
Data:
Races - White alone (%)
Races - White alone (% change since 2000)
Races - Black alone (%)
Races - Black alone (% change since 2000)
Races - American Indian alone (%)
Races - American Indian alone (% change since 2000)
Races - Asian alone (%)
Races - Asian alone (% change since 2000)
Races - Hispanic (%)
Races - Hispanic (% change since 2000)
Races - Native Hawaiian and Other Pacific Islander alone (%)
Races - Native Hawaiian and Other Pacific Islander alone (% change since 2000)
Races - Two or more races(%)
Races - Two or more races(% change since 2000)
Races - Other race alone (%)
Races - Other race alone (% change since 2000)
Racial diversity
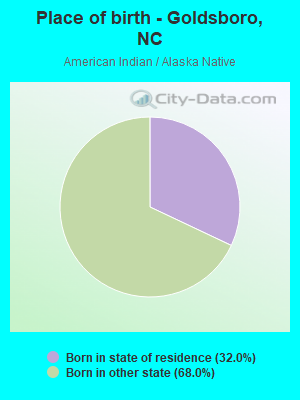
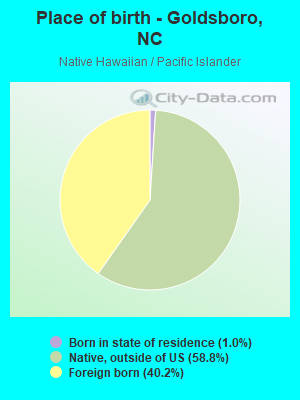
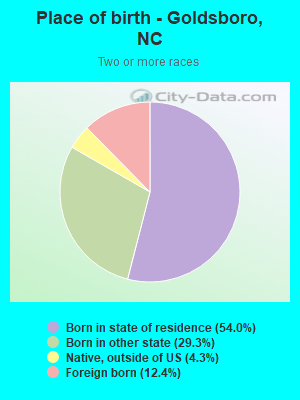
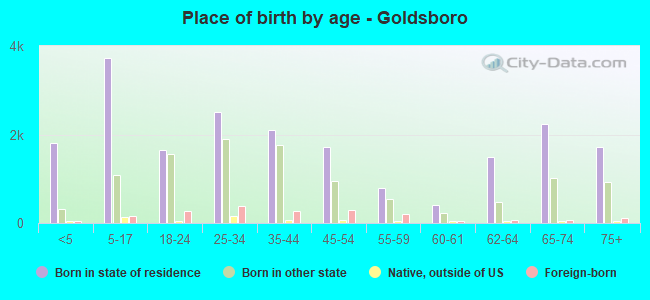
Place of birth - Born in state of residence (%)
Place of birth - Born in state of residence (%) - White
Place of birth - Born in state of residence (%) - Black or African American
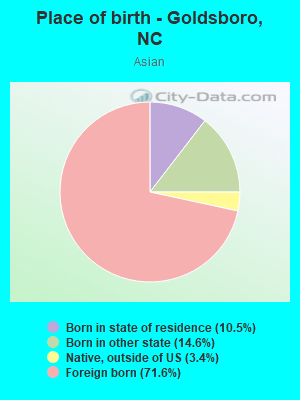
Place of birth - Born in state of residence (%) - Asian
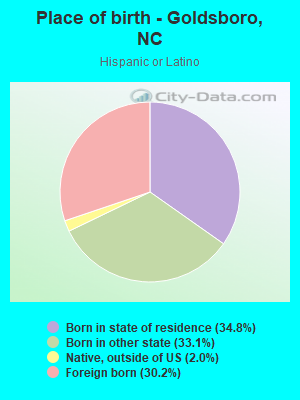
Place of birth - Born in state of residence (%) - Hispanic or Latino
Place of birth - Born in state of residence (%) - American Indian and Alaska Native
Place of birth - Born in state of residence (%) - Multirace
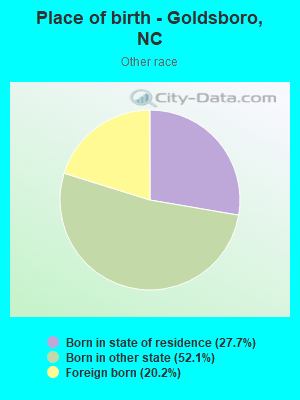
Place of birth - Born in state of residence (%) - Other Race
Place of birth - Born in other state (%)
Place of birth - Born in other state (%) - White
Place of birth - Born in other state (%) - Black or African American
Place of birth - Born in other state (%) - Asian
Place of birth - Born in other state (%) - Hispanic or Latino
Place of birth - Born in other state (%) - American Indian and Alaska Native
Place of birth - Born in other state (%) - Multirace
Place of birth - Born in other state (%) - Other Race
Place of birth - Native, outside of US (%)
Place of birth - Native, outside of US (%) - White
Place of birth - Native, outside of US (%) - Black or African American
Place of birth - Native, outside of US (%) - Asian
Place of birth - Native, outside of US (%) - Hispanic or Latino
Place of birth - Native, outside of US (%) - American Indian and Alaska Native
Place of birth - Native, outside of US (%) - Multirace
Place of birth - Native, outside of US (%) - Other Race
Place of birth - Foreign born (%)
Place of birth - Foreign born (%) - White
Place of birth - Foreign born (%) - Black or African American
Place of birth - Foreign born (%) - Asian
Place of birth - Foreign born (%) - Hispanic or Latino
Place of birth - Foreign born (%) - American Indian and Alaska Native
Place of birth - Foreign born (%) - Multirace
Place of birth - Foreign born (%) - Other Race
Residents speaking English at home (%)
Residents speaking English at home - Born in the United States (%)
Residents speaking English at home - Native, born elsewhere (%)
Residents speaking English at home - Foreign born (%)
Residents speaking Spanish at home (%)
Residents speaking Spanish at home - Born in the United States (%)
Residents speaking Spanish at home - Native, born elsewhere (%)
Residents speaking Spanish at home - Foreign born (%)
Residents speaking other language at home (%)
Residents speaking other language at home - Born in the United States (%)
Residents speaking other language at home - Native, born elsewhere (%)
Residents speaking other language at home - Foreign born (%)
Marital status - Never married (%)
Marital status - Now married (%)
Marital status - Separated (%)
Marital status - Widowed (%)
Marital status - Divorced (%)
Ancestries Reported - Arab (%)
Ancestries Reported - Czech (%)
Ancestries Reported - Danish (%)
Ancestries Reported - Dutch (%)
Ancestries Reported - English (%)
Ancestries Reported - French (%)
Ancestries Reported - French Canadian (%)
Ancestries Reported - German (%)
Ancestries Reported - Greek (%)
Ancestries Reported - Hungarian (%)
Ancestries Reported - Irish (%)
Ancestries Reported - Italian (%)
Ancestries Reported - Lithuanian (%)
Ancestries Reported - Norwegian (%)
Ancestries Reported - Polish (%)
Ancestries Reported - Portuguese (%)
Ancestries Reported - Russian (%)
Ancestries Reported - Scotch-Irish (%)
Ancestries Reported - Scottish (%)
Ancestries Reported - Slovak (%)
Ancestries Reported - Subsaharan African (%)
Ancestries Reported - Swedish (%)
Ancestries Reported - Swiss (%)
Ancestries Reported - Ukrainian (%)
Ancestries Reported - United States (%)
Ancestries Reported - Welsh (%)
Ancestries Reported - West Indian (%)
Ancestries Reported - Other (%)
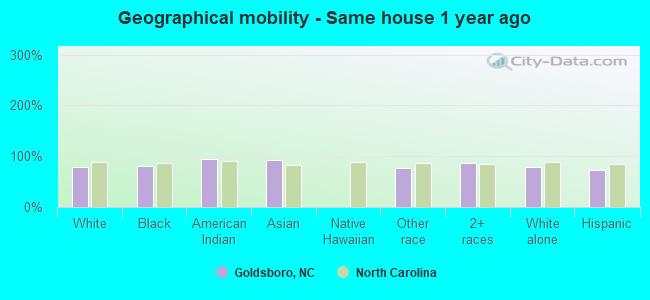
Geographical mobility - Same house 1 year ago (%)
Geographical mobility - Same house 1 year ago (%) - White
Geographical mobility - Same house 1 year ago (%) - Black or African American
Geographical mobility - Same house 1 year ago (%) - Asian
Geographical mobility - Same house 1 year ago (%) - Hispanic or Latino
Geographical mobility - Same house 1 year ago (%) - American Indian and Alaska Native
Geographical mobility - Same house 1 year ago (%) - Multirace
Geographical mobility - Same house 1 year ago (%) - Other Race
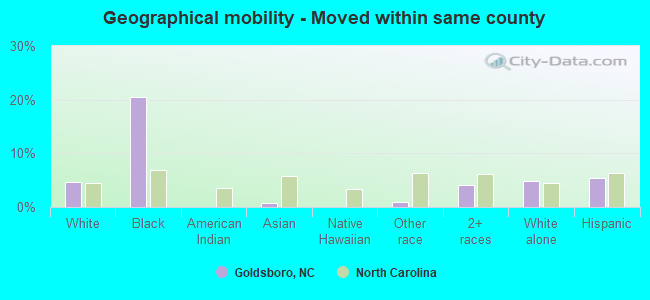
Geographical mobility - Moved within same county (%)
Geographical mobility - Moved within same county (%) - White
Geographical mobility - Moved within same county (%) - Black or African American
Geographical mobility - Moved within same county (%) - Asian
Geographical mobility - Moved within same county (%) - Hispanic or Latino
Geographical mobility - Moved within same county (%) - American Indian and Alaska Native
Geographical mobility - Moved within same county (%) - Multirace
Geographical mobility - Moved within same county (%) - Other Race
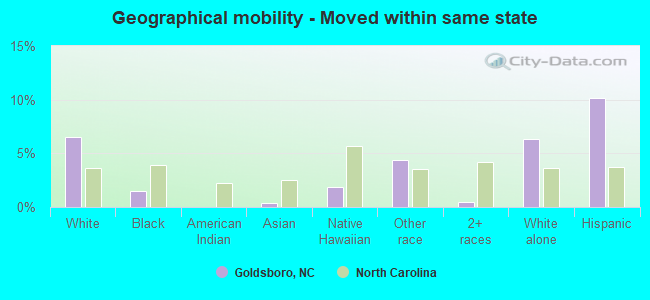
Geographical mobility - Moved from different county within same state (%)
Geographical mobility - Moved from different county within same state (%) - White
Geographical mobility - Moved from different county within same state (%) - Black or African American
Geographical mobility - Moved from different county within same state (%) - Asian
Geographical mobility - Moved from different county within same state (%) - Hispanic or Latino
Geographical mobility - Moved from different county within same state (%) - American Indian and Alaska Native
Geographical mobility - Moved from different county within same state (%) - Multirace
Geographical mobility - Moved from different county within same state (%) - Other Race
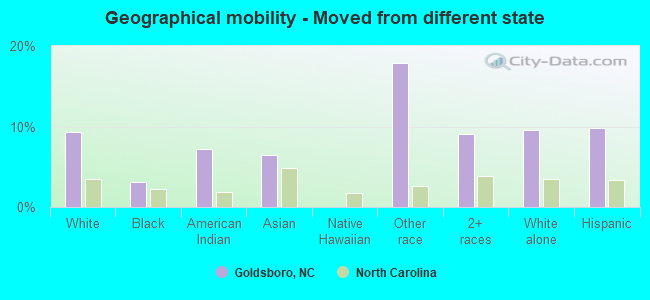
Geographical mobility - Moved from different state (%)
Geographical mobility - Moved from different state (%) - White
Geographical mobility - Moved from different state (%) - Black or African American
Geographical mobility - Moved from different state (%) - Asian
Geographical mobility - Moved from different state (%) - Hispanic or Latino
Geographical mobility - Moved from different state (%) - American Indian and Alaska Native
Geographical mobility - Moved from different state (%) - Multirace
Geographical mobility - Moved from different state (%) - Other Race
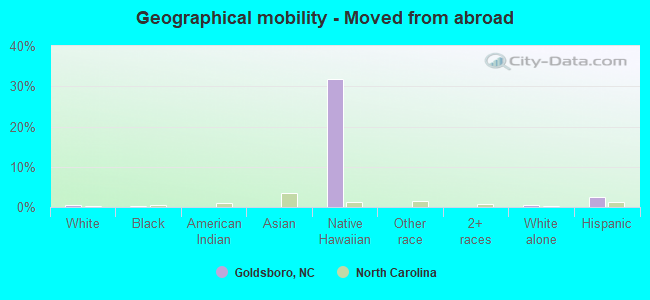
Geographical mobility - Moved from abroad (%)
Geographical mobility - Moved from abroad (%) - White
Geographical mobility - Moved from abroad (%) - Black or African American
Geographical mobility - Moved from abroad (%) - Asian
Geographical mobility - Moved from abroad (%) - Hispanic or Latino
Geographical mobility - Moved from abroad (%) - American Indian and Alaska Native
Geographical mobility - Moved from abroad (%) - Multirace
Geographical mobility - Moved from abroad (%) - Other Race
Place of birth for the foreign-born population - Ireland (%)
Place of birth for the foreign-born population - Denmark (%)
Place of birth for the foreign-born population - Norway (%)
Place of birth for the foreign-born population - Sweden (%)
Place of birth for the foreign-born population - United Kingdom (%)
Place of birth for the foreign-born population - England (%)
Place of birth for the foreign-born population - Scotland (%)
Place of birth for the foreign-born population - Other Northern Europe (%)
Place of birth for the foreign-born population - Austria (%)
Place of birth for the foreign-born population - Belgium (%)
Place of birth for the foreign-born population - France (%)
Place of birth for the foreign-born population - Germany (%)
Place of birth for the foreign-born population - Netherlands (%)
Place of birth for the foreign-born population - Switzerland (%)
Place of birth for the foreign-born population - Other Western Europe (%)
Place of birth for the foreign-born population - Greece (%)
Place of birth for the foreign-born population - Italy (%)
Place of birth for the foreign-born population - Portugal (%)
Place of birth for the foreign-born population - Spain (%)
Place of birth for the foreign-born population - Other Southern Europe (%)
Place of birth for the foreign-born population - Albania (%)
Place of birth for the foreign-born population - Belarus (%)
Place of birth for the foreign-born population - Bosnia and Herzegovina (%)
Place of birth for the foreign-born population - Bulgaria (%)
Place of birth for the foreign-born population - Croatia (%)
Place of birth for the foreign-born population - Czechoslovakia (%)
Place of birth for the foreign-born population - Hungary (%)
Place of birth for the foreign-born population - Latvia (%)
Place of birth for the foreign-born population - Lithuania (%)
Place of birth for the foreign-born population - North Macedonia (Macedonia) (%)
Place of birth for the foreign-born population - Moldova (%)
Place of birth for the foreign-born population - Poland (%)
Place of birth for the foreign-born population - Romania (%)
Place of birth for the foreign-born population - Russia (%)
Place of birth for the foreign-born population - Serbia (%)
Place of birth for the foreign-born population - Ukraine (%)
Place of birth for the foreign-born population - Other Eastern Europe (%)
Place of birth for the foreign-born population - China (%)
Place of birth for the foreign-born population - Hong Kong (%)
Place of birth for the foreign-born population - Taiwan (%)
Place of birth for the foreign-born population - Japan (%)
Place of birth for the foreign-born population - Korea (%)
Place of birth for the foreign-born population - Other Eastern Asia (%)
Place of birth for the foreign-born population - Afghanistan (%)
Place of birth for the foreign-born population - Bangladesh (%)
Place of birth for the foreign-born population - India (%)
Place of birth for the foreign-born population - Iran (%)
Place of birth for the foreign-born population - Kazakhstan (%)
Place of birth for the foreign-born population - Nepal (%)
Place of birth for the foreign-born population - Pakistan (%)
Place of birth for the foreign-born population - Sri Lanka (%)
Place of birth for the foreign-born population - Uzbekistan (%)
Place of birth for the foreign-born population - Other South Central Asia (%)
Place of birth for the foreign-born population - Burma (%)
Place of birth for the foreign-born population - Cambodia (%)
Place of birth for the foreign-born population - Indonesia (%)
Place of birth for the foreign-born population - Laos (%)
Place of birth for the foreign-born population - Malaysia (%)
Place of birth for the foreign-born population - Philippines (%)
Place of birth for the foreign-born population - Singapore (%)
Place of birth for the foreign-born population - Thailand (%)
Place of birth for the foreign-born population - Vietnam (%)
Place of birth for the foreign-born population - Other South Eastern Asia (%)
Place of birth for the foreign-born population - Armenia (%)
Place of birth for the foreign-born population - Iraq (%)
Place of birth for the foreign-born population - Israel (%)
Place of birth for the foreign-born population - Jordan (%)
Place of birth for the foreign-born population - Kuwait (%)
Place of birth for the foreign-born population - Lebanon (%)
Place of birth for the foreign-born population - Saudi Arabia (%)
Place of birth for the foreign-born population - Syria (%)
Place of birth for the foreign-born population - Turkey (%)
Place of birth for the foreign-born population - Yemen (%)
Place of birth for the foreign-born population - Other Western Asia (%)
Place of birth for the foreign-born population - Eritrea (%)
Place of birth for the foreign-born population - Ethiopia (%)
Place of birth for the foreign-born population - Kenya (%)
Place of birth for the foreign-born population - Somalia (%)
Place of birth for the foreign-born population - Uganda (%)
Place of birth for the foreign-born population - Zimbabwe (%)
Place of birth for the foreign-born population - Other Eastern Africa (%)
Place of birth for the foreign-born population - Cameroon (%)
Place of birth for the foreign-born population - Congo (%)
Place of birth for the foreign-born population - Democratic Republic of Congo (Zaire) (%)
Place of birth for the foreign-born population - Other Middle Africa (%)
Place of birth for the foreign-born population - Egypt (%)
Place of birth for the foreign-born population - Morocco (%)
Place of birth for the foreign-born population - Sudan (%)
Place of birth for the foreign-born population - Other Northern Africa (%)
Place of birth for the foreign-born population - South Africa (%)
Place of birth for the foreign-born population - Other Southern Africa (%)
Place of birth for the foreign-born population - Cabo Verde (%)
Place of birth for the foreign-born population - Ghana (%)
Place of birth for the foreign-born population - Liberia (%)
Place of birth for the foreign-born population - Nigeria (%)
Place of birth for the foreign-born population - Senegal (%)
Place of birth for the foreign-born population - Sierra Leone (%)
Place of birth for the foreign-born population - Other Western Africa (%)
Place of birth for the foreign-born population - Australia (%)
Place of birth for the foreign-born population - New Zealand (%)
Place of birth for the foreign-born population - Fiji (%)
Place of birth for the foreign-born population - Micronesia (%)
Place of birth for the foreign-born population - Bahamas (%)
Place of birth for the foreign-born population - Barbados (%)
Place of birth for the foreign-born population - Cuba (%)
Place of birth for the foreign-born population - Dominica (%)
Place of birth for the foreign-born population - Dominican Republic (%)
Place of birth for the foreign-born population - Grenada (%)
Place of birth for the foreign-born population - Haiti (%)
Place of birth for the foreign-born population - Jamaica (%)
Place of birth for the foreign-born population - St. Vincent and the Grenadines (%)
Place of birth for the foreign-born population - Trinidad and Tobago (%)
Place of birth for the foreign-born population - West Indies (%)
Place of birth for the foreign-born population - Other Caribbean (%)
Place of birth for the foreign-born population - Belize (%)
Place of birth for the foreign-born population - Costa Rica (%)
Place of birth for the foreign-born population - El Salvador (%)
Place of birth for the foreign-born population - Guatemala (%)
Place of birth for the foreign-born population - Honduras (%)
Place of birth for the foreign-born population - Mexico (%)
Place of birth for the foreign-born population - Nicaragua (%)
Place of birth for the foreign-born population - Panama (%)
Place of birth for the foreign-born population - Other Central America (%)
Place of birth for the foreign-born population - Argentina (%)
Place of birth for the foreign-born population - Bolivia (%)
Place of birth for the foreign-born population - Brazil (%)
Place of birth for the foreign-born population - Chile (%)
Place of birth for the foreign-born population - Colombia (%)
Place of birth for the foreign-born population - Ecuador (%)
Place of birth for the foreign-born population - Guyana (%)
Place of birth for the foreign-born population - Peru (%)
Place of birth for the foreign-born population - Uruguay (%)
Place of birth for the foreign-born population - Venezuela (%)
Place of birth for the foreign-born population - Other South America (%)
Place of birth for the foreign-born population - Canada (%)
Place of birth for the foreign-born population - Other Northern America (%)
Place of birth for the foreign-born population - Other (%)
Latest news about races in Goldsboro, NC collected exclusively by city-data.com from local newspapers, TV, and radio stations
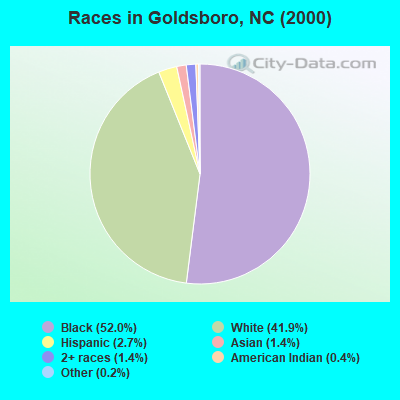
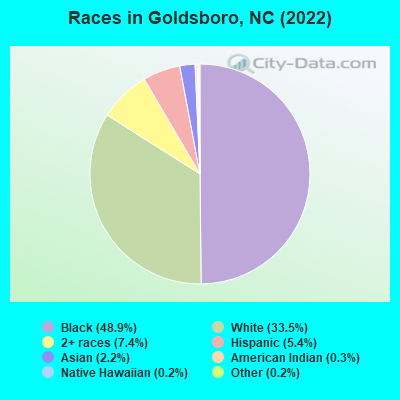
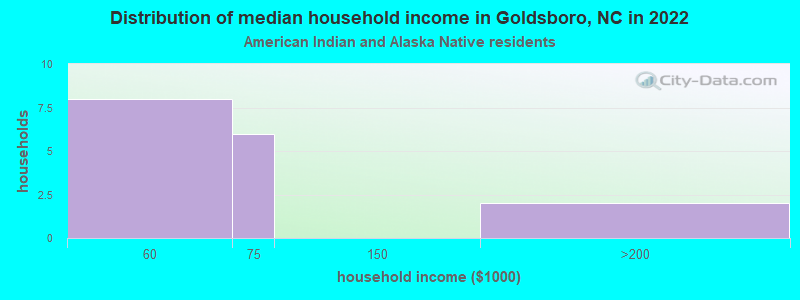
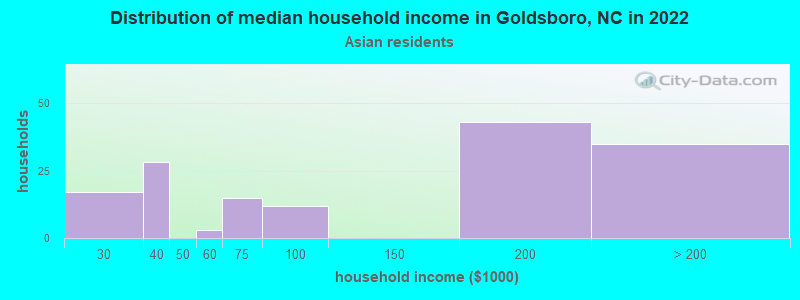
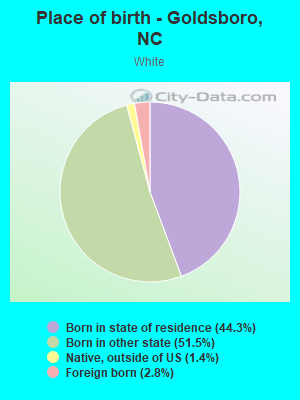
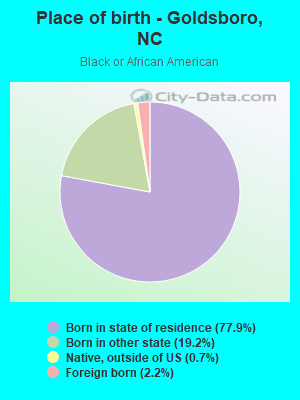
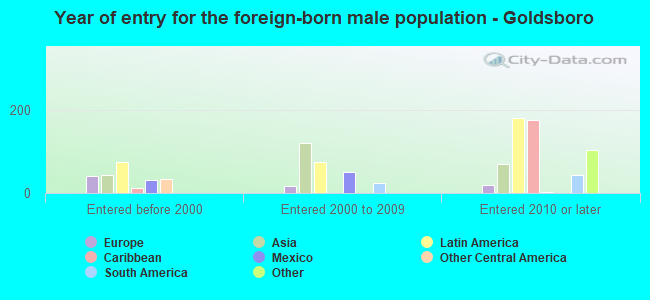
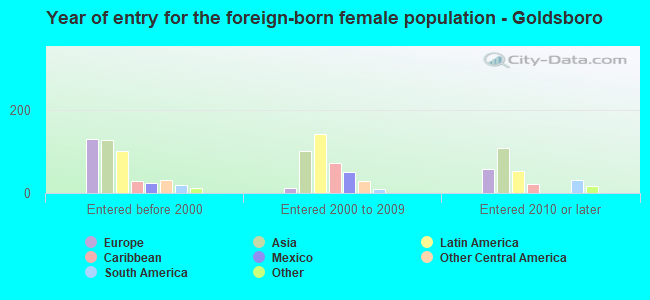
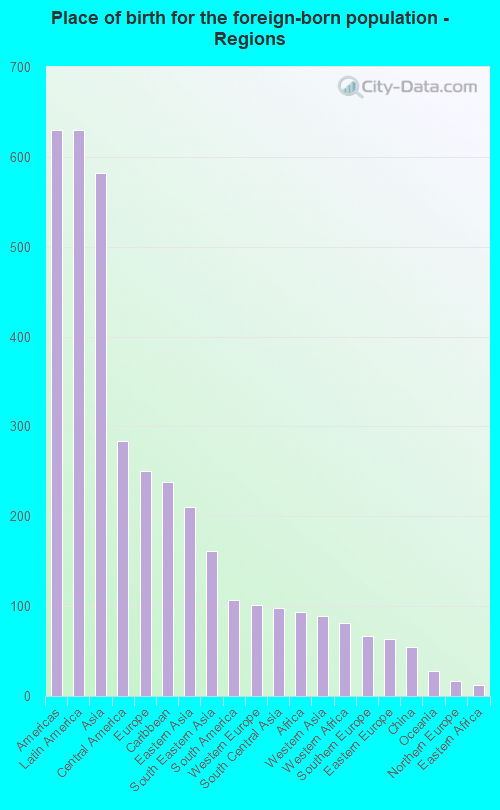
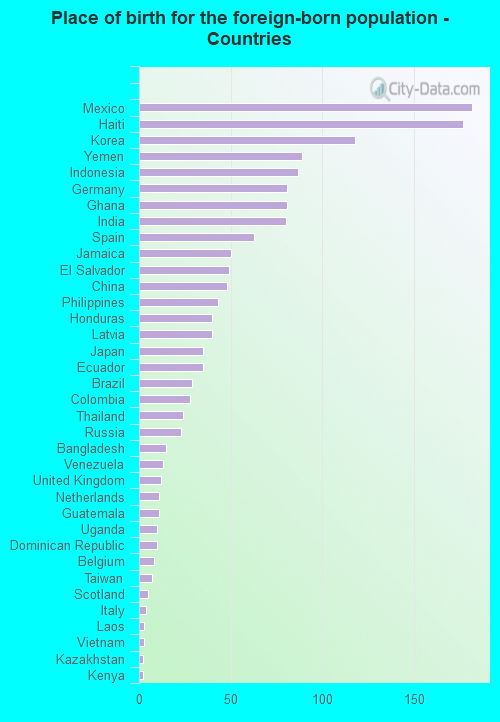
According to 2022 data, the most numerous races in Goldsboro, NC are White alone (11,223 residents), Black alone (16,399 residents), and Hispanic (1,798 residents). 89.2% of Goldsboro residents speak English at home. 4.7% of Goldsboro, NC residents are foreign-born (1.8% born in Latin America, 1.6% born in Asia, 0.7% born in Europe), which is 69.1% less than the foreign-born rate of 8.0% across the entire state of North Carolina.
Race distribution in Goldsboro
2000 2022
5,647,155 70.2% White alone 1,723,301 21.4% Black alone 378,963 4.7% Hispanic 112,416 1.4% Asian alone 95,333 1.2% American Indian alone 79,965 1.0% Two or more races 9,015 0.1% Other race alone 3,165 0.04% Native Hawaiian and Other
6,497,519 60.7% White alone 2,155,650 20.1% Black alone 1,114,799 10.4% Hispanic 438,061 4.1% Two or more races 341,052 3.2% Asian alone 91,758 0.9% American Indian alone 50,180 0.5% Other race alone 9,954 0.09% Native Hawaiian and Other
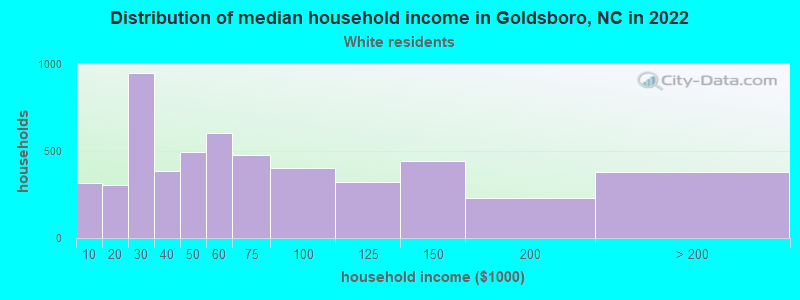
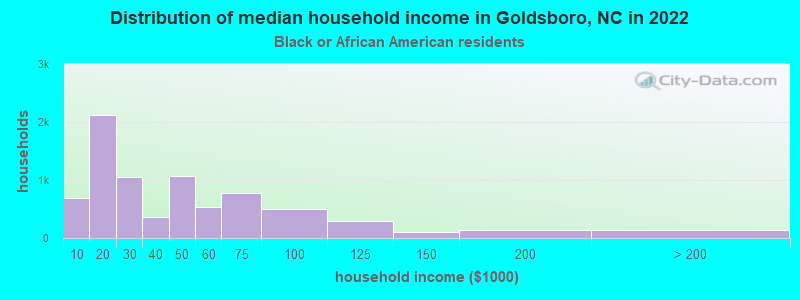
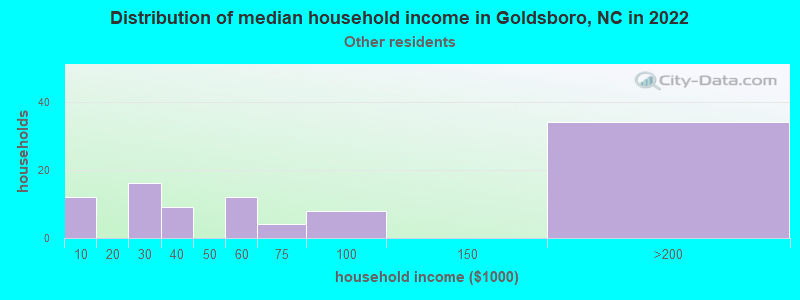
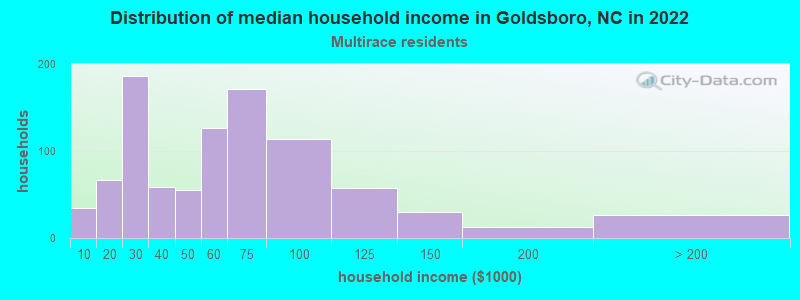
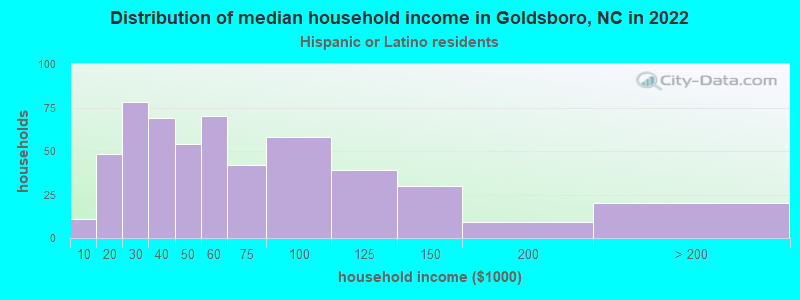
Income and house value in Goldsboro Median household income in 2022 $52,781 White non-Hispanic householders$37,939 Black householders$60,547 American Indian and Alaska Native householders$54,946 Two or more races householders$56,373 Hispanic or Latino race householdersMedian 2022 house value $204,753 White Non-Hispanic householders$157,339 Black or African American householders $478,396 Asian householders$327,861 Some other race householders$218,574 Two or more races householders$195,823 Hispanic or Latino householders
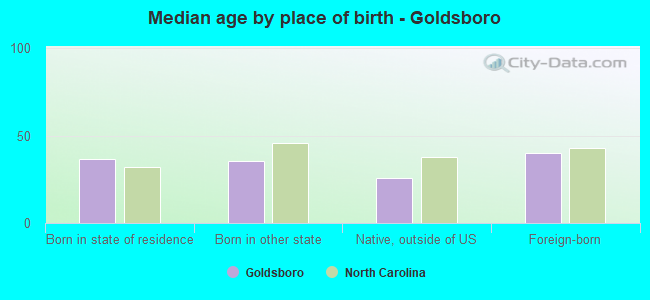
Median age by race in Goldsboro
40.5 Median age for White residents35.1 44.4 38.3 Median age for Black or African American residents34.8 40.5 85.2 Median age for American Indian / Alaska Native residents85.8 55.3 44.4 Median age for Asian residents26.3 51.3 22.2 Median age for Native Hawaiian / Pacific Islander residents7.2 -612,403,100.2 26.0 Median age for Other race residents32.4 15.7 26.9 Median age for Two or more races residents25.4 29.3 39.3 Median age for White alone residents35.1 45.6 23.0 Median age for Hispanic or Latino residents24.4 21.8
Owner/renter occupied households by race in Goldsboro
House owners and renters - White residents 2,467 46.1% Owner occupied2,888 53.9% Renter occupiedHouse owners and renters - Black or African American residents 2,408 31.4% Owner occupied5,273 68.6% Renter occupiedHouse owners and renters - American Indian / Alaska Native residents 7 36.4% Owner occupied11 63.6% Renter occupiedHouse owners and renters - Asian residents 91 62.5% Owner occupied55 37.5% Renter occupiedHouse owners and renters - Native Hawaiian / Pacific Islander residents 36 100.0% Renter occupiedHouse owners and renters - Other race residents 30 54.8% Owner occupied24 45.2% Renter occupiedHouse owners and renters - Two or more races residents 247 20.0% Owner occupied990 80.0% Renter occupiedHouse owners and renters - White alone residents 2,495 45.5% Owner occupied2,988 54.5% Renter occupiedHouse owners and renters - Hispanic or Latino residents 253 52.0% Owner occupied234 48.0% Renter occupied
Language usage in Goldsboro
English speakers - Total 89.2% of residents of Goldsboro speak English at home.
4.5% of residents speak Spanish at home 914 64.4% Speak English very well506 35.6% Speak English less than very well5.2% of residents speak other language at home 1,008 62.1% Speak English very well616 37.9% Speak English less than very well
English speakers - Born in the United States 95.1% of residents of Goldsboro speak English at home.
3.6% of residents speak Spanish at home 266 69.6% Speak English very well116 30.4% Speak English less than very well2.1% of residents speak other language at home 218 100.0% Speak English very well
English speakers - Native, born elsewhere 72.1% of residents of Goldsboro speak English at home.
14.7% of residents speak Spanish at home 57 90.5% Speak English very well6 9.5% Speak English less than very well15.8% of residents speak other language at home 68 100.0% Speak English very well
English speakers - Foreign-born 14.0% of residents of Goldsboro speak English at home.
25.2% of residents speak Spanish at home 148 31.0% Speak English very well330 69.0% Speak English less than very well61.2% of residents speak other language at home 606 52.2% Speak English very well556 47.8% Speak English less than very well
White (Caucasian) - Speak only English Native:
98.6% (10,136)Foreign-born:
28.4% (92)
White (Caucasian) - Speak another language Native:
2.2% (226)Foreign-born:
69.7% (225)
Black or African American - Speak only English Native:
98.9% (16,620)Foreign-born:
32.8% (81)
Black or African American - Speak another language Native:
1.1% (186)Foreign-born:
67.0% (166)
Asian - Speak only English Native:
18.8% (25)Foreign-born:
12.9% (58)
Asian - Speak another language Native:
81.6% (109)Foreign-born:
87.2% (390)
Native Hawaiian / Pacific Islander - Speak another language Native:
48.8% (21)Foreign-born:
71.9% (34)
Other race - Speak only English Native:
41.8% (98)Foreign-born:
27.0% (14)
Other race - Speak another language Native:
54.8% (128)Foreign-born:
82.6% (43)
Two or more races - Speak only English Native:
69.4% (1,993)Foreign-born:
1.3% (5)
Two or more races - Speak another language Native:
16.6% (477)Foreign-born:
99.4% (405)
White alone - Speak only English Native:
97.6% (9,954)Foreign-born:
23.4% (92)
White alone - Speak another language Native:
2.3% (233)Foreign-born:
79.3% (311)
Hispanic or Latino - Speak only English Native:
17.8% (209)Foreign-born:
2.8% (14)
Hispanic or Latino - Speak another language Native:
72.6% (852)Foreign-born:
96.9% (484)
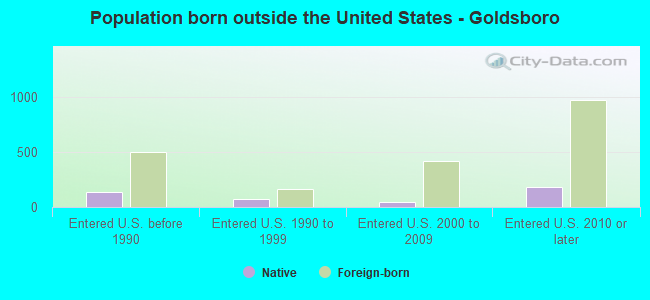
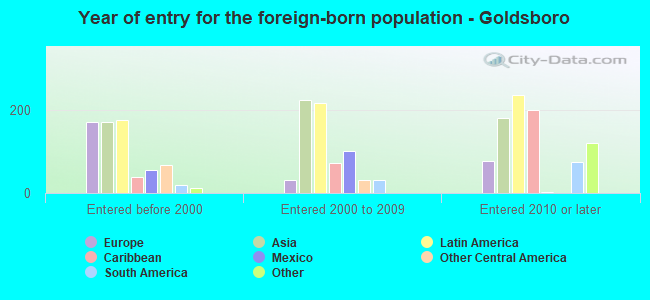
Foreign-born residents in Goldsboro 1,585 residents are foreign born (1.8% Latin America , 1.6% Asia , 0.7% Europe ).
This city:
4.7%North Carolina:
8.3%
Marital status for residents in Goldsboro Marital status - White (Caucasian) population 15 years and over
Males 38.0% Never married49.5% Now married1.8% Separated4.0% Widowed6.7% DivorcedFemales 15.9% Never married50.4% Now married3.6% Separated10.6% Widowed19.5% DivorcedWomen who gave birth in the past 12 months Now married:
100.0% (127)Unmarried:
0.0% (0)
Women who did not give birth in the past 12 months Now married:
59.3% (1,377)Unmarried:
40.7% (945)
Marital status - Black or African American population 15 years and over
Males 51.4% Never married32.9% Now married2.9% Separated3.3% Widowed9.5% DivorcedFemales 45.7% Never married23.5% Now married5.4% Separated10.5% Widowed14.9% DivorcedWomen who gave birth in the past 12 months Now married:
28.1% (87)Unmarried:
71.9% (222)
Women who did not give birth in the past 12 months Now married:
19.8% (674)Unmarried:
80.2% (2,724)
Marital status - American Indian / Alaska Native population 15 years and over
Males 54.3% Never married0.0% Now married0.0% Separated0.0% Widowed45.7% DivorcedFemales 0.0% Never married62.5% Now married0.0% Separated0.0% Widowed37.5% DivorcedWomen who did not give birth in the past 12 months Now married:
100.0% (8)Unmarried:
0.0% (0)
Marital status - Asian population 15 years and over
Males 43.9% Never married54.6% Now married1.5% Separated0.0% Widowed0.0% DivorcedFemales 17.5% Never married77.6% Now married0.0% Separated4.9% Widowed0.0% DivorcedWomen who did not give birth in the past 12 months Now married:
84.7% (128)Unmarried:
15.3% (23)
Marital status - Native Hawaiian / Pacific Islander population 15 years and over
Males 0.0% Never married100.0% Now married0.0% Separated0.0% Widowed0.0% DivorcedFemales 5.6% Never married94.4% Now married0.0% Separated0.0% Widowed0.0% DivorcedWomen who gave birth in the past 12 months Now married:
100.0% (18)Unmarried:
0.0% (0)
Women who did not give birth in the past 12 months Now married:
0.0% (0)Unmarried:
100.0% (1)
Marital status - Other race population 15 years and over
Males 80.6% Never married19.4% Now married0.0% Separated0.0% Widowed0.0% DivorcedFemales 57.4% Never married25.9% Now married16.7% Separated0.0% Widowed0.0% DivorcedWomen who did not give birth in the past 12 months Now married:
51.2% (58)Unmarried:
48.8% (55)
Marital status - Two or more races population 15 years and over
Males 53.1% Never married23.6% Now married1.4% Separated2.0% Widowed19.9% DivorcedFemales 46.3% Never married33.7% Now married6.4% Separated5.6% Widowed8.1% DivorcedWomen who gave birth in the past 12 months Now married:
100.0% (22)Unmarried:
0.0% (0)
Women who did not give birth in the past 12 months Now married:
34.0% (146)Unmarried:
66.0% (285)
Marital status - White alone, not Hispanic / Latino population 15 years and over
Males 36.8% Never married50.5% Now married1.9% Separated4.3% Widowed6.5% DivorcedFemales 12.5% Never married52.5% Now married3.7% Separated10.9% Widowed20.4% DivorcedWomen who gave birth in the past 12 months Now married:
100.0% (139)Unmarried:
0.0% (0)
Women who did not give birth in the past 12 months Now married:
64.1% (1,516)Unmarried:
35.9% (849)
Marital status - Hispanic or Latino population 15 years and over
Males 56.7% Never married35.8% Now married0.0% Separated1.3% Widowed6.1% DivorcedFemales 51.0% Never married34.7% Now married4.8% Separated4.3% Widowed5.3% DivorcedWomen who gave birth in the past 12 months Now married:
100.0% (17)Unmarried:
0.0% (0)
Women who did not give birth in the past 12 months Now married:
31.3% (146)Unmarried:
68.7% (321)
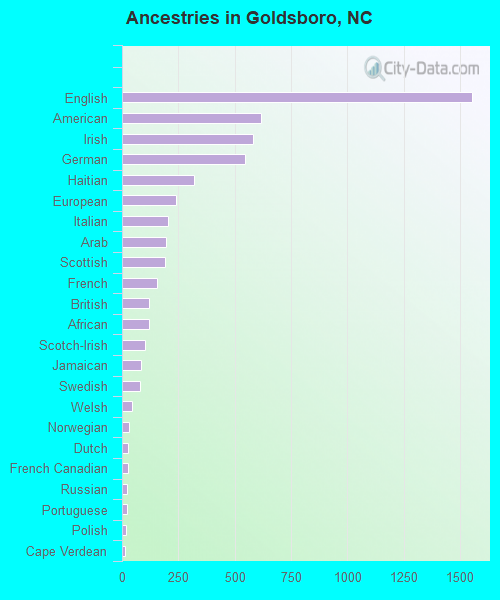
Ancestries in Goldsboro
1,552 11.6% English618 4.6% American581 4.3% Irish546 4.1% German318 2.4% Haitian238 1.8% European204 1.5% Italian197 1.5% Arab189 1.4% Scottish155 1.2% French122 0.9% British121 0.9% African102 0.8% Scotch-Irish85 0.6% Jamaican82 0.6% Swedish43 0.3% Welsh29 0.2% Norwegian27 0.2% Dutch26 0.2% French Canadian24 0.2% Russian23 0.2% Portuguese17 0.1% Polish15 0.1% Cape Verdean10 0.07% Lebanese9 0.07% Palestinian1 0.01% Kenyan
Geographical mobility in Goldsboro Same house 1 year ago 8,570 79.5% White (Caucasian)13,001 80.8% Black or African American52 94.9% American Indian / Alaska Native585 92.9% Asian403 77.2% Other race2,178 86.8% Two or more races8,824 79.8% White alone, not Hispanic / Latino1,308 73.6% Hispanic or LatinoMoved within same county 513 4.8% White / Caucasian3,300 20.5% Black or African American5 0.7% Asian4 0.9% Other race103 4.1% Two or more races529 4.8% White alone, not Hispanic / Latino95 5.3% Hispanic or LatinoMoved within same state 701 6.5% White / Caucasian233 1.5% Black or African American3 0.4% Asian2 1.9% Native Hawaiian / Pacific Islander23 4.4% Other race13 0.5% Two or more races705 6.4% White alone, not Hispanic / Latino181 10.2% Hispanic or LatinoMoved from different state 1,003 9.3% White / Caucasian491 3.1% Black or African American4 7.2% American Indian / Alaska Native40 6.4% Asian93 17.9% Other race228 9.1% Two or more races1,057 9.6% White alone, not Hispanic / Latino175 9.8% Hispanic or LatinoMoved from abroad 55 0.5% White21 0.1% Black or African American36 31.8% Native Hawaiian / Pacific Islander51 0.5% White alone, not Hispanic / Latino44 2.5% Hispanic or Latino
Children Nativity (place of birth) in Goldsboro
Children under 6 years - Living with two parents Both parents native 640 100.0% NativeBoth parents foreign-born 163 100.0% NativeOne native, one foreign-born parent 20 100.0% NativeChildren under 6 years - Living with one parent Native parent 1,433 100.0% NativeForeign-born parent 196 90.7% Native20 9.3% Foreign-bornChildren 6 to 17 years - Living with two parents Both parents native 1,161 100.0% NativeBoth parents foreign-born 255 81.5% Native58 18.5% Foreign-bornOne native, one foreign-born parent 47 100.0% NativeChildren 6 to 17 years - Living with one parent Native parent 2,540 100.0% NativeForeign-born parent 206 64.0% Native116 36.0% Foreign-born
Grandparents responsible for own grandchildren in Goldsboro
Grandparents (30 to 59 years) White / Caucasian 18 100.0% Responsible for grandchildrenBlack or African American 191 53.1% Responsible for grandchildren168 46.9% Not responsible for grandchildrenAmerican Indian / Alaska Native 13 100.0% Not responsible for grandchildrenWhite alone, not Hispanic / Latino 19 100.0% Responsible for grandchildrenGrandparents (60 years and over) White / Caucasian 73 54.9% Responsible for grandchildren60 45.1% Not responsible for grandchildrenBlack or African American 136 78.5% Responsible for grandchildren37 21.5% Not responsible for grandchildrenWhite alone, not Hispanic / Latino 75 54.5% Responsible for grandchildren63 45.5% Not responsible for grandchildren