Races in Golden Heights, Florida (FL) Detailed Stats
Ancestries, Foreign-born residents, place of birth

Discuss Golden Heights, Florida races on our local forum with over 2,400,000 registered users
3.2% of Golden Heights, FL residents are foreign-born (3.2% born in Latin America), which is 557.6% less than the foreign-born rate of 21.0% across the entire state of Florida.
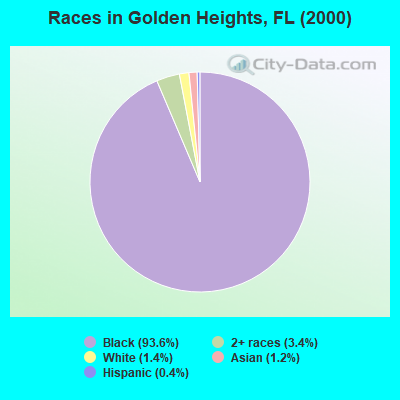
Race distribution in Golden Heights

- 46993.6%Black alone
- 173.4%Two or more races
- 71.4%White alone
- 61.2%Asian alone
- 20.4%Hispanic
2000
2022
-
- 10,458,50965.4%White alone
- 2,682,71516.8%Hispanic
- 2,264,26814.2%Black alone
- 261,6931.6%Asian alone
- 236,9541.5%Two or more races
- 42,3580.3%American Indian alone
- 28,9940.2%Other race alone
- 6,8870.04%Native Hawaiian and Other
Pacific Islander alone

-
- 11,309,40350.8%White alone
- 6,025,03927.1%Hispanic
- 3,241,01514.6%Black alone
- 861,6303.9%Two or more races
- 623,6922.8%Asian alone
- 152,0540.7%Other race alone
- 22,5040.1%American Indian alone
- 9,4860.04%Native Hawaiian and Other
Pacific Islander alone

Income and house value in Golden Heights
- Median household income in 2022
- $68,003Black householders
- $114,110Two or more races householders
- Median 2022 house value
- $309,219Black or African American householders
- $124,530Two or more races householders
Household income for Black householders

Household income for Two or more races householders

Foreign-born residents in Golden Heights
16 residents are foreign born (3.2% Latin America).
| This city: | 3.2% |
| Florida: | 16.7% |
Ancestries in Golden Heights

- 53392.9%Other
- 162.8%Subsaharan African
- 91.6%United States
- 81.4%West Indian
- 40.7%Arab
- 40.7%Irish

Zip codes: 33311.