Races in Golconda, Nevada (NV) Detailed Stats
Ancestries, Foreign-born residents, place of birth

Data:
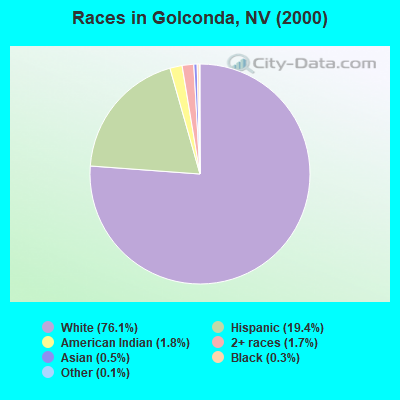
Race distribution in Golconda

- 7,57776.1%White alone
- 1,93019.4%Hispanic
- 1791.8%American Indian alone
- 1741.7%Two or more races
- 500.5%Asian alone
- 290.3%Black alone
- 110.1%Other race alone
- 20.02%Native Hawaiian and Other
Pacific Islander alone
2000
2022
-
- 1,303,00165.2%White alone
- 393,97019.7%Hispanic
- 131,5096.6%Black alone
- 88,5934.4%Asian alone
- 49,2312.5%Two or more races
- 21,3971.1%American Indian alone
- 7,7690.4%Native Hawaiian and Other
Pacific Islander alone
- 2,7870.1%Other race alone
-
- 1,410,14544.4%White alone
- 961,35730.3%Hispanic
- 286,4719.0%Black alone
- 281,1498.8%Asian alone
- 182,1515.7%Two or more races
- 20,1020.6%Native Hawaiian and Other
Pacific Islander alone
- 18,7810.6%Other race alone
- 17,6160.6%American Indian alone
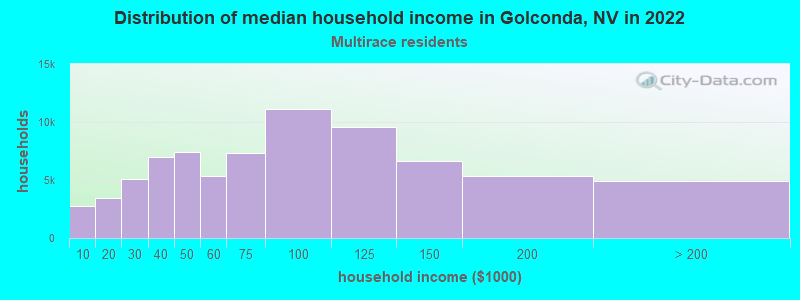
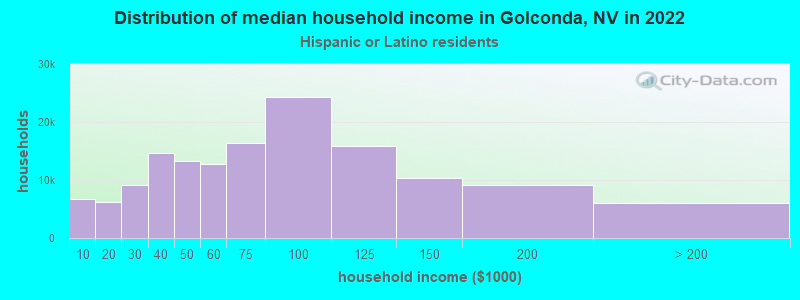
Income and house value in Golconda
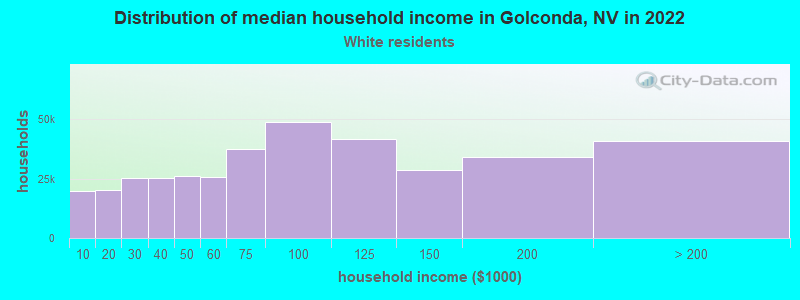
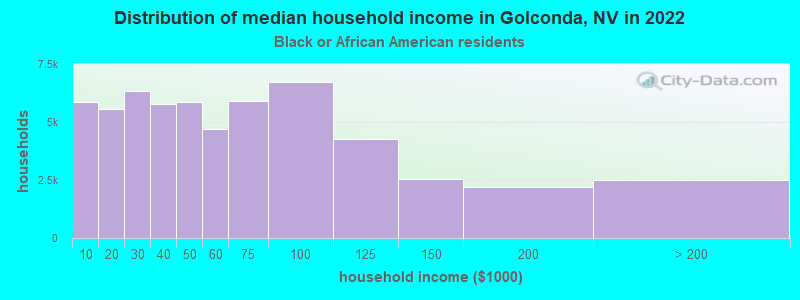
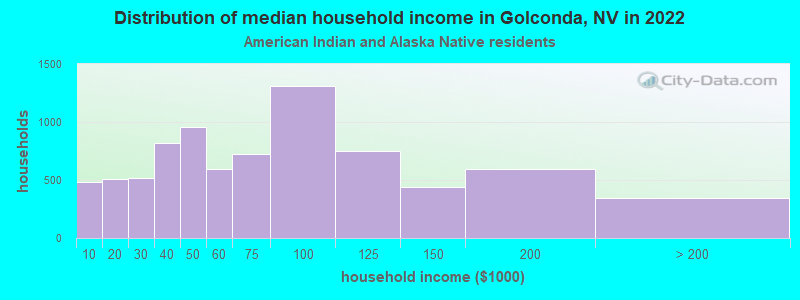
- Median household income in 2022
- $86,304White non-Hispanic householders
- $20,813Black householders
- $66,235American Indian and Alaska Native householders
- $86,232Some other race householders
- $85,822Two or more races householders
- $90,192Hispanic or Latino race householders
- Median 2022 house value
- $384,108White Non-Hispanic householders
- $135,994Black or African American householders
- $100,031American Indian or Alaska Native householders
- $294,352Some other race householders
- $484,140Two or more races householders
- $289,517Hispanic or Latino householders