Races in Germantown, Wisconsin (WI) Detailed Stats
Data:
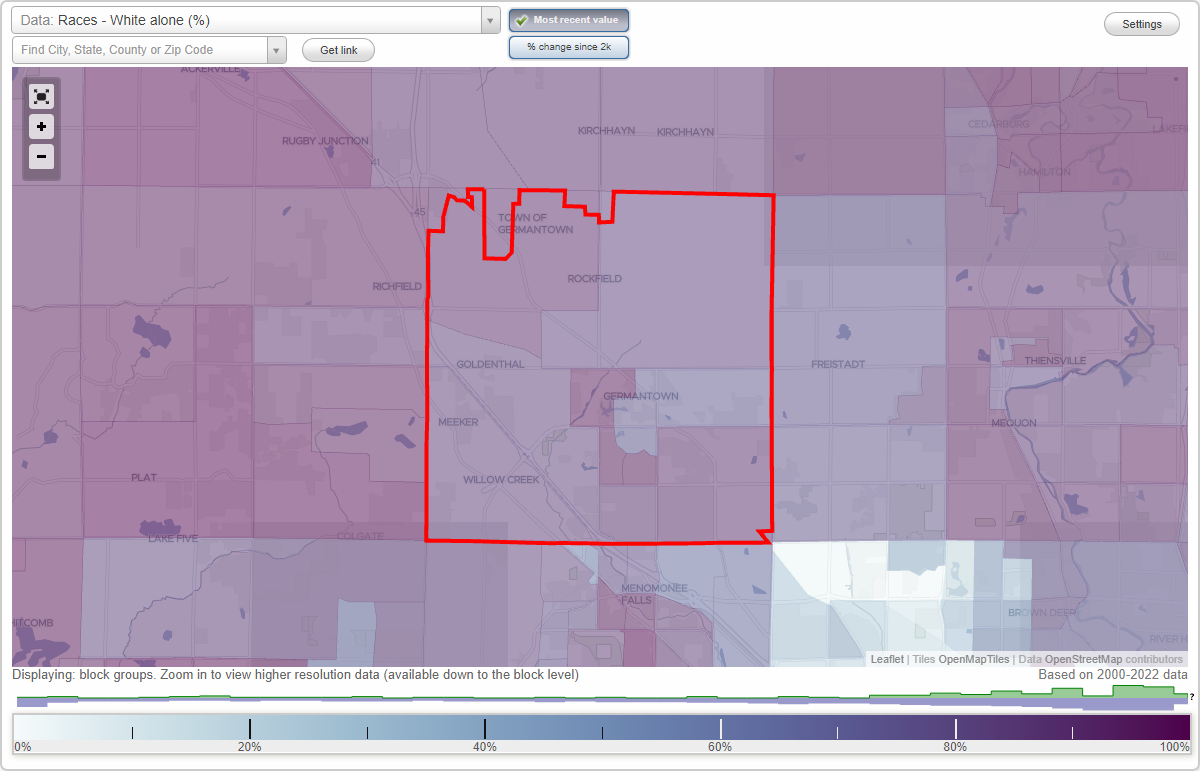
Races - White alone (%)
Races - White alone (% change since 2000)
Races - Black alone (%)
Races - Black alone (% change since 2000)
Races - American Indian alone (%)
Races - American Indian alone (% change since 2000)
Races - Asian alone (%)
Races - Asian alone (% change since 2000)
Races - Hispanic (%)
Races - Hispanic (% change since 2000)
Races - Native Hawaiian and Other Pacific Islander alone (%)
Races - Native Hawaiian and Other Pacific Islander alone (% change since 2000)
Races - Two or more races(%)
Races - Two or more races(% change since 2000)
Races - Other race alone (%)
Races - Other race alone (% change since 2000)
Racial diversity
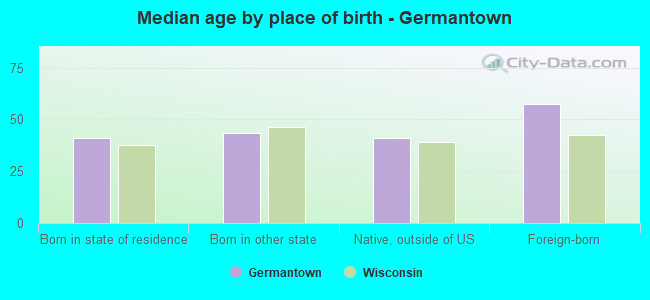
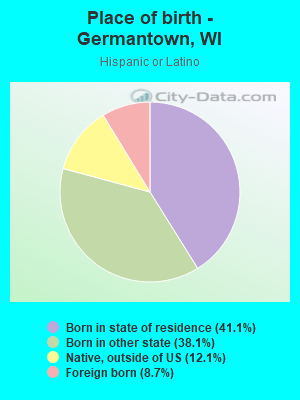
Place of birth - Born in state of residence (%)
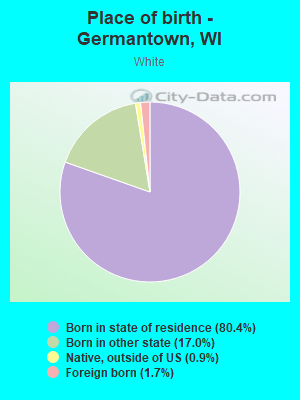
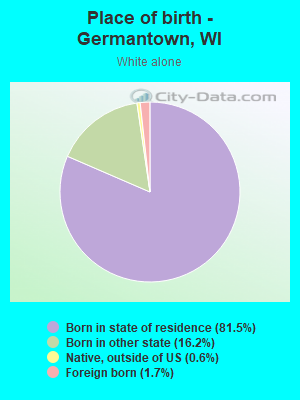
Place of birth - Born in state of residence (%) - White
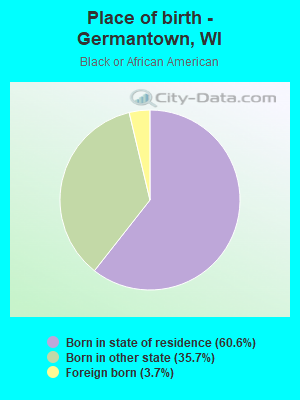
Place of birth - Born in state of residence (%) - Black or African American
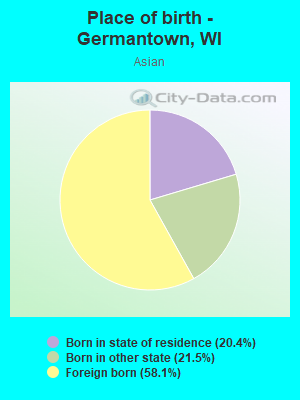
Place of birth - Born in state of residence (%) - Asian
Place of birth - Born in state of residence (%) - Hispanic or Latino
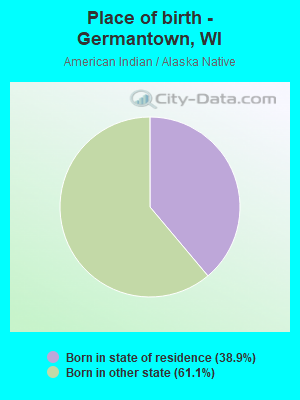
Place of birth - Born in state of residence (%) - American Indian and Alaska Native
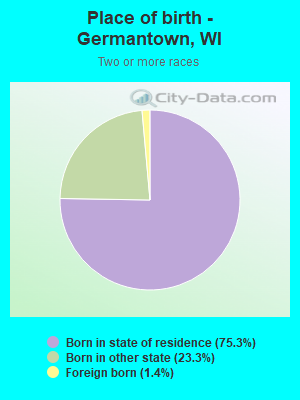
Place of birth - Born in state of residence (%) - Multirace
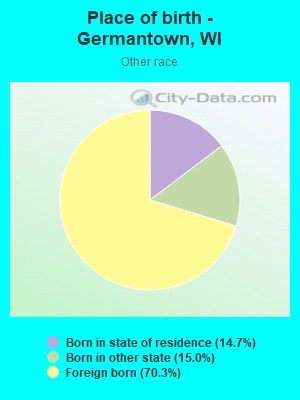
Place of birth - Born in state of residence (%) - Other Race
Place of birth - Born in other state (%)
Place of birth - Born in other state (%) - White
Place of birth - Born in other state (%) - Black or African American
Place of birth - Born in other state (%) - Asian
Place of birth - Born in other state (%) - Hispanic or Latino
Place of birth - Born in other state (%) - American Indian and Alaska Native
Place of birth - Born in other state (%) - Multirace
Place of birth - Born in other state (%) - Other Race
Place of birth - Native, outside of US (%)
Place of birth - Native, outside of US (%) - White
Place of birth - Native, outside of US (%) - Black or African American
Place of birth - Native, outside of US (%) - Asian
Place of birth - Native, outside of US (%) - Hispanic or Latino
Place of birth - Native, outside of US (%) - American Indian and Alaska Native
Place of birth - Native, outside of US (%) - Multirace
Place of birth - Native, outside of US (%) - Other Race
Place of birth - Foreign born (%)
Place of birth - Foreign born (%) - White
Place of birth - Foreign born (%) - Black or African American
Place of birth - Foreign born (%) - Asian
Place of birth - Foreign born (%) - Hispanic or Latino
Place of birth - Foreign born (%) - American Indian and Alaska Native
Place of birth - Foreign born (%) - Multirace
Place of birth - Foreign born (%) - Other Race
Residents speaking English at home (%)
Residents speaking English at home - Born in the United States (%)
Residents speaking English at home - Native, born elsewhere (%)
Residents speaking English at home - Foreign born (%)
Residents speaking Spanish at home (%)
Residents speaking Spanish at home - Born in the United States (%)
Residents speaking Spanish at home - Native, born elsewhere (%)
Residents speaking Spanish at home - Foreign born (%)
Residents speaking other language at home (%)
Residents speaking other language at home - Born in the United States (%)
Residents speaking other language at home - Native, born elsewhere (%)
Residents speaking other language at home - Foreign born (%)
Marital status - Never married (%)
Marital status - Now married (%)
Marital status - Separated (%)
Marital status - Widowed (%)
Marital status - Divorced (%)
Ancestries Reported - Arab (%)
Ancestries Reported - Czech (%)
Ancestries Reported - Danish (%)
Ancestries Reported - Dutch (%)
Ancestries Reported - English (%)
Ancestries Reported - French (%)
Ancestries Reported - French Canadian (%)
Ancestries Reported - German (%)
Ancestries Reported - Greek (%)
Ancestries Reported - Hungarian (%)
Ancestries Reported - Irish (%)
Ancestries Reported - Italian (%)
Ancestries Reported - Lithuanian (%)
Ancestries Reported - Norwegian (%)
Ancestries Reported - Polish (%)
Ancestries Reported - Portuguese (%)
Ancestries Reported - Russian (%)
Ancestries Reported - Scotch-Irish (%)
Ancestries Reported - Scottish (%)
Ancestries Reported - Slovak (%)
Ancestries Reported - Subsaharan African (%)
Ancestries Reported - Swedish (%)
Ancestries Reported - Swiss (%)
Ancestries Reported - Ukrainian (%)
Ancestries Reported - United States (%)
Ancestries Reported - Welsh (%)
Ancestries Reported - West Indian (%)
Ancestries Reported - Other (%)
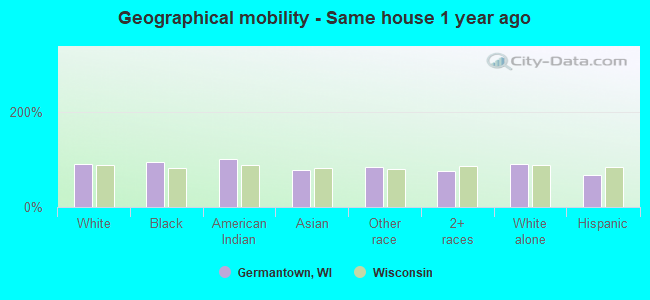
Geographical mobility - Same house 1 year ago (%)
Geographical mobility - Same house 1 year ago (%) - White
Geographical mobility - Same house 1 year ago (%) - Black or African American
Geographical mobility - Same house 1 year ago (%) - Asian
Geographical mobility - Same house 1 year ago (%) - Hispanic or Latino
Geographical mobility - Same house 1 year ago (%) - American Indian and Alaska Native
Geographical mobility - Same house 1 year ago (%) - Multirace
Geographical mobility - Same house 1 year ago (%) - Other Race
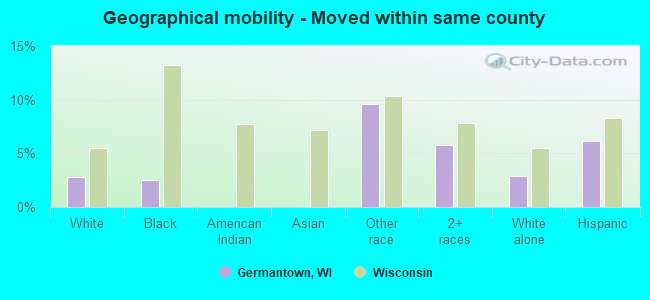
Geographical mobility - Moved within same county (%)
Geographical mobility - Moved within same county (%) - White
Geographical mobility - Moved within same county (%) - Black or African American
Geographical mobility - Moved within same county (%) - Asian
Geographical mobility - Moved within same county (%) - Hispanic or Latino
Geographical mobility - Moved within same county (%) - American Indian and Alaska Native
Geographical mobility - Moved within same county (%) - Multirace
Geographical mobility - Moved within same county (%) - Other Race
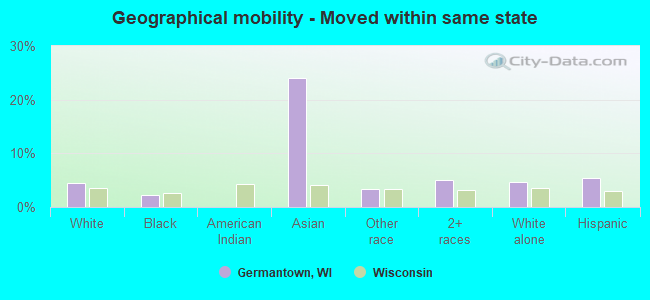
Geographical mobility - Moved from different county within same state (%)
Geographical mobility - Moved from different county within same state (%) - White
Geographical mobility - Moved from different county within same state (%) - Black or African American
Geographical mobility - Moved from different county within same state (%) - Asian
Geographical mobility - Moved from different county within same state (%) - Hispanic or Latino
Geographical mobility - Moved from different county within same state (%) - American Indian and Alaska Native
Geographical mobility - Moved from different county within same state (%) - Multirace
Geographical mobility - Moved from different county within same state (%) - Other Race
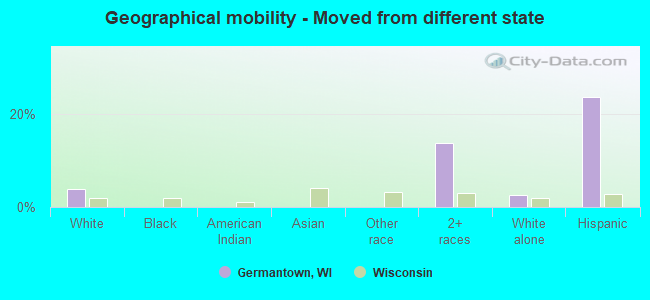
Geographical mobility - Moved from different state (%)
Geographical mobility - Moved from different state (%) - White
Geographical mobility - Moved from different state (%) - Black or African American
Geographical mobility - Moved from different state (%) - Asian
Geographical mobility - Moved from different state (%) - Hispanic or Latino
Geographical mobility - Moved from different state (%) - American Indian and Alaska Native
Geographical mobility - Moved from different state (%) - Multirace
Geographical mobility - Moved from different state (%) - Other Race
Geographical mobility - Moved from abroad (%)
Geographical mobility - Moved from abroad (%) - White
Geographical mobility - Moved from abroad (%) - Black or African American
Geographical mobility - Moved from abroad (%) - Asian
Geographical mobility - Moved from abroad (%) - Hispanic or Latino
Geographical mobility - Moved from abroad (%) - American Indian and Alaska Native
Geographical mobility - Moved from abroad (%) - Multirace
Geographical mobility - Moved from abroad (%) - Other Race
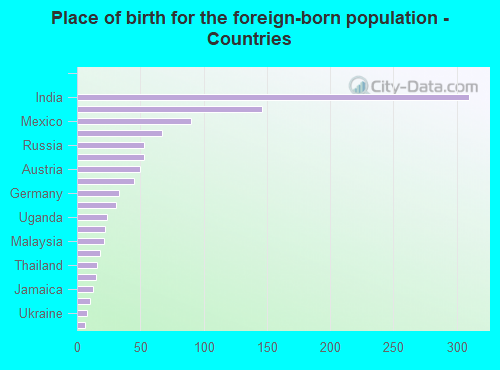
Place of birth for the foreign-born population - Ireland (%)
Place of birth for the foreign-born population - Denmark (%)
Place of birth for the foreign-born population - Norway (%)
Place of birth for the foreign-born population - Sweden (%)
Place of birth for the foreign-born population - United Kingdom (%)
Place of birth for the foreign-born population - England (%)
Place of birth for the foreign-born population - Scotland (%)
Place of birth for the foreign-born population - Other Northern Europe (%)
Place of birth for the foreign-born population - Austria (%)
Place of birth for the foreign-born population - Belgium (%)
Place of birth for the foreign-born population - France (%)
Place of birth for the foreign-born population - Germany (%)
Place of birth for the foreign-born population - Netherlands (%)
Place of birth for the foreign-born population - Switzerland (%)
Place of birth for the foreign-born population - Other Western Europe (%)
Place of birth for the foreign-born population - Greece (%)
Place of birth for the foreign-born population - Italy (%)
Place of birth for the foreign-born population - Portugal (%)
Place of birth for the foreign-born population - Spain (%)
Place of birth for the foreign-born population - Other Southern Europe (%)
Place of birth for the foreign-born population - Albania (%)
Place of birth for the foreign-born population - Belarus (%)
Place of birth for the foreign-born population - Bosnia and Herzegovina (%)
Place of birth for the foreign-born population - Bulgaria (%)
Place of birth for the foreign-born population - Croatia (%)
Place of birth for the foreign-born population - Czechoslovakia (%)
Place of birth for the foreign-born population - Hungary (%)
Place of birth for the foreign-born population - Latvia (%)
Place of birth for the foreign-born population - Lithuania (%)
Place of birth for the foreign-born population - North Macedonia (Macedonia) (%)
Place of birth for the foreign-born population - Moldova (%)
Place of birth for the foreign-born population - Poland (%)
Place of birth for the foreign-born population - Romania (%)
Place of birth for the foreign-born population - Russia (%)
Place of birth for the foreign-born population - Serbia (%)
Place of birth for the foreign-born population - Ukraine (%)
Place of birth for the foreign-born population - Other Eastern Europe (%)
Place of birth for the foreign-born population - China (%)
Place of birth for the foreign-born population - Hong Kong (%)
Place of birth for the foreign-born population - Taiwan (%)
Place of birth for the foreign-born population - Japan (%)
Place of birth for the foreign-born population - Korea (%)
Place of birth for the foreign-born population - Other Eastern Asia (%)
Place of birth for the foreign-born population - Afghanistan (%)
Place of birth for the foreign-born population - Bangladesh (%)
Place of birth for the foreign-born population - India (%)
Place of birth for the foreign-born population - Iran (%)
Place of birth for the foreign-born population - Kazakhstan (%)
Place of birth for the foreign-born population - Nepal (%)
Place of birth for the foreign-born population - Pakistan (%)
Place of birth for the foreign-born population - Sri Lanka (%)
Place of birth for the foreign-born population - Uzbekistan (%)
Place of birth for the foreign-born population - Other South Central Asia (%)
Place of birth for the foreign-born population - Burma (%)
Place of birth for the foreign-born population - Cambodia (%)
Place of birth for the foreign-born population - Indonesia (%)
Place of birth for the foreign-born population - Laos (%)
Place of birth for the foreign-born population - Malaysia (%)
Place of birth for the foreign-born population - Philippines (%)
Place of birth for the foreign-born population - Singapore (%)
Place of birth for the foreign-born population - Thailand (%)
Place of birth for the foreign-born population - Vietnam (%)
Place of birth for the foreign-born population - Other South Eastern Asia (%)
Place of birth for the foreign-born population - Armenia (%)
Place of birth for the foreign-born population - Iraq (%)
Place of birth for the foreign-born population - Israel (%)
Place of birth for the foreign-born population - Jordan (%)
Place of birth for the foreign-born population - Kuwait (%)
Place of birth for the foreign-born population - Lebanon (%)
Place of birth for the foreign-born population - Saudi Arabia (%)
Place of birth for the foreign-born population - Syria (%)
Place of birth for the foreign-born population - Turkey (%)
Place of birth for the foreign-born population - Yemen (%)
Place of birth for the foreign-born population - Other Western Asia (%)
Place of birth for the foreign-born population - Eritrea (%)
Place of birth for the foreign-born population - Ethiopia (%)
Place of birth for the foreign-born population - Kenya (%)
Place of birth for the foreign-born population - Somalia (%)
Place of birth for the foreign-born population - Uganda (%)
Place of birth for the foreign-born population - Zimbabwe (%)
Place of birth for the foreign-born population - Other Eastern Africa (%)
Place of birth for the foreign-born population - Cameroon (%)
Place of birth for the foreign-born population - Congo (%)
Place of birth for the foreign-born population - Democratic Republic of Congo (Zaire) (%)
Place of birth for the foreign-born population - Other Middle Africa (%)
Place of birth for the foreign-born population - Egypt (%)
Place of birth for the foreign-born population - Morocco (%)
Place of birth for the foreign-born population - Sudan (%)
Place of birth for the foreign-born population - Other Northern Africa (%)
Place of birth for the foreign-born population - South Africa (%)
Place of birth for the foreign-born population - Other Southern Africa (%)
Place of birth for the foreign-born population - Cabo Verde (%)
Place of birth for the foreign-born population - Ghana (%)
Place of birth for the foreign-born population - Liberia (%)
Place of birth for the foreign-born population - Nigeria (%)
Place of birth for the foreign-born population - Senegal (%)
Place of birth for the foreign-born population - Sierra Leone (%)
Place of birth for the foreign-born population - Other Western Africa (%)
Place of birth for the foreign-born population - Australia (%)
Place of birth for the foreign-born population - New Zealand (%)
Place of birth for the foreign-born population - Fiji (%)
Place of birth for the foreign-born population - Micronesia (%)
Place of birth for the foreign-born population - Bahamas (%)
Place of birth for the foreign-born population - Barbados (%)
Place of birth for the foreign-born population - Cuba (%)
Place of birth for the foreign-born population - Dominica (%)
Place of birth for the foreign-born population - Dominican Republic (%)
Place of birth for the foreign-born population - Grenada (%)
Place of birth for the foreign-born population - Haiti (%)
Place of birth for the foreign-born population - Jamaica (%)
Place of birth for the foreign-born population - St. Vincent and the Grenadines (%)
Place of birth for the foreign-born population - Trinidad and Tobago (%)
Place of birth for the foreign-born population - West Indies (%)
Place of birth for the foreign-born population - Other Caribbean (%)
Place of birth for the foreign-born population - Belize (%)
Place of birth for the foreign-born population - Costa Rica (%)
Place of birth for the foreign-born population - El Salvador (%)
Place of birth for the foreign-born population - Guatemala (%)
Place of birth for the foreign-born population - Honduras (%)
Place of birth for the foreign-born population - Mexico (%)
Place of birth for the foreign-born population - Nicaragua (%)
Place of birth for the foreign-born population - Panama (%)
Place of birth for the foreign-born population - Other Central America (%)
Place of birth for the foreign-born population - Argentina (%)
Place of birth for the foreign-born population - Bolivia (%)
Place of birth for the foreign-born population - Brazil (%)
Place of birth for the foreign-born population - Chile (%)
Place of birth for the foreign-born population - Colombia (%)
Place of birth for the foreign-born population - Ecuador (%)
Place of birth for the foreign-born population - Guyana (%)
Place of birth for the foreign-born population - Peru (%)
Place of birth for the foreign-born population - Uruguay (%)
Place of birth for the foreign-born population - Venezuela (%)
Place of birth for the foreign-born population - Other South America (%)
Place of birth for the foreign-born population - Canada (%)
Place of birth for the foreign-born population - Other Northern America (%)
Place of birth for the foreign-born population - Other (%)
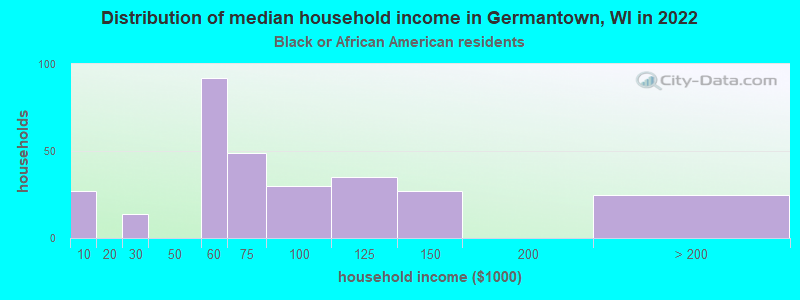
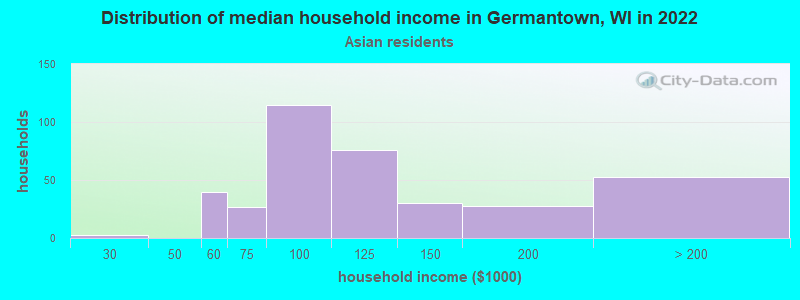
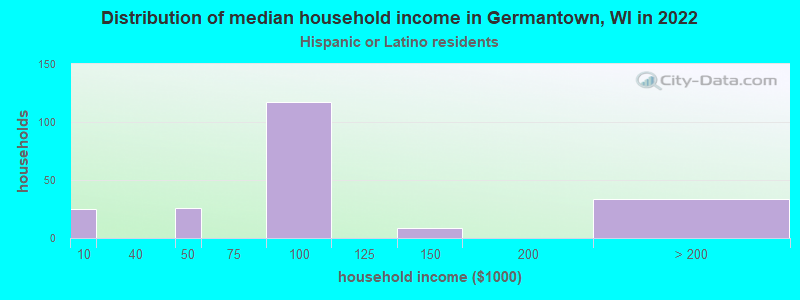
According to 2022 data, the most numerous races in Germantown, WI are White alone (17,677 residents), Hispanic (756 residents), and Black alone (356 residents). 92.7% of Germantown residents speak English at home. 5.3% of Germantown, WI residents are foreign-born (3.4% born in Asia, 1.0% born in Europe, 0.8% born in Latin America), which is 5.4% greater than the foreign-born rate of 5.0% across the entire state of Wisconsin.
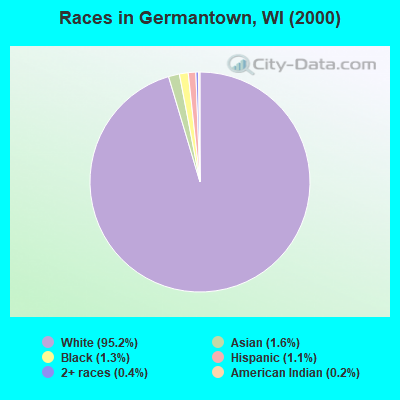
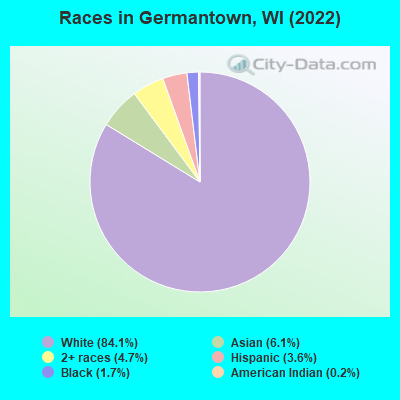
Race distribution in Germantown
2000 2022
4,681,630 87.3% White alone 300,245 5.6% Black alone 192,921 3.6% Hispanic 87,995 1.6% Asian alone 51,921 1.0% Two or more races 43,980 0.8% American Indian alone 3,637 0.07% Other race alone 1,346 0.03% Native Hawaiian and Other
4,654,031 79.0% White alone 447,022 7.6% Hispanic 345,678 5.9% Black alone 217,532 3.7% Two or more races 172,242 2.9% Asian alone 33,762 0.6% American Indian alone 19,680 0.3% Other race alone 2,592 0.04% Native Hawaiian and Other
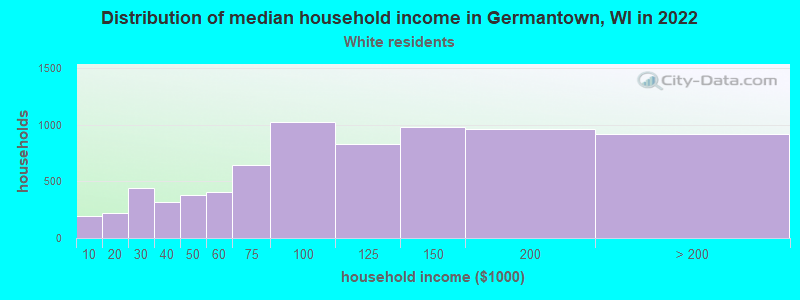
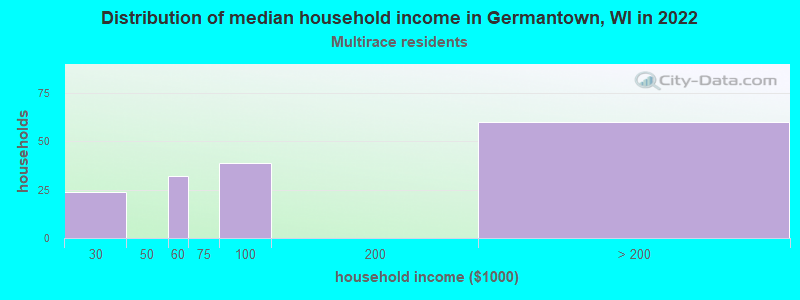
Income and house value in Germantown Median household income in 2022 $104,016 White non-Hispanic householders$73,516 Black householders$109,141 Asian householders$114,226 Hispanic or Latino race householdersMedian 2022 house value $372,415 White Non-Hispanic householders$322,249 Black or African American householders$246,451 American Indian or Alaska Native householders $416,229 Asian householders$250,833 Some other race householders$388,846 Two or more races householders$253,900 Hispanic or Latino householders
Median age by race in Germantown
43.2 Median age for White residents41.0 48.2 73.2 Median age for Black or African American residents98.1 59.7 47.7 Median age for American Indian / Alaska Native residents-270,833,333.1 55.3 43.1 Median age for Asian residents60.6 39.2 -825,688,072.6 Median age for Native Hawaiian / Pacific Islander residents-862,745,097.2 -666,666,666.0 31.1 Median age for Other race residents39.4 11.5 22.1 Median age for Two or more races residents19.9 29.8 43.3 Median age for White alone residents41.2 48.1 34.5 Median age for Hispanic or Latino residents32.4 23.2
Owner/renter occupied households by race in Germantown
House owners and renters - White residents 6,087 81.7% Owner occupied1,360 18.3% Renter occupiedHouse owners and renters - Black or African American residents 76 26.0% Owner occupied217 74.0% Renter occupiedHouse owners and renters - American Indian / Alaska Native residents 10 100.0% Owner occupiedHouse owners and renters - Asian residents 339 83.3% Owner occupied68 16.7% Renter occupiedHouse owners and renters - Other race residents 19 100.0% Renter occupiedHouse owners and renters - Two or more races residents 153 78.6% Owner occupied42 21.4% Renter occupiedHouse owners and renters - White alone residents 5,939 81.7% Owner occupied1,333 18.3% Renter occupiedHouse owners and renters - Hispanic or Latino residents 262 89.4% Owner occupied31 10.6% Renter occupied
Language usage in Germantown
English speakers - Total 92.7% of residents of Germantown speak English at home.
1.4% of residents speak Spanish at home 255 88.9% Speak English very well32 11.1% Speak English less than very well5.9% of residents speak other language at home 739 62.8% Speak English very well437 37.2% Speak English less than very well
English speakers - Born in the United States 94.7% of residents of Germantown speak English at home.
0.9% of residents speak Spanish at home 32 100.0% Speak English less than very well4.5% of residents speak other language at home 133 85.8% Speak English very well22 14.2% Speak English less than very well
English speakers - Native, born elsewhere 68.3% of residents of Germantown speak English at home.
35.3% of residents speak Spanish at home 77 100.0% Speak English very well
English speakers - Foreign-born 22.8% of residents of Germantown speak English at home.
1.7% of residents speak Spanish at home 19 100.0% Speak English very well75.5% of residents speak other language at home 436 52.4% Speak English very well396 47.6% Speak English less than very well
White (Caucasian) - Speak only English Native:
97.6% (16,492)Foreign-born:
19.5% (59)
White (Caucasian) - Speak another language Native:
2.3% (393)Foreign-born:
86.1% (259)
Black or African American - Speak only English Native:
100.0% (424)Foreign-born:
76.6% (13)
Asian - Speak only English Native:
54.7% (221)Foreign-born:
11.9% (94)
Asian - Speak another language Native:
45.0% (182)Foreign-born:
86.7% (683)
Other race - Speak only English Native:
57.5% (20)Foreign-born:
98.0% (99)
Other race - Speak another language Native:
41.5% (15)Foreign-born:
13.0% (13)
Two or more races - Speak only English Native:
90.9% (948)Foreign-born:
57.8% (33)
Two or more races - Speak another language Native:
2.3% (24)Foreign-born:
22.6% (13)
White alone - Speak only English Native:
97.8% (16,092)Foreign-born:
19.4% (60)
White alone - Speak another language Native:
2.2% (355)Foreign-born:
86.5% (266)
Hispanic or Latino - Speak only English Native:
82.0% (457)Foreign-born:
74.2% (111)
Hispanic or Latino - Speak another language Native:
19.7% (110)Foreign-born:
15.3% (23)
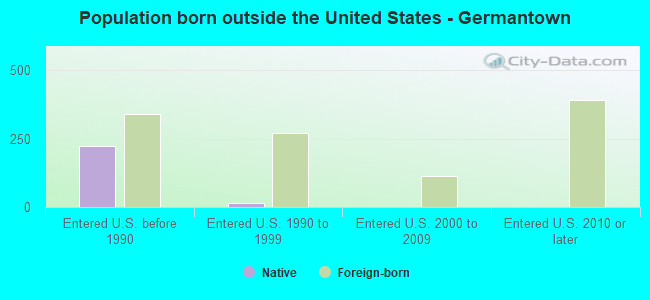
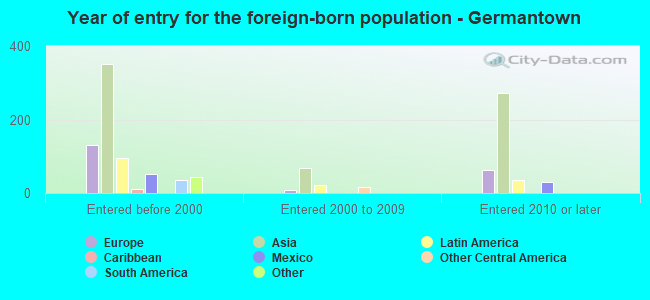
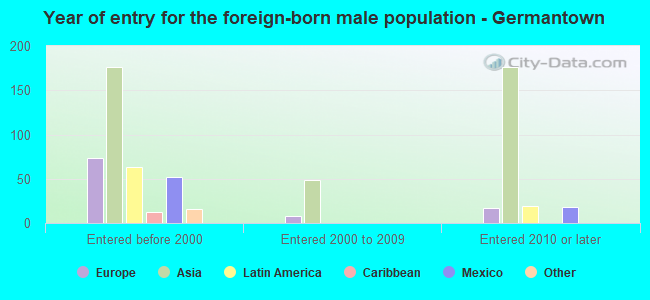
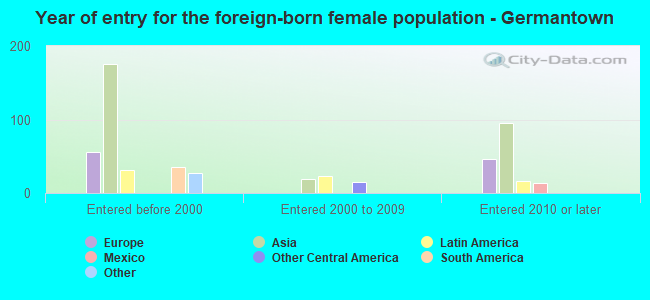
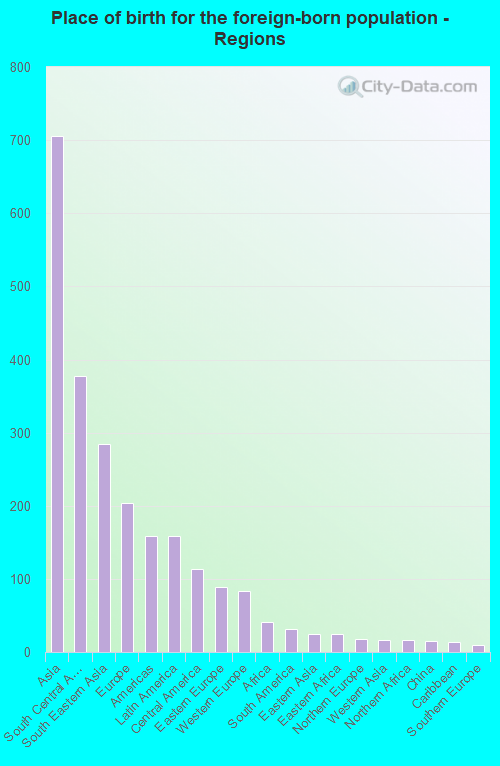
Foreign-born residents in Germantown 1,111 residents are foreign born (3.4% Asia , 1.0% Europe , 0.8% Latin America ).
This city:
5.3%Wisconsin:
5.0%
Marital status for residents in Germantown Marital status - White (Caucasian) population 15 years and over
Males 31.1% Never married60.7% Now married0.3% Separated2.1% Widowed5.9% DivorcedFemales 20.8% Never married59.2% Now married0.2% Separated8.4% Widowed11.5% DivorcedWomen who gave birth in the past 12 months Now married:
78.0% (203)Unmarried:
22.0% (57)
Women who did not give birth in the past 12 months Now married:
51.6% (1,653)Unmarried:
48.4% (1,551)
Marital status - Black or African American population 15 years and over
Males 34.1% Never married54.8% Now married0.0% Separated2.3% Widowed8.8% DivorcedFemales 37.3% Never married36.8% Now married0.0% Separated7.7% Widowed18.2% DivorcedWomen who did not give birth in the past 12 months Now married:
29.3% (28)Unmarried:
70.7% (68)
Marital status - American Indian / Alaska Native population 15 years and over
Males 59.1% Never married40.9% Now married0.0% Separated0.0% Widowed0.0% DivorcedFemales 9.1% Never married90.9% Now married0.0% Separated0.0% Widowed0.0% DivorcedWomen who did not give birth in the past 12 months Now married:
50.0% (2)Unmarried:
50.0% (2)
Marital status - Asian population 15 years and over
Males 29.7% Never married70.3% Now married0.0% Separated0.0% Widowed0.0% DivorcedFemales 23.3% Never married62.1% Now married0.6% Separated8.6% Widowed5.4% DivorcedWomen who gave birth in the past 12 months Now married:
100.0% (6)Unmarried:
0.0% (0)
Women who did not give birth in the past 12 months Now married:
68.4% (249)Unmarried:
31.6% (115)
Marital status - Other race population 15 years and over
Males 81.1% Never married14.2% Now married0.0% Separated4.7% Widowed0.0% DivorcedFemales 100.0% Never married0.0% Now married0.0% Separated0.0% Widowed0.0% DivorcedWomen who did not give birth in the past 12 months Now married:
0.0% (0)Unmarried:
100.0% (22)
Marital status - Two or more races population 15 years and over
Males 72.6% Never married27.0% Now married0.0% Separated0.0% Widowed0.5% DivorcedFemales 51.4% Never married43.1% Now married0.0% Separated0.0% Widowed5.5% DivorcedWomen who did not give birth in the past 12 months Now married:
38.8% (155)Unmarried:
61.2% (244)
Marital status - White alone, not Hispanic / Latino population 15 years and over
Males 30.6% Never married60.9% Now married0.3% Separated2.1% Widowed6.1% DivorcedFemales 20.9% Never married58.9% Now married0.2% Separated8.4% Widowed11.6% DivorcedWomen who gave birth in the past 12 months Now married:
78.0% (202)Unmarried:
22.0% (57)
Women who did not give birth in the past 12 months Now married:
51.6% (1,640)Unmarried:
48.4% (1,536)
Marital status - Hispanic or Latino population 15 years and over
Males 57.0% Never married41.5% Now married0.0% Separated1.2% Widowed0.2% DivorcedFemales 41.7% Never married58.3% Now married0.0% Separated0.0% Widowed0.0% DivorcedWomen who did not give birth in the past 12 months Now married:
29.2% (36)Unmarried:
70.8% (89)
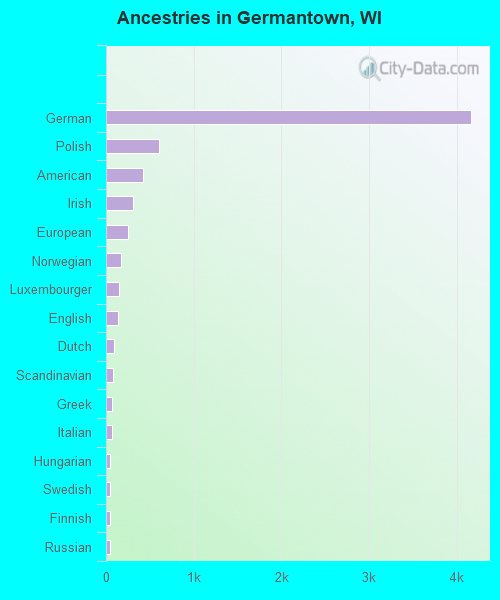
Ancestries in Germantown
4,162 46.2% German609 6.8% Polish423 4.7% American312 3.5% Irish250 2.8% European166 1.8% Norwegian149 1.7% Luxembourger141 1.6% English96 1.1% Dutch84 0.9% Scandinavian74 0.8% Greek73 0.8% Italian50 0.6% Hungarian48 0.5% Swedish40 0.4% Finnish40 0.4% Russian29 0.3% Austrian28 0.3% Czechoslovakian26 0.3% African23 0.3% Ukrainian21 0.2% Swiss19 0.2% Belgian16 0.2% Jamaican14 0.2% Yugoslavian11 0.1% Danish11 0.1% Slovak10 0.1% Cypriot10 0.1% Scottish8 0.09% French8 0.09% Scotch-Irish6 0.07% Slovene5 0.06% Serbian
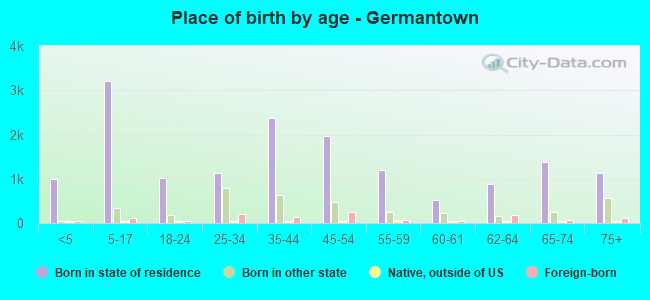
Children Nativity (place of birth) in Germantown
Children under 6 years - Living with two parents Both parents native 1,018 100.0% NativeBoth parents foreign-born 39 57.4% Native29 42.6% Foreign-bornOne native, one foreign-born parent 34 100.0% NativeChildren under 6 years - Living with one parent Native parent 167 100.0% NativeChildren 6 to 17 years - Living with two parents Both parents native 2,550 99.1% Native22 0.9% Foreign-bornBoth parents foreign-born 127 80.1% Native32 19.9% Foreign-bornOne native, one foreign-born parent 34 100.0% NativeChildren 6 to 17 years - Living with one parent Native parent 702 100.0% NativeForeign-born parent 4 48.4% Native4 51.6% Foreign-born
Grandparents responsible for own grandchildren in Germantown
Grandparents (30 to 59 years) White / Caucasian 70 69.4% Responsible for grandchildren31 30.6% Not responsible for grandchildrenWhite alone, not Hispanic / Latino 72 69.5% Responsible for grandchildren32 30.5% Not responsible for grandchildrenGrandparents (60 years and over) White / Caucasian 26 49.5% Responsible for grandchildren27 50.5% Not responsible for grandchildrenWhite alone, not Hispanic / Latino 27 48.8% Responsible for grandchildren28 51.2% Not responsible for grandchildren