Races in Genoa-Jacks Valley, Nevada (NV) Detailed Stats
Ancestries, Foreign-born residents, place of birth
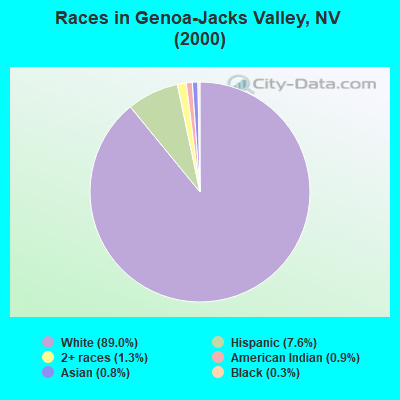
Race distribution in Genoa-Jacks Valley

- 5,90189.0%White alone
- 5027.6%Hispanic
- 881.3%Two or more races
- 590.9%American Indian alone
- 520.8%Asian alone
- 200.3%Black alone
- 50.08%Other race alone
- 40.06%Native Hawaiian and Other
Pacific Islander alone
2000
2022
-
- 1,303,00165.2%White alone
- 393,97019.7%Hispanic
- 131,5096.6%Black alone
- 88,5934.4%Asian alone
- 49,2312.5%Two or more races
- 21,3971.1%American Indian alone
- 7,7690.4%Native Hawaiian and Other
Pacific Islander alone - 2,7870.1%Other race alone

-
- 1,410,14544.4%White alone
- 961,35730.3%Hispanic
- 286,4719.0%Black alone
- 281,1498.8%Asian alone
- 182,1515.7%Two or more races
- 20,1020.6%Native Hawaiian and Other
Pacific Islander alone - 18,7810.6%Other race alone
- 17,6160.6%American Indian alone

Income and house value in Genoa-Jacks Valley
- Median household income in 2022
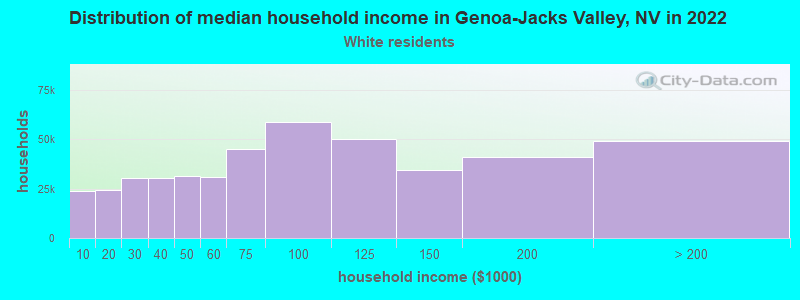
- $103,152White non-Hispanic householders
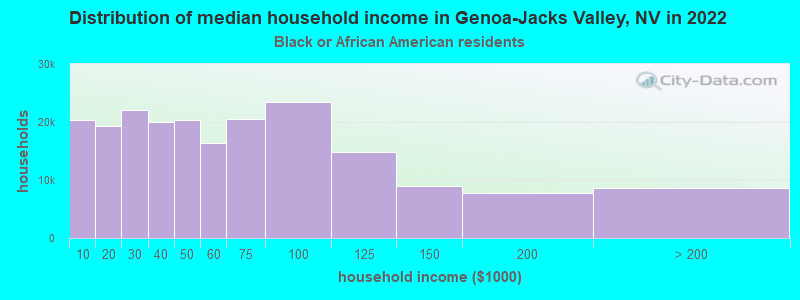
- $66,838Black householders
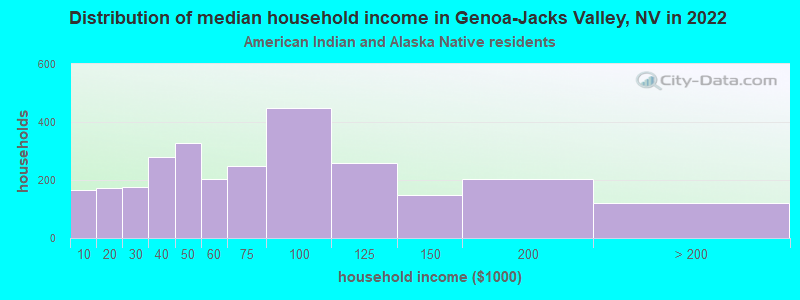
- $22,293American Indian and Alaska Native householders
- $91,030Some other race householders
- $114,799Two or more races householders
- $94,525Hispanic or Latino race householders
- Median 2022 house value
- $656,894White Non-Hispanic householders
- $795,486Black or African American householders
- $114,903American Indian or Alaska Native householders
- $397,743Native Hawaiian and other Pacific Islander householders
- $461,735Some other race householders
- $420,723Two or more races householders
- $489,312Hispanic or Latino householders
Household income for White non-Hispanic householders
Household income for Black householders
Household income for American Indian and Alaska Native householders
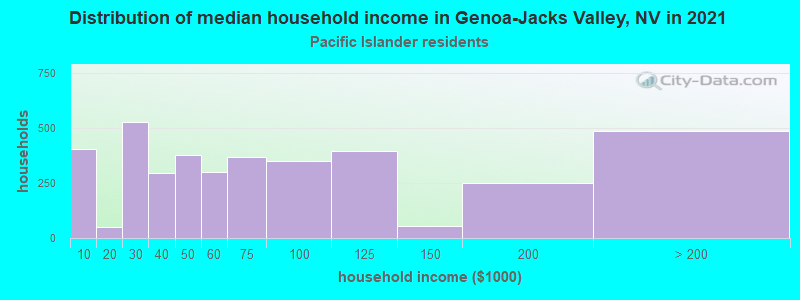
Household income for Native Hawaiian and other Pacific Islander householders
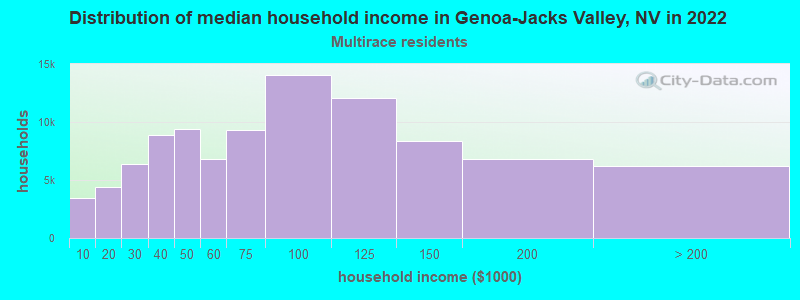
Household income for Two or more races householders
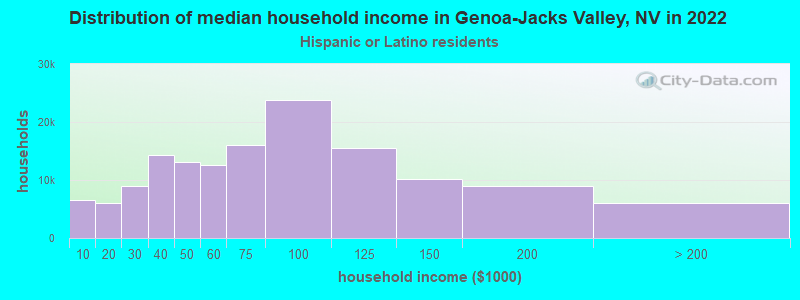
Household income for Hispanic or Latino race householders
Zip code: 89423