Races in Garner, North Carolina (NC) Detailed Stats
Data:
Races - White alone (%)
Races - White alone (% change since 2000)
Races - Black alone (%)
Races - Black alone (% change since 2000)
Races - American Indian alone (%)
Races - American Indian alone (% change since 2000)
Races - Asian alone (%)
Races - Asian alone (% change since 2000)
Races - Hispanic (%)
Races - Hispanic (% change since 2000)
Races - Native Hawaiian and Other Pacific Islander alone (%)
Races - Native Hawaiian and Other Pacific Islander alone (% change since 2000)
Races - Two or more races(%)
Races - Two or more races(% change since 2000)
Races - Other race alone (%)
Races - Other race alone (% change since 2000)
Racial diversity
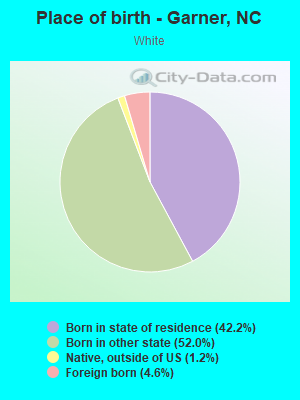
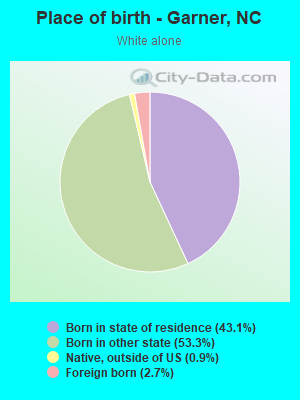
Place of birth - Born in state of residence (%)
Place of birth - Born in state of residence (%) - White
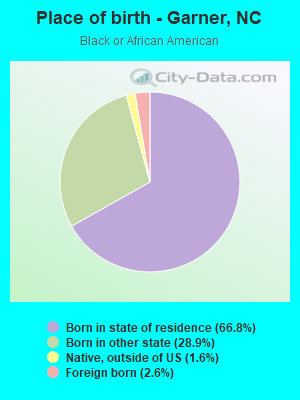
Place of birth - Born in state of residence (%) - Black or African American
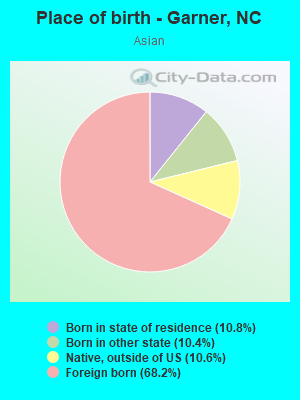
Place of birth - Born in state of residence (%) - Asian
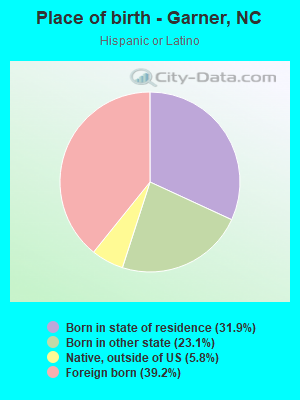
Place of birth - Born in state of residence (%) - Hispanic or Latino
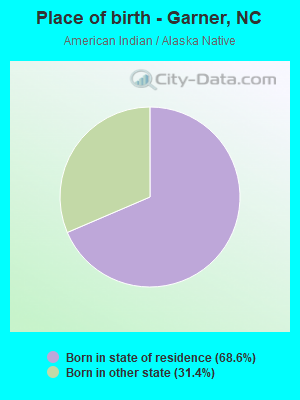
Place of birth - Born in state of residence (%) - American Indian and Alaska Native
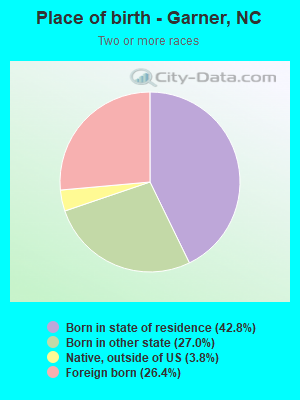
Place of birth - Born in state of residence (%) - Multirace
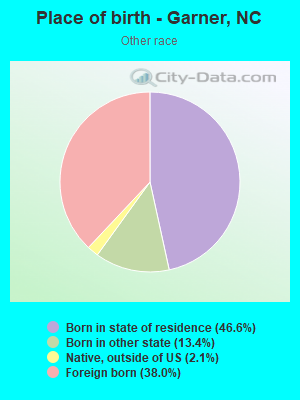
Place of birth - Born in state of residence (%) - Other Race
Place of birth - Born in other state (%)
Place of birth - Born in other state (%) - White
Place of birth - Born in other state (%) - Black or African American
Place of birth - Born in other state (%) - Asian
Place of birth - Born in other state (%) - Hispanic or Latino
Place of birth - Born in other state (%) - American Indian and Alaska Native
Place of birth - Born in other state (%) - Multirace
Place of birth - Born in other state (%) - Other Race
Place of birth - Native, outside of US (%)
Place of birth - Native, outside of US (%) - White
Place of birth - Native, outside of US (%) - Black or African American
Place of birth - Native, outside of US (%) - Asian
Place of birth - Native, outside of US (%) - Hispanic or Latino
Place of birth - Native, outside of US (%) - American Indian and Alaska Native
Place of birth - Native, outside of US (%) - Multirace
Place of birth - Native, outside of US (%) - Other Race
Place of birth - Foreign born (%)
Place of birth - Foreign born (%) - White
Place of birth - Foreign born (%) - Black or African American
Place of birth - Foreign born (%) - Asian
Place of birth - Foreign born (%) - Hispanic or Latino
Place of birth - Foreign born (%) - American Indian and Alaska Native
Place of birth - Foreign born (%) - Multirace
Place of birth - Foreign born (%) - Other Race
Residents speaking English at home (%)
Residents speaking English at home - Born in the United States (%)
Residents speaking English at home - Native, born elsewhere (%)
Residents speaking English at home - Foreign born (%)
Residents speaking Spanish at home (%)
Residents speaking Spanish at home - Born in the United States (%)
Residents speaking Spanish at home - Native, born elsewhere (%)
Residents speaking Spanish at home - Foreign born (%)
Residents speaking other language at home (%)
Residents speaking other language at home - Born in the United States (%)
Residents speaking other language at home - Native, born elsewhere (%)
Residents speaking other language at home - Foreign born (%)
Marital status - Never married (%)
Marital status - Now married (%)
Marital status - Separated (%)
Marital status - Widowed (%)
Marital status - Divorced (%)
Ancestries Reported - Arab (%)
Ancestries Reported - Czech (%)
Ancestries Reported - Danish (%)
Ancestries Reported - Dutch (%)
Ancestries Reported - English (%)
Ancestries Reported - French (%)
Ancestries Reported - French Canadian (%)
Ancestries Reported - German (%)
Ancestries Reported - Greek (%)
Ancestries Reported - Hungarian (%)
Ancestries Reported - Irish (%)
Ancestries Reported - Italian (%)
Ancestries Reported - Lithuanian (%)
Ancestries Reported - Norwegian (%)
Ancestries Reported - Polish (%)
Ancestries Reported - Portuguese (%)
Ancestries Reported - Russian (%)
Ancestries Reported - Scotch-Irish (%)
Ancestries Reported - Scottish (%)
Ancestries Reported - Slovak (%)
Ancestries Reported - Subsaharan African (%)
Ancestries Reported - Swedish (%)
Ancestries Reported - Swiss (%)
Ancestries Reported - Ukrainian (%)
Ancestries Reported - United States (%)
Ancestries Reported - Welsh (%)
Ancestries Reported - West Indian (%)
Ancestries Reported - Other (%)
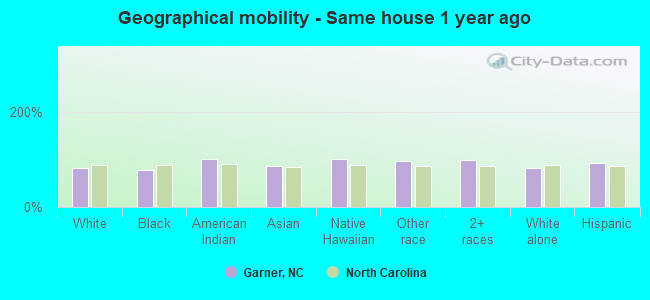
Geographical mobility - Same house 1 year ago (%)
Geographical mobility - Same house 1 year ago (%) - White
Geographical mobility - Same house 1 year ago (%) - Black or African American
Geographical mobility - Same house 1 year ago (%) - Asian
Geographical mobility - Same house 1 year ago (%) - Hispanic or Latino
Geographical mobility - Same house 1 year ago (%) - American Indian and Alaska Native
Geographical mobility - Same house 1 year ago (%) - Multirace
Geographical mobility - Same house 1 year ago (%) - Other Race
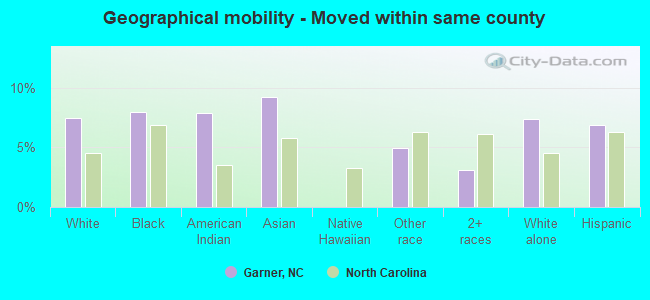
Geographical mobility - Moved within same county (%)
Geographical mobility - Moved within same county (%) - White
Geographical mobility - Moved within same county (%) - Black or African American
Geographical mobility - Moved within same county (%) - Asian
Geographical mobility - Moved within same county (%) - Hispanic or Latino
Geographical mobility - Moved within same county (%) - American Indian and Alaska Native
Geographical mobility - Moved within same county (%) - Multirace
Geographical mobility - Moved within same county (%) - Other Race
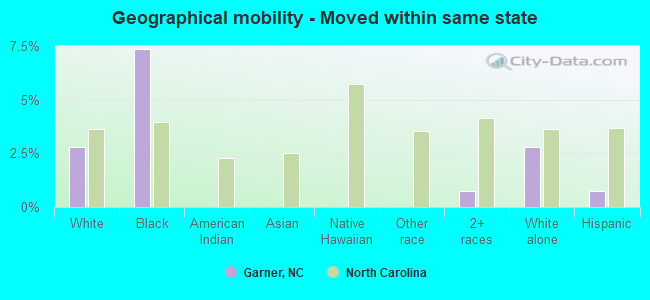
Geographical mobility - Moved from different county within same state (%)
Geographical mobility - Moved from different county within same state (%) - White
Geographical mobility - Moved from different county within same state (%) - Black or African American
Geographical mobility - Moved from different county within same state (%) - Asian
Geographical mobility - Moved from different county within same state (%) - Hispanic or Latino
Geographical mobility - Moved from different county within same state (%) - American Indian and Alaska Native
Geographical mobility - Moved from different county within same state (%) - Multirace
Geographical mobility - Moved from different county within same state (%) - Other Race
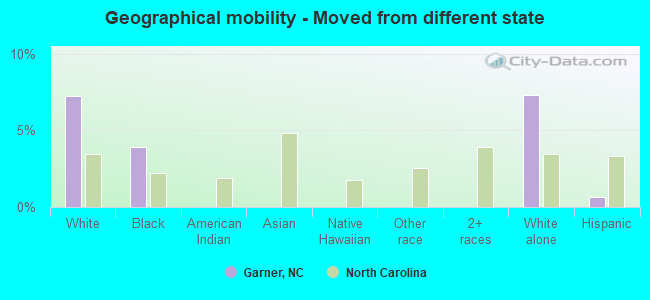
Geographical mobility - Moved from different state (%)
Geographical mobility - Moved from different state (%) - White
Geographical mobility - Moved from different state (%) - Black or African American
Geographical mobility - Moved from different state (%) - Asian
Geographical mobility - Moved from different state (%) - Hispanic or Latino
Geographical mobility - Moved from different state (%) - American Indian and Alaska Native
Geographical mobility - Moved from different state (%) - Multirace
Geographical mobility - Moved from different state (%) - Other Race
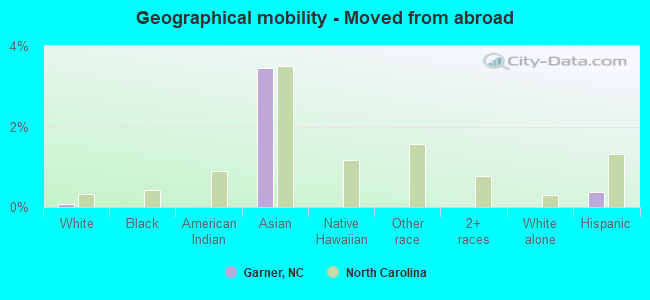
Geographical mobility - Moved from abroad (%)
Geographical mobility - Moved from abroad (%) - White
Geographical mobility - Moved from abroad (%) - Black or African American
Geographical mobility - Moved from abroad (%) - Asian
Geographical mobility - Moved from abroad (%) - Hispanic or Latino
Geographical mobility - Moved from abroad (%) - American Indian and Alaska Native
Geographical mobility - Moved from abroad (%) - Multirace
Geographical mobility - Moved from abroad (%) - Other Race
Place of birth for the foreign-born population - Ireland (%)
Place of birth for the foreign-born population - Denmark (%)
Place of birth for the foreign-born population - Norway (%)
Place of birth for the foreign-born population - Sweden (%)
Place of birth for the foreign-born population - United Kingdom (%)
Place of birth for the foreign-born population - England (%)
Place of birth for the foreign-born population - Scotland (%)
Place of birth for the foreign-born population - Other Northern Europe (%)
Place of birth for the foreign-born population - Austria (%)
Place of birth for the foreign-born population - Belgium (%)
Place of birth for the foreign-born population - France (%)
Place of birth for the foreign-born population - Germany (%)
Place of birth for the foreign-born population - Netherlands (%)
Place of birth for the foreign-born population - Switzerland (%)
Place of birth for the foreign-born population - Other Western Europe (%)
Place of birth for the foreign-born population - Greece (%)
Place of birth for the foreign-born population - Italy (%)
Place of birth for the foreign-born population - Portugal (%)
Place of birth for the foreign-born population - Spain (%)
Place of birth for the foreign-born population - Other Southern Europe (%)
Place of birth for the foreign-born population - Albania (%)
Place of birth for the foreign-born population - Belarus (%)
Place of birth for the foreign-born population - Bosnia and Herzegovina (%)
Place of birth for the foreign-born population - Bulgaria (%)
Place of birth for the foreign-born population - Croatia (%)
Place of birth for the foreign-born population - Czechoslovakia (%)
Place of birth for the foreign-born population - Hungary (%)
Place of birth for the foreign-born population - Latvia (%)
Place of birth for the foreign-born population - Lithuania (%)
Place of birth for the foreign-born population - North Macedonia (Macedonia) (%)
Place of birth for the foreign-born population - Moldova (%)
Place of birth for the foreign-born population - Poland (%)
Place of birth for the foreign-born population - Romania (%)
Place of birth for the foreign-born population - Russia (%)
Place of birth for the foreign-born population - Serbia (%)
Place of birth for the foreign-born population - Ukraine (%)
Place of birth for the foreign-born population - Other Eastern Europe (%)
Place of birth for the foreign-born population - China (%)
Place of birth for the foreign-born population - Hong Kong (%)
Place of birth for the foreign-born population - Taiwan (%)
Place of birth for the foreign-born population - Japan (%)
Place of birth for the foreign-born population - Korea (%)
Place of birth for the foreign-born population - Other Eastern Asia (%)
Place of birth for the foreign-born population - Afghanistan (%)
Place of birth for the foreign-born population - Bangladesh (%)
Place of birth for the foreign-born population - India (%)
Place of birth for the foreign-born population - Iran (%)
Place of birth for the foreign-born population - Kazakhstan (%)
Place of birth for the foreign-born population - Nepal (%)
Place of birth for the foreign-born population - Pakistan (%)
Place of birth for the foreign-born population - Sri Lanka (%)
Place of birth for the foreign-born population - Uzbekistan (%)
Place of birth for the foreign-born population - Other South Central Asia (%)
Place of birth for the foreign-born population - Burma (%)
Place of birth for the foreign-born population - Cambodia (%)
Place of birth for the foreign-born population - Indonesia (%)
Place of birth for the foreign-born population - Laos (%)
Place of birth for the foreign-born population - Malaysia (%)
Place of birth for the foreign-born population - Philippines (%)
Place of birth for the foreign-born population - Singapore (%)
Place of birth for the foreign-born population - Thailand (%)
Place of birth for the foreign-born population - Vietnam (%)
Place of birth for the foreign-born population - Other South Eastern Asia (%)
Place of birth for the foreign-born population - Armenia (%)
Place of birth for the foreign-born population - Iraq (%)
Place of birth for the foreign-born population - Israel (%)
Place of birth for the foreign-born population - Jordan (%)
Place of birth for the foreign-born population - Kuwait (%)
Place of birth for the foreign-born population - Lebanon (%)
Place of birth for the foreign-born population - Saudi Arabia (%)
Place of birth for the foreign-born population - Syria (%)
Place of birth for the foreign-born population - Turkey (%)
Place of birth for the foreign-born population - Yemen (%)
Place of birth for the foreign-born population - Other Western Asia (%)
Place of birth for the foreign-born population - Eritrea (%)
Place of birth for the foreign-born population - Ethiopia (%)
Place of birth for the foreign-born population - Kenya (%)
Place of birth for the foreign-born population - Somalia (%)
Place of birth for the foreign-born population - Uganda (%)
Place of birth for the foreign-born population - Zimbabwe (%)
Place of birth for the foreign-born population - Other Eastern Africa (%)
Place of birth for the foreign-born population - Cameroon (%)
Place of birth for the foreign-born population - Congo (%)
Place of birth for the foreign-born population - Democratic Republic of Congo (Zaire) (%)
Place of birth for the foreign-born population - Other Middle Africa (%)
Place of birth for the foreign-born population - Egypt (%)
Place of birth for the foreign-born population - Morocco (%)
Place of birth for the foreign-born population - Sudan (%)
Place of birth for the foreign-born population - Other Northern Africa (%)
Place of birth for the foreign-born population - South Africa (%)
Place of birth for the foreign-born population - Other Southern Africa (%)
Place of birth for the foreign-born population - Cabo Verde (%)
Place of birth for the foreign-born population - Ghana (%)
Place of birth for the foreign-born population - Liberia (%)
Place of birth for the foreign-born population - Nigeria (%)
Place of birth for the foreign-born population - Senegal (%)
Place of birth for the foreign-born population - Sierra Leone (%)
Place of birth for the foreign-born population - Other Western Africa (%)
Place of birth for the foreign-born population - Australia (%)
Place of birth for the foreign-born population - New Zealand (%)
Place of birth for the foreign-born population - Fiji (%)
Place of birth for the foreign-born population - Micronesia (%)
Place of birth for the foreign-born population - Bahamas (%)
Place of birth for the foreign-born population - Barbados (%)
Place of birth for the foreign-born population - Cuba (%)
Place of birth for the foreign-born population - Dominica (%)
Place of birth for the foreign-born population - Dominican Republic (%)
Place of birth for the foreign-born population - Grenada (%)
Place of birth for the foreign-born population - Haiti (%)
Place of birth for the foreign-born population - Jamaica (%)
Place of birth for the foreign-born population - St. Vincent and the Grenadines (%)
Place of birth for the foreign-born population - Trinidad and Tobago (%)
Place of birth for the foreign-born population - West Indies (%)
Place of birth for the foreign-born population - Other Caribbean (%)
Place of birth for the foreign-born population - Belize (%)
Place of birth for the foreign-born population - Costa Rica (%)
Place of birth for the foreign-born population - El Salvador (%)
Place of birth for the foreign-born population - Guatemala (%)
Place of birth for the foreign-born population - Honduras (%)
Place of birth for the foreign-born population - Mexico (%)
Place of birth for the foreign-born population - Nicaragua (%)
Place of birth for the foreign-born population - Panama (%)
Place of birth for the foreign-born population - Other Central America (%)
Place of birth for the foreign-born population - Argentina (%)
Place of birth for the foreign-born population - Bolivia (%)
Place of birth for the foreign-born population - Brazil (%)
Place of birth for the foreign-born population - Chile (%)
Place of birth for the foreign-born population - Colombia (%)
Place of birth for the foreign-born population - Ecuador (%)
Place of birth for the foreign-born population - Guyana (%)
Place of birth for the foreign-born population - Peru (%)
Place of birth for the foreign-born population - Uruguay (%)
Place of birth for the foreign-born population - Venezuela (%)
Place of birth for the foreign-born population - Other South America (%)
Place of birth for the foreign-born population - Canada (%)
Place of birth for the foreign-born population - Other Northern America (%)
Place of birth for the foreign-born population - Other (%)
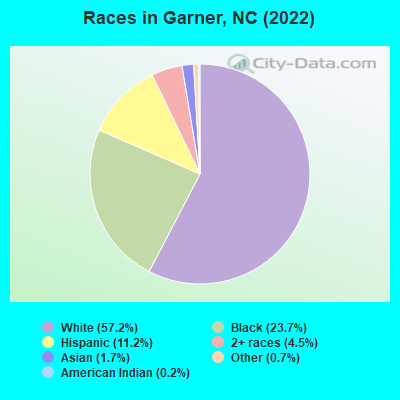
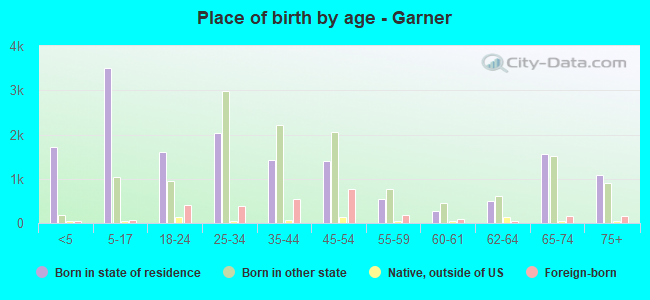
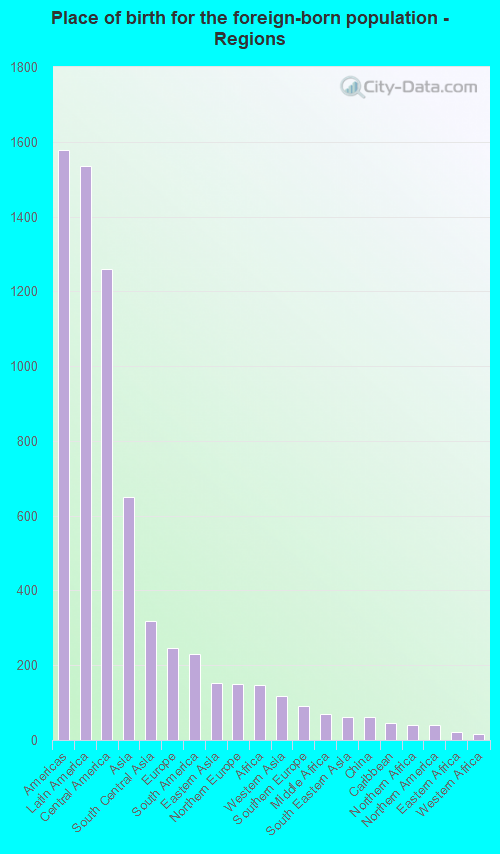
According to 2022 data, the most numerous races in Garner, NC are White alone (18,818 residents), Black alone (7,799 residents), and Hispanic (3,697 residents). 86.1% of Garner residents speak English at home. 8.0% of Garner, NC residents are foreign-born (4.6% born in Latin America, 1.9% born in Asia), which is about the same as the foreign-born rate of 8.0% across the entire state of North Carolina.
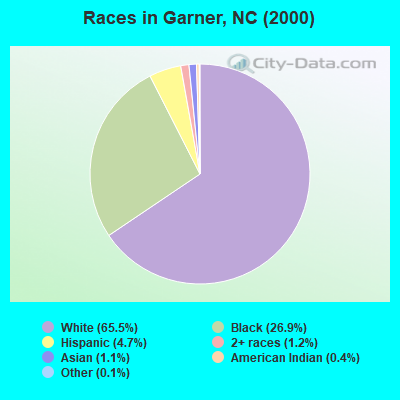
Race distribution in Garner
2000 2022
5,647,155 70.2% White alone 1,723,301 21.4% Black alone 378,963 4.7% Hispanic 112,416 1.4% Asian alone 95,333 1.2% American Indian alone 79,965 1.0% Two or more races 9,015 0.1% Other race alone 3,165 0.04% Native Hawaiian and Other
6,497,519 60.7% White alone 2,155,650 20.1% Black alone 1,114,799 10.4% Hispanic 438,061 4.1% Two or more races 341,052 3.2% Asian alone 91,758 0.9% American Indian alone 50,180 0.5% Other race alone 9,954 0.09% Native Hawaiian and Other
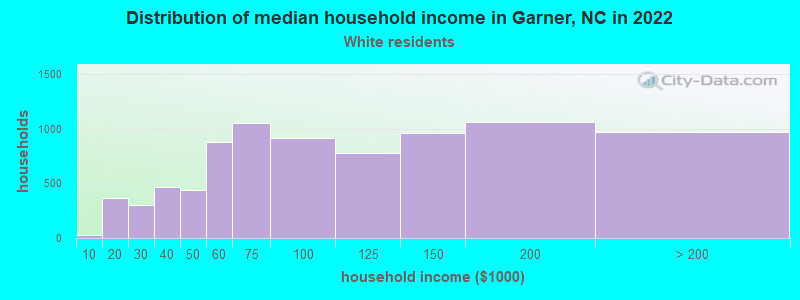
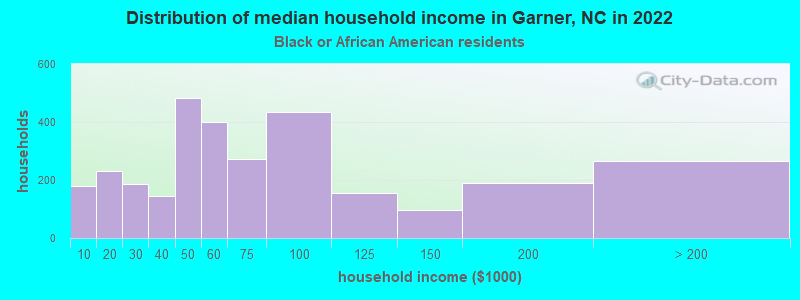
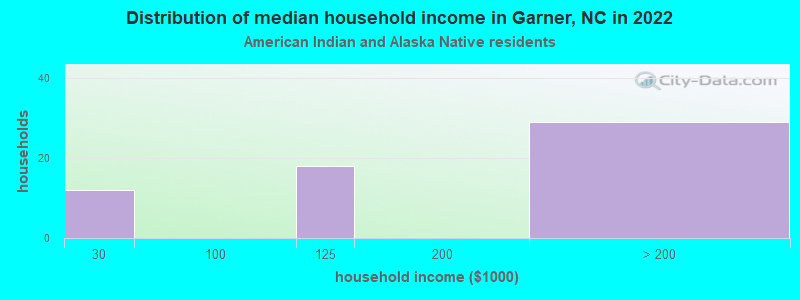
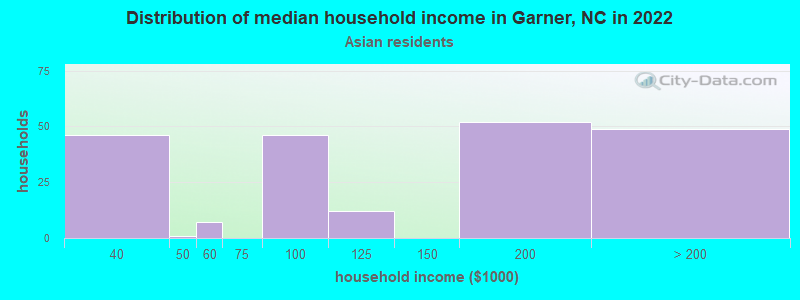
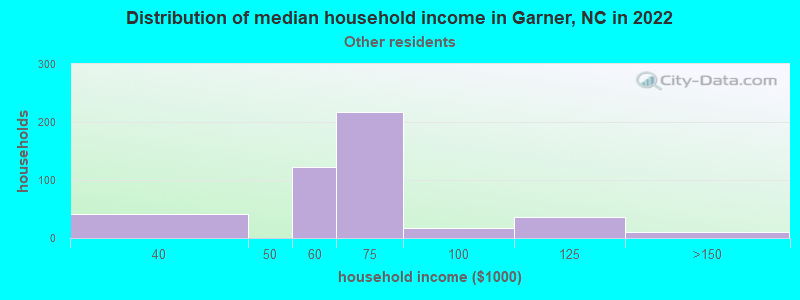
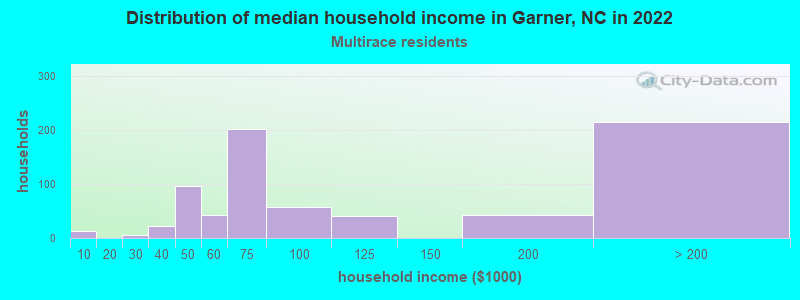
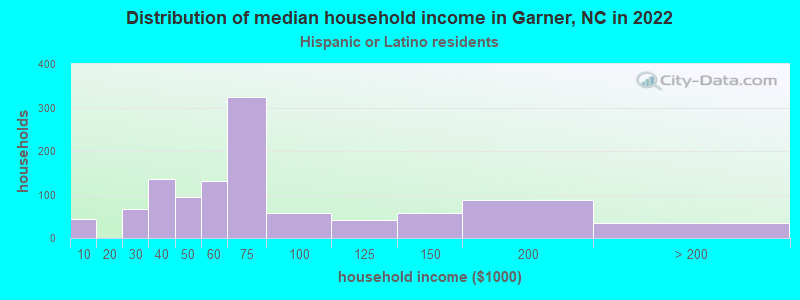
Income and house value in Garner Median household income in 2022 $90,827 White non-Hispanic householders$55,985 Black householders$99,316 Asian householders$64,436 Some other race householders$75,857 Two or more races householders$61,138 Hispanic or Latino race householdersMedian 2022 house value $350,199 White Non-Hispanic householders$364,975 Black or African American householders$664,934 American Indian or Alaska Native householders $646,612 Asian householders$363,202 Some other race householders$380,047 Two or more races householders$318,282 Hispanic or Latino householders
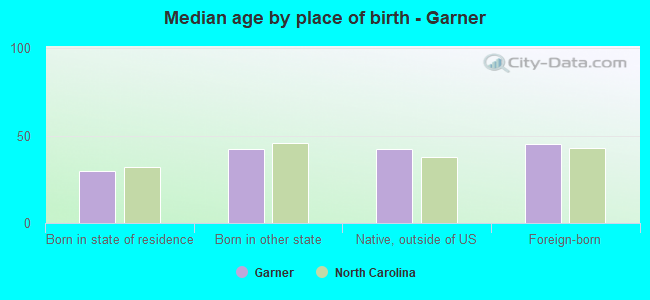
Median age by race in Garner
38.2 Median age for White residents36.2 40.7 41.3 Median age for Black or African American residents35.2 42.4 16.0 Median age for American Indian / Alaska Native residents15.1 53.4 40.8 Median age for Asian residents44.8 35.2 -609,884,331.7 Median age for Native Hawaiian / Pacific Islander residents-611,708,482.1 -612,403,100.2 31.0 Median age for Other race residents36.0 16.9 24.3 Median age for Two or more races residents22.4 28.3 38.0 Median age for White alone residents36.6 41.0 31.2 Median age for Hispanic or Latino residents31.1 32.4
Owner/renter occupied households by race in Garner
House owners and renters - White residents 5,677 69.6% Owner occupied2,475 30.4% Renter occupiedHouse owners and renters - Black or African American residents 1,649 53.4% Owner occupied1,440 46.6% Renter occupiedHouse owners and renters - American Indian / Alaska Native residents 23 65.3% Owner occupied12 34.7% Renter occupiedHouse owners and renters - Asian residents 206 86.3% Owner occupied33 13.7% Renter occupiedHouse owners and renters - Native Hawaiian / Pacific Islander residents 13 100.0% Owner occupiedHouse owners and renters - Other race residents 163 36.8% Owner occupied281 63.2% Renter occupiedHouse owners and renters - Two or more races residents 435 60.7% Owner occupied282 39.3% Renter occupiedHouse owners and renters - White alone residents 5,665 71.6% Owner occupied2,250 28.4% Renter occupiedHouse owners and renters - Hispanic or Latino residents 319 30.6% Owner occupied723 69.4% Renter occupied
Language usage in Garner
English speakers - Total 86.1% of residents of Garner speak English at home.
8.6% of residents speak Spanish at home 1,763 66.4% Speak English very well892 33.6% Speak English less than very well4.5% of residents speak other language at home 1,040 75.4% Speak English very well339 24.6% Speak English less than very well
English speakers - Born in the United States 95.3% of residents of Garner speak English at home.
2.8% of residents speak Spanish at home 373 100.0% Speak English very well1.6% of residents speak other language at home 218 100.0% Speak English very well
English speakers - Native, born elsewhere 52.6% of residents of Garner speak English at home.
27.0% of residents speak Spanish at home 131 79.9% Speak English very well33 20.1% Speak English less than very well16.5% of residents speak other language at home 100 100.0% Speak English very well
English speakers - Foreign-born 15.0% of residents of Garner speak English at home.
49.7% of residents speak Spanish at home 546 40.1% Speak English very well816 59.9% Speak English less than very well30.0% of residents speak other language at home 532 64.8% Speak English very well289 35.2% Speak English less than very well
White (Caucasian) - Speak only English Native:
95.7% (16,970)Foreign-born:
24.6% (219)
White (Caucasian) - Speak another language Native:
4.2% (748)Foreign-born:
72.3% (644)
Black or African American - Speak only English Native:
98.0% (6,933)Foreign-born:
19.2% (39)
Black or African American - Speak another language Native:
1.7% (120)Foreign-born:
82.5% (168)
Asian - Speak only English Native:
32.1% (57)Foreign-born:
13.5% (51)
Asian - Speak another language Native:
68.9% (123)Foreign-born:
86.5% (330)
Other race - Speak another language Native:
55.5% (317)Foreign-born:
99.7% (436)
Two or more races - Speak only English Native:
78.0% (1,827)Foreign-born:
12.1% (108)
Two or more races - Speak another language Native:
22.0% (515)Foreign-born:
87.2% (779)
White alone - Speak only English Native:
96.8% (16,814)Foreign-born:
39.5% (203)
White alone - Speak another language Native:
3.3% (566)Foreign-born:
60.5% (311)
Hispanic or Latino - Speak only English Native:
52.1% (1,053)Foreign-born:
2.6% (36)
Hispanic or Latino - Speak another language Native:
48.2% (974)Foreign-born:
97.8% (1,389)
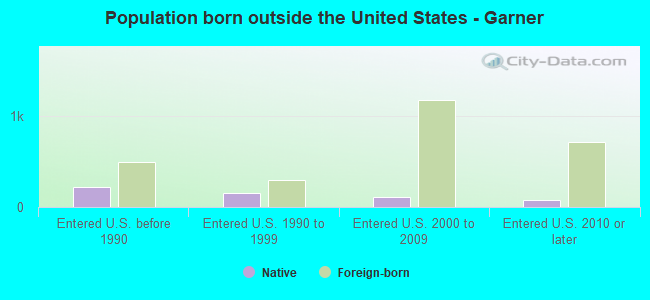
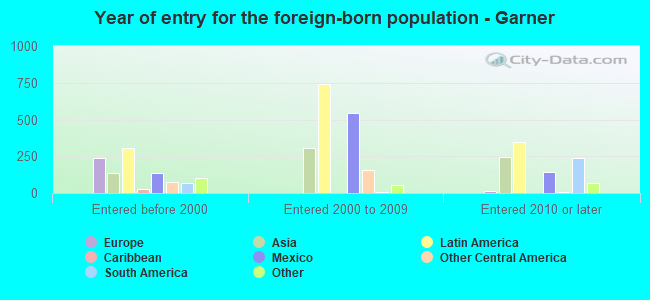
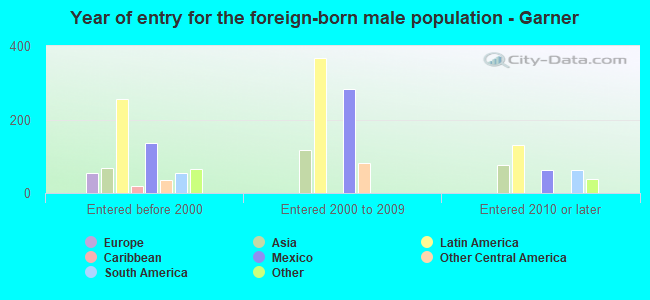
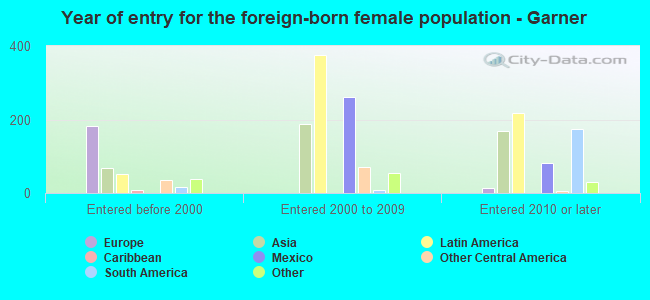
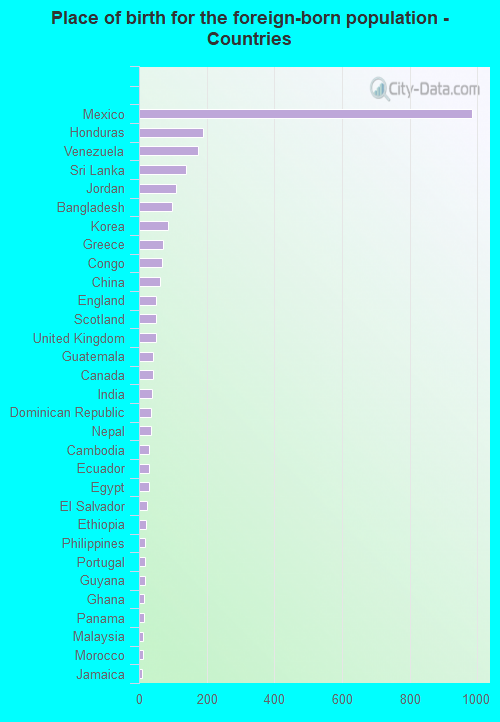
Foreign-born residents in Garner 2,623 residents are foreign born (4.6% Latin America , 1.9% Asia ).
This city:
8.0%North Carolina:
8.3%
Marital status for residents in Garner Marital status - White (Caucasian) population 15 years and over
Males 32.3% Never married59.9% Now married0.8% Separated1.2% Widowed5.9% DivorcedFemales 23.4% Never married54.3% Now married1.5% Separated8.5% Widowed12.3% DivorcedWomen who gave birth in the past 12 months Now married:
100.0% (187)Unmarried:
0.0% (0)
Women who did not give birth in the past 12 months Now married:
55.6% (2,350)Unmarried:
44.4% (1,876)
Marital status - Black or African American population 15 years and over
Males 46.8% Never married34.4% Now married5.6% Separated2.3% Widowed10.8% DivorcedFemales 38.9% Never married27.4% Now married2.4% Separated13.6% Widowed17.8% DivorcedWomen who gave birth in the past 12 months Now married:
0.0% (0)Unmarried:
100.0% (130)
Women who did not give birth in the past 12 months Now married:
26.2% (535)Unmarried:
73.8% (1,506)
Marital status - American Indian / Alaska Native population 15 years and over
Males 68.9% Never married23.0% Now married0.0% Separated0.0% Widowed8.1% DivorcedFemales 28.8% Never married48.1% Now married0.0% Separated0.0% Widowed23.1% DivorcedWomen who did not give birth in the past 12 months Now married:
34.8% (8)Unmarried:
65.2% (16)
Marital status - Asian population 15 years and over
Males 26.3% Never married73.7% Now married0.0% Separated0.0% Widowed0.0% DivorcedFemales 16.2% Never married73.1% Now married0.0% Separated2.3% Widowed8.3% DivorcedWomen who gave birth in the past 12 months Now married:
100.0% (8)Unmarried:
0.0% (0)
Women who did not give birth in the past 12 months Now married:
57.6% (78)Unmarried:
42.4% (58)
Marital status - Other race population 15 years and over
Males 42.3% Never married44.1% Now married13.5% Separated0.0% Widowed0.0% DivorcedFemales 35.9% Never married60.2% Now married0.0% Separated0.0% Widowed3.9% DivorcedWomen who did not give birth in the past 12 months Now married:
54.3% (143)Unmarried:
45.7% (121)
Marital status - Two or more races population 15 years and over
Males 58.3% Never married35.2% Now married0.0% Separated0.0% Widowed6.5% DivorcedFemales 35.5% Never married48.5% Now married3.2% Separated2.4% Widowed10.4% DivorcedWomen who gave birth in the past 12 months Now married:
0.0% (0)Unmarried:
100.0% (1)
Women who did not give birth in the past 12 months Now married:
45.0% (567)Unmarried:
55.0% (693)
Marital status - White alone, not Hispanic / Latino population 15 years and over
Males 31.5% Never married61.0% Now married0.8% Separated0.9% Widowed5.8% DivorcedFemales 21.4% Never married55.7% Now married1.5% Separated8.6% Widowed12.9% DivorcedWomen who gave birth in the past 12 months Now married:
100.0% (178)Unmarried:
0.0% (0)
Women who did not give birth in the past 12 months Now married:
58.6% (2,357)Unmarried:
41.4% (1,665)
Marital status - Hispanic or Latino population 15 years and over
Males 43.3% Never married43.9% Now married4.0% Separated2.1% Widowed6.8% DivorcedFemales 40.3% Never married50.1% Now married3.0% Separated3.9% Widowed2.7% DivorcedWomen who gave birth in the past 12 months Now married:
92.3% (13)Unmarried:
7.7% (1)
Women who did not give birth in the past 12 months Now married:
46.7% (464)Unmarried:
53.3% (530)
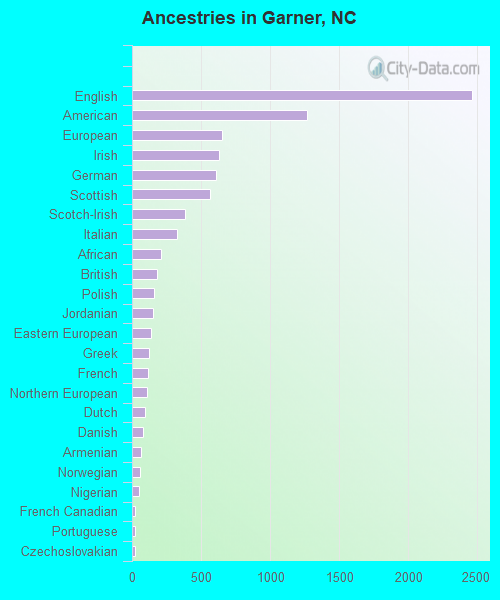
Ancestries in Garner
2,461 14.5% English1,270 7.5% American648 3.8% European632 3.7% Irish611 3.6% German563 3.3% Scottish382 2.3% Scotch-Irish329 1.9% Italian209 1.2% African183 1.1% British162 1.0% Polish150 0.9% Jordanian139 0.8% Eastern European120 0.7% Greek116 0.7% French109 0.6% Northern European94 0.6% Dutch77 0.5% Danish67 0.4% Armenian59 0.3% Norwegian48 0.3% Nigerian25 0.1% French Canadian25 0.1% Portuguese23 0.1% Czechoslovakian20 0.1% Ethiopian17 0.1% Russian15 0.09% Czech14 0.08% Egyptian
Geographical mobility in Garner Same house 1 year ago 15,725 81.2% White (Caucasian)6,081 78.2% Black or African American112 100.0% American Indian / Alaska Native529 86.5% Asian15 100.0% Native Hawaiian / Pacific Islander1,106 95.6% Other race3,376 98.7% Two or more races15,121 81.1% White alone, not Hispanic / Latino3,382 91.6% Hispanic or LatinoMoved within same county 1,443 7.5% White / Caucasian617 7.9% Black or African American8 7.9% American Indian / Alaska Native57 9.3% Asian57 5.0% Other race106 3.1% Two or more races1,376 7.4% White alone, not Hispanic / Latino253 6.9% Hispanic or LatinoMoved within same state 538 2.8% White / Caucasian571 7.3% Black or African American26 0.8% Two or more races520 2.8% White alone, not Hispanic / Latino28 0.8% Hispanic or LatinoMoved from different state 1,399 7.2% White / Caucasian305 3.9% Black or African American1,361 7.3% White alone, not Hispanic / Latino23 0.6% Hispanic or LatinoMoved from abroad 13 0.1% White21 3.4% Asian14 0.4% Hispanic or Latino
Children Nativity (place of birth) in Garner
Children under 6 years - Living with two parents Both parents native 1,123 98.7% Native15 1.3% Foreign-bornBoth parents foreign-born 153 100.0% NativeOne native, one foreign-born parent 139 100.0% NativeChildren under 6 years - Living with one parent Native parent 534 100.0% NativeForeign-born parent 49 100.0% NativeChildren 6 to 17 years - Living with two parents Both parents native 2,561 98.7% Native34 1.3% Foreign-bornBoth parents foreign-born 513 94.4% Native30 5.6% Foreign-bornOne native, one foreign-born parent 257 100.0% NativeChildren 6 to 17 years - Living with one parent Native parent 790 100.0% NativeForeign-born parent 187 52.0% Native173 48.0% Foreign-born
Grandparents responsible for own grandchildren in Garner
Grandparents (30 to 59 years) White / Caucasian 71 100.0% Responsible for grandchildrenBlack or African American 40 24.8% Responsible for grandchildren122 75.2% Not responsible for grandchildrenOther race 32 100.0% Responsible for grandchildrenWhite alone, not Hispanic / Latino 50 100.0% Responsible for grandchildrenHispanic or Latino 45 100.0% Responsible for grandchildrenGrandparents (60 years and over) White / Caucasian 23 29.8% Responsible for grandchildren55 70.2% Not responsible for grandchildrenBlack or African American 64 100.0% Not responsible for grandchildrenWhite alone, not Hispanic / Latino 24 28.6% Responsible for grandchildren59 71.4% Not responsible for grandchildrenHispanic or Latino 9 100.0% Responsible for grandchildren