Races in Garfield, Wisconsin (WI) Detailed Stats
Ancestries, Foreign-born residents, place of birth

Recent posts about races in Garfield, Wisconsin on our local forum with over 2,400,000 registered users:
 | Fellow Milwaukeeans thoughts on Chicago? (79 replies) |
| Is Milwaukee A Dangerous City (214 replies) |
| How are you coping with this weather? (28 replies) |
| Rough Areas.... Interesting Subject (5 replies) |
1.7% of Garfield, WI residents are foreign-born , which is 188.6% less than the foreign-born rate of 5.0% across the entire state of Wisconsin.
Race distribution in Garfield

- 1,41498.0%White alone
- 171.2%Hispanic
- 40.3%Two or more races
- 50.3%American Indian alone
- 20.1%Asian alone
- 10.07%Other race alone

2000
2022
-
- 4,681,63087.3%White alone
- 300,2455.6%Black alone
- 192,9213.6%Hispanic
- 87,9951.6%Asian alone
- 51,9211.0%Two or more races
- 43,9800.8%American Indian alone
- 3,6370.07%Other race alone
- 1,3460.03%Native Hawaiian and Other
Pacific Islander alone

-
- 4,654,03179.0%White alone
- 447,0227.6%Hispanic
- 345,6785.9%Black alone
- 217,5323.7%Two or more races
- 172,2422.9%Asian alone
- 33,7620.6%American Indian alone
- 19,6800.3%Other race alone
- 2,5920.04%Native Hawaiian and Other
Pacific Islander alone

Income and house value in Garfield
- Median household income in 2022
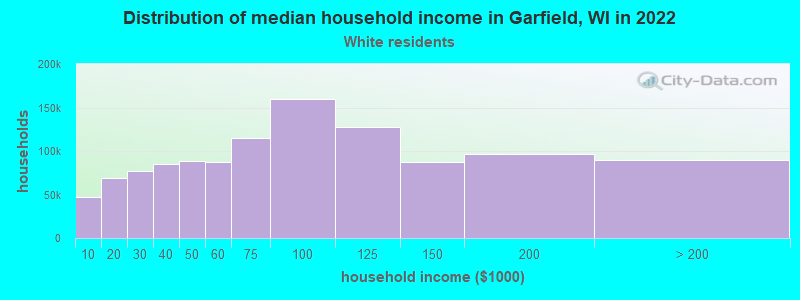
- $82,205White non-Hispanic householders
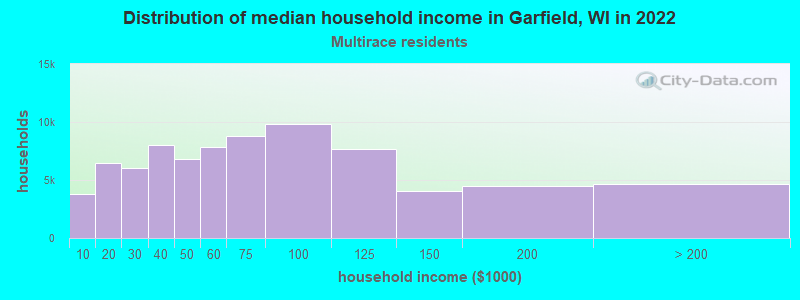
- $73,238Two or more races householders
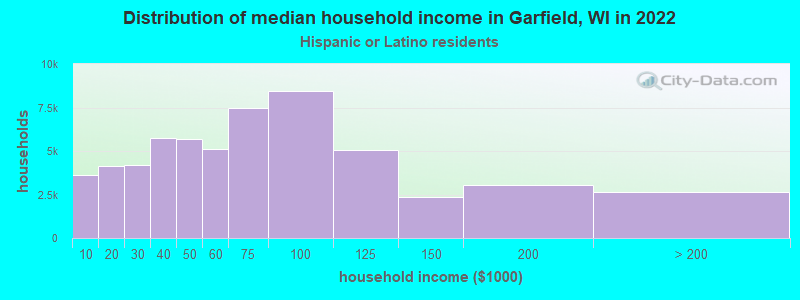
- $53,015Hispanic or Latino race householders
- Median 2022 house value
- $299,033White Non-Hispanic householders
- $206,481Two or more races householders
Household income for White non-Hispanic householders
Household income for Two or more races householders
Household income for Hispanic or Latino race householders
Foreign-born residents in Garfield
25 residents are foreign born
| This city: | 1.7% |
| Wisconsin: | 3.6% |
Ancestries in Garfield

- 48126.8%German
- 43024.0%Norwegian
- 1659.2%Irish
- 1438.0%Swedish
- 824.6%English
- 764.2%Other
- 593.3%French
- 593.3%French Canadian
- 553.1%United States
- 452.5%Danish
- 442.5%Dutch
- 392.2%Polish
- 382.1%Italian
- 281.6%Czech
- 120.7%Scotch-Irish
- 90.5%Scottish
- 80.4%Greek
- 80.4%Subsaharan African
- 50.3%Welsh
- 40.2%Russian
- 30.2%Ukrainian

Zip codes: 54001.