Races in Gaithersburg, Maryland (MD) Detailed Stats
Data:
Races - White alone (%)
Races - White alone (% change since 2000)
Races - Black alone (%)
Races - Black alone (% change since 2000)
Races - American Indian alone (%)
Races - American Indian alone (% change since 2000)
Races - Asian alone (%)
Races - Asian alone (% change since 2000)
Races - Hispanic (%)
Races - Hispanic (% change since 2000)
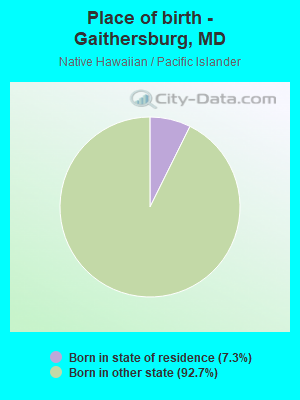
Races - Native Hawaiian and Other Pacific Islander alone (%)
Races - Native Hawaiian and Other Pacific Islander alone (% change since 2000)
Races - Two or more races(%)
Races - Two or more races(% change since 2000)
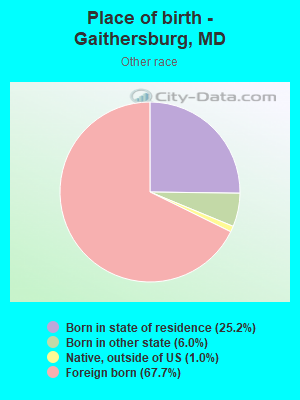
Races - Other race alone (%)
Races - Other race alone (% change since 2000)
Racial diversity
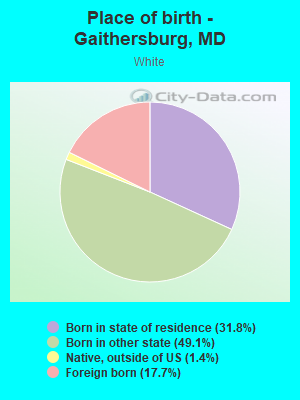
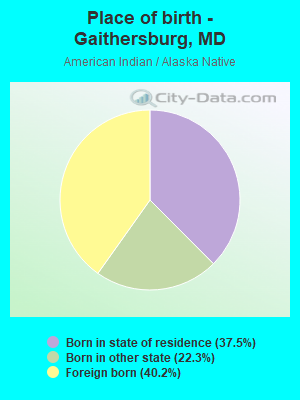
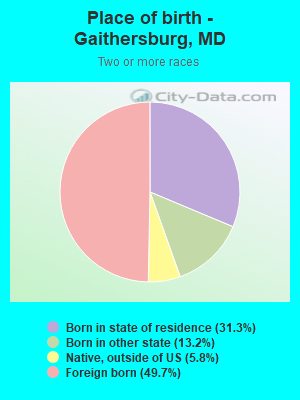
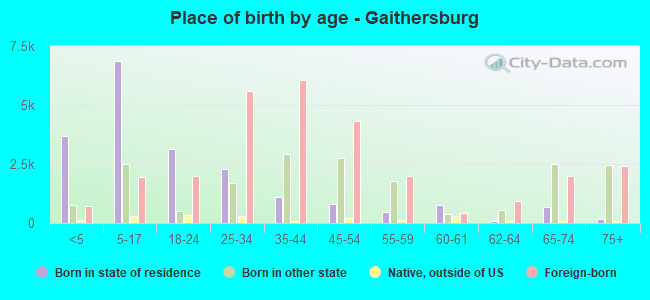
Place of birth - Born in state of residence (%)
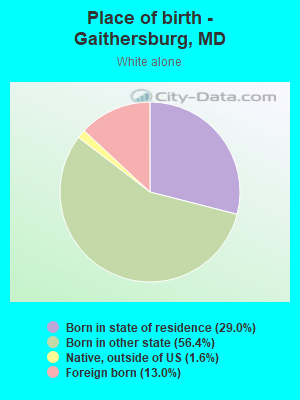
Place of birth - Born in state of residence (%) - White
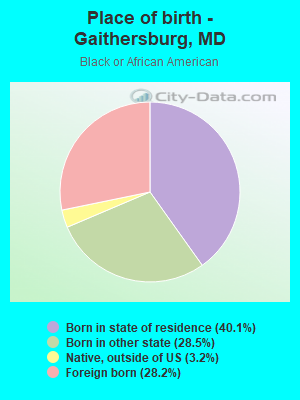
Place of birth - Born in state of residence (%) - Black or African American
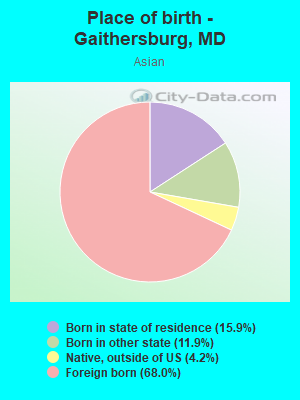
Place of birth - Born in state of residence (%) - Asian
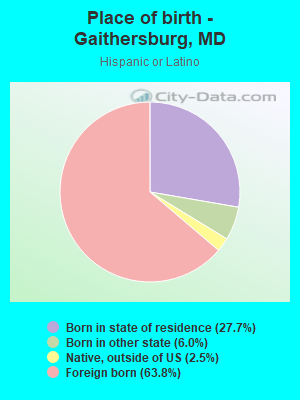
Place of birth - Born in state of residence (%) - Hispanic or Latino
Place of birth - Born in state of residence (%) - American Indian and Alaska Native
Place of birth - Born in state of residence (%) - Multirace
Place of birth - Born in state of residence (%) - Other Race
Place of birth - Born in other state (%)
Place of birth - Born in other state (%) - White
Place of birth - Born in other state (%) - Black or African American
Place of birth - Born in other state (%) - Asian
Place of birth - Born in other state (%) - Hispanic or Latino
Place of birth - Born in other state (%) - American Indian and Alaska Native
Place of birth - Born in other state (%) - Multirace
Place of birth - Born in other state (%) - Other Race
Place of birth - Native, outside of US (%)
Place of birth - Native, outside of US (%) - White
Place of birth - Native, outside of US (%) - Black or African American
Place of birth - Native, outside of US (%) - Asian
Place of birth - Native, outside of US (%) - Hispanic or Latino
Place of birth - Native, outside of US (%) - American Indian and Alaska Native
Place of birth - Native, outside of US (%) - Multirace
Place of birth - Native, outside of US (%) - Other Race
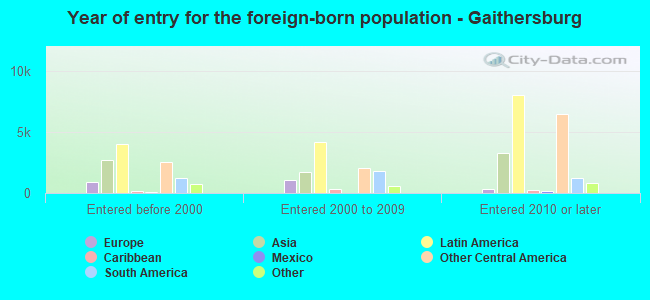
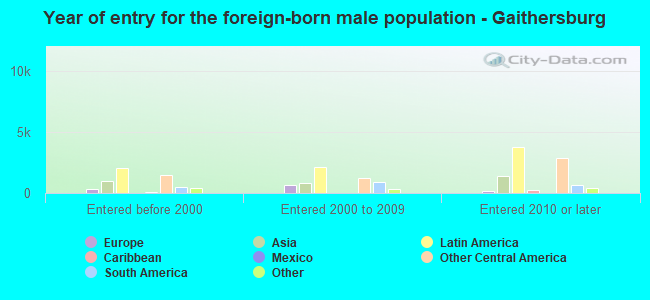
Place of birth - Foreign born (%)
Place of birth - Foreign born (%) - White
Place of birth - Foreign born (%) - Black or African American
Place of birth - Foreign born (%) - Asian
Place of birth - Foreign born (%) - Hispanic or Latino
Place of birth - Foreign born (%) - American Indian and Alaska Native
Place of birth - Foreign born (%) - Multirace
Place of birth - Foreign born (%) - Other Race
Residents speaking English at home (%)
Residents speaking English at home - Born in the United States (%)
Residents speaking English at home - Native, born elsewhere (%)
Residents speaking English at home - Foreign born (%)
Residents speaking Spanish at home (%)
Residents speaking Spanish at home - Born in the United States (%)
Residents speaking Spanish at home - Native, born elsewhere (%)
Residents speaking Spanish at home - Foreign born (%)
Residents speaking other language at home (%)
Residents speaking other language at home - Born in the United States (%)
Residents speaking other language at home - Native, born elsewhere (%)
Residents speaking other language at home - Foreign born (%)
Marital status - Never married (%)
Marital status - Now married (%)
Marital status - Separated (%)
Marital status - Widowed (%)
Marital status - Divorced (%)
Ancestries Reported - Arab (%)
Ancestries Reported - Czech (%)
Ancestries Reported - Danish (%)
Ancestries Reported - Dutch (%)
Ancestries Reported - English (%)
Ancestries Reported - French (%)
Ancestries Reported - French Canadian (%)
Ancestries Reported - German (%)
Ancestries Reported - Greek (%)
Ancestries Reported - Hungarian (%)
Ancestries Reported - Irish (%)
Ancestries Reported - Italian (%)
Ancestries Reported - Lithuanian (%)
Ancestries Reported - Norwegian (%)
Ancestries Reported - Polish (%)
Ancestries Reported - Portuguese (%)
Ancestries Reported - Russian (%)
Ancestries Reported - Scotch-Irish (%)
Ancestries Reported - Scottish (%)
Ancestries Reported - Slovak (%)
Ancestries Reported - Subsaharan African (%)
Ancestries Reported - Swedish (%)
Ancestries Reported - Swiss (%)
Ancestries Reported - Ukrainian (%)
Ancestries Reported - United States (%)
Ancestries Reported - Welsh (%)
Ancestries Reported - West Indian (%)
Ancestries Reported - Other (%)
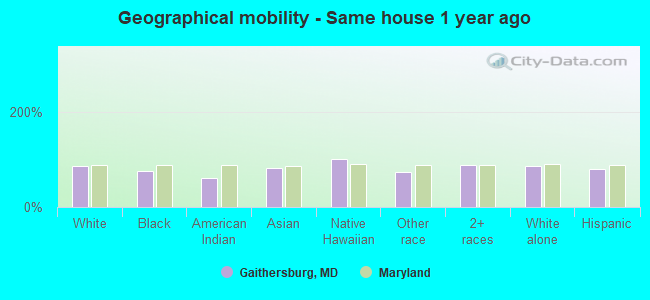
Geographical mobility - Same house 1 year ago (%)
Geographical mobility - Same house 1 year ago (%) - White
Geographical mobility - Same house 1 year ago (%) - Black or African American
Geographical mobility - Same house 1 year ago (%) - Asian
Geographical mobility - Same house 1 year ago (%) - Hispanic or Latino
Geographical mobility - Same house 1 year ago (%) - American Indian and Alaska Native
Geographical mobility - Same house 1 year ago (%) - Multirace
Geographical mobility - Same house 1 year ago (%) - Other Race
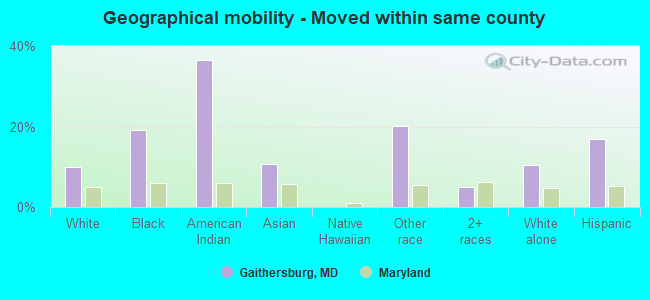
Geographical mobility - Moved within same county (%)
Geographical mobility - Moved within same county (%) - White
Geographical mobility - Moved within same county (%) - Black or African American
Geographical mobility - Moved within same county (%) - Asian
Geographical mobility - Moved within same county (%) - Hispanic or Latino
Geographical mobility - Moved within same county (%) - American Indian and Alaska Native
Geographical mobility - Moved within same county (%) - Multirace
Geographical mobility - Moved within same county (%) - Other Race
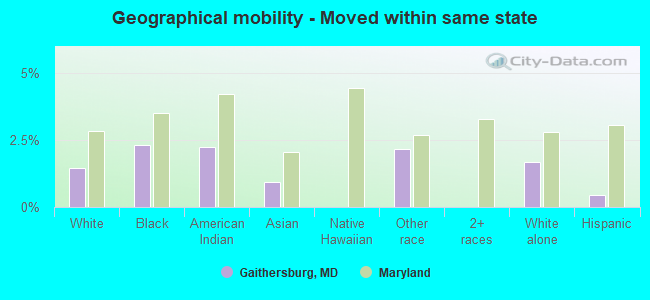
Geographical mobility - Moved from different county within same state (%)
Geographical mobility - Moved from different county within same state (%) - White
Geographical mobility - Moved from different county within same state (%) - Black or African American
Geographical mobility - Moved from different county within same state (%) - Asian
Geographical mobility - Moved from different county within same state (%) - Hispanic or Latino
Geographical mobility - Moved from different county within same state (%) - American Indian and Alaska Native
Geographical mobility - Moved from different county within same state (%) - Multirace
Geographical mobility - Moved from different county within same state (%) - Other Race
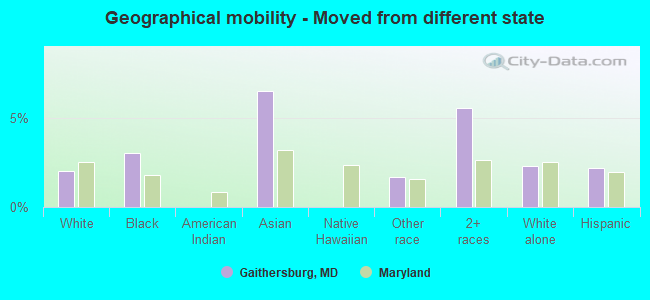
Geographical mobility - Moved from different state (%)
Geographical mobility - Moved from different state (%) - White
Geographical mobility - Moved from different state (%) - Black or African American
Geographical mobility - Moved from different state (%) - Asian
Geographical mobility - Moved from different state (%) - Hispanic or Latino
Geographical mobility - Moved from different state (%) - American Indian and Alaska Native
Geographical mobility - Moved from different state (%) - Multirace
Geographical mobility - Moved from different state (%) - Other Race
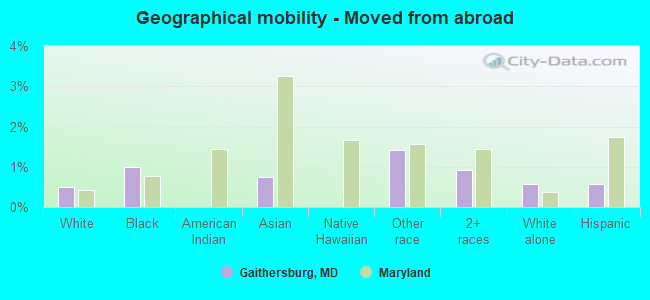
Geographical mobility - Moved from abroad (%)
Geographical mobility - Moved from abroad (%) - White
Geographical mobility - Moved from abroad (%) - Black or African American
Geographical mobility - Moved from abroad (%) - Asian
Geographical mobility - Moved from abroad (%) - Hispanic or Latino
Geographical mobility - Moved from abroad (%) - American Indian and Alaska Native
Geographical mobility - Moved from abroad (%) - Multirace
Geographical mobility - Moved from abroad (%) - Other Race
Place of birth for the foreign-born population - Ireland (%)
Place of birth for the foreign-born population - Denmark (%)
Place of birth for the foreign-born population - Norway (%)
Place of birth for the foreign-born population - Sweden (%)
Place of birth for the foreign-born population - United Kingdom (%)
Place of birth for the foreign-born population - England (%)
Place of birth for the foreign-born population - Scotland (%)
Place of birth for the foreign-born population - Other Northern Europe (%)
Place of birth for the foreign-born population - Austria (%)
Place of birth for the foreign-born population - Belgium (%)
Place of birth for the foreign-born population - France (%)
Place of birth for the foreign-born population - Germany (%)
Place of birth for the foreign-born population - Netherlands (%)
Place of birth for the foreign-born population - Switzerland (%)
Place of birth for the foreign-born population - Other Western Europe (%)
Place of birth for the foreign-born population - Greece (%)
Place of birth for the foreign-born population - Italy (%)
Place of birth for the foreign-born population - Portugal (%)
Place of birth for the foreign-born population - Spain (%)
Place of birth for the foreign-born population - Other Southern Europe (%)
Place of birth for the foreign-born population - Albania (%)
Place of birth for the foreign-born population - Belarus (%)
Place of birth for the foreign-born population - Bosnia and Herzegovina (%)
Place of birth for the foreign-born population - Bulgaria (%)
Place of birth for the foreign-born population - Croatia (%)
Place of birth for the foreign-born population - Czechoslovakia (%)
Place of birth for the foreign-born population - Hungary (%)
Place of birth for the foreign-born population - Latvia (%)
Place of birth for the foreign-born population - Lithuania (%)
Place of birth for the foreign-born population - North Macedonia (Macedonia) (%)
Place of birth for the foreign-born population - Moldova (%)
Place of birth for the foreign-born population - Poland (%)
Place of birth for the foreign-born population - Romania (%)
Place of birth for the foreign-born population - Russia (%)
Place of birth for the foreign-born population - Serbia (%)
Place of birth for the foreign-born population - Ukraine (%)
Place of birth for the foreign-born population - Other Eastern Europe (%)
Place of birth for the foreign-born population - China (%)
Place of birth for the foreign-born population - Hong Kong (%)
Place of birth for the foreign-born population - Taiwan (%)
Place of birth for the foreign-born population - Japan (%)
Place of birth for the foreign-born population - Korea (%)
Place of birth for the foreign-born population - Other Eastern Asia (%)
Place of birth for the foreign-born population - Afghanistan (%)
Place of birth for the foreign-born population - Bangladesh (%)
Place of birth for the foreign-born population - India (%)
Place of birth for the foreign-born population - Iran (%)
Place of birth for the foreign-born population - Kazakhstan (%)
Place of birth for the foreign-born population - Nepal (%)
Place of birth for the foreign-born population - Pakistan (%)
Place of birth for the foreign-born population - Sri Lanka (%)
Place of birth for the foreign-born population - Uzbekistan (%)
Place of birth for the foreign-born population - Other South Central Asia (%)
Place of birth for the foreign-born population - Burma (%)
Place of birth for the foreign-born population - Cambodia (%)
Place of birth for the foreign-born population - Indonesia (%)
Place of birth for the foreign-born population - Laos (%)
Place of birth for the foreign-born population - Malaysia (%)
Place of birth for the foreign-born population - Philippines (%)
Place of birth for the foreign-born population - Singapore (%)
Place of birth for the foreign-born population - Thailand (%)
Place of birth for the foreign-born population - Vietnam (%)
Place of birth for the foreign-born population - Other South Eastern Asia (%)
Place of birth for the foreign-born population - Armenia (%)
Place of birth for the foreign-born population - Iraq (%)
Place of birth for the foreign-born population - Israel (%)
Place of birth for the foreign-born population - Jordan (%)
Place of birth for the foreign-born population - Kuwait (%)
Place of birth for the foreign-born population - Lebanon (%)
Place of birth for the foreign-born population - Saudi Arabia (%)
Place of birth for the foreign-born population - Syria (%)
Place of birth for the foreign-born population - Turkey (%)
Place of birth for the foreign-born population - Yemen (%)
Place of birth for the foreign-born population - Other Western Asia (%)
Place of birth for the foreign-born population - Eritrea (%)
Place of birth for the foreign-born population - Ethiopia (%)
Place of birth for the foreign-born population - Kenya (%)
Place of birth for the foreign-born population - Somalia (%)
Place of birth for the foreign-born population - Uganda (%)
Place of birth for the foreign-born population - Zimbabwe (%)
Place of birth for the foreign-born population - Other Eastern Africa (%)
Place of birth for the foreign-born population - Cameroon (%)
Place of birth for the foreign-born population - Congo (%)
Place of birth for the foreign-born population - Democratic Republic of Congo (Zaire) (%)
Place of birth for the foreign-born population - Other Middle Africa (%)
Place of birth for the foreign-born population - Egypt (%)
Place of birth for the foreign-born population - Morocco (%)
Place of birth for the foreign-born population - Sudan (%)
Place of birth for the foreign-born population - Other Northern Africa (%)
Place of birth for the foreign-born population - South Africa (%)
Place of birth for the foreign-born population - Other Southern Africa (%)
Place of birth for the foreign-born population - Cabo Verde (%)
Place of birth for the foreign-born population - Ghana (%)
Place of birth for the foreign-born population - Liberia (%)
Place of birth for the foreign-born population - Nigeria (%)
Place of birth for the foreign-born population - Senegal (%)
Place of birth for the foreign-born population - Sierra Leone (%)
Place of birth for the foreign-born population - Other Western Africa (%)
Place of birth for the foreign-born population - Australia (%)
Place of birth for the foreign-born population - New Zealand (%)
Place of birth for the foreign-born population - Fiji (%)
Place of birth for the foreign-born population - Micronesia (%)
Place of birth for the foreign-born population - Bahamas (%)
Place of birth for the foreign-born population - Barbados (%)
Place of birth for the foreign-born population - Cuba (%)
Place of birth for the foreign-born population - Dominica (%)
Place of birth for the foreign-born population - Dominican Republic (%)
Place of birth for the foreign-born population - Grenada (%)
Place of birth for the foreign-born population - Haiti (%)
Place of birth for the foreign-born population - Jamaica (%)
Place of birth for the foreign-born population - St. Vincent and the Grenadines (%)
Place of birth for the foreign-born population - Trinidad and Tobago (%)
Place of birth for the foreign-born population - West Indies (%)
Place of birth for the foreign-born population - Other Caribbean (%)
Place of birth for the foreign-born population - Belize (%)
Place of birth for the foreign-born population - Costa Rica (%)
Place of birth for the foreign-born population - El Salvador (%)
Place of birth for the foreign-born population - Guatemala (%)
Place of birth for the foreign-born population - Honduras (%)
Place of birth for the foreign-born population - Mexico (%)
Place of birth for the foreign-born population - Nicaragua (%)
Place of birth for the foreign-born population - Panama (%)
Place of birth for the foreign-born population - Other Central America (%)
Place of birth for the foreign-born population - Argentina (%)
Place of birth for the foreign-born population - Bolivia (%)
Place of birth for the foreign-born population - Brazil (%)
Place of birth for the foreign-born population - Chile (%)
Place of birth for the foreign-born population - Colombia (%)
Place of birth for the foreign-born population - Ecuador (%)
Place of birth for the foreign-born population - Guyana (%)
Place of birth for the foreign-born population - Peru (%)
Place of birth for the foreign-born population - Uruguay (%)
Place of birth for the foreign-born population - Venezuela (%)
Place of birth for the foreign-born population - Other South America (%)
Place of birth for the foreign-born population - Canada (%)
Place of birth for the foreign-born population - Other Northern America (%)
Place of birth for the foreign-born population - Other (%)
Latest news about races in Gaithersburg, MD collected exclusively by city-data.com from local newspapers, TV, and radio stations
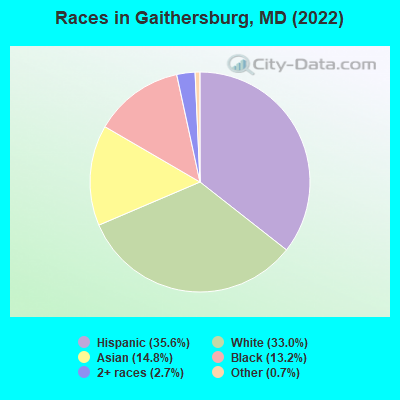
According to 2022 data, the most numerous races in Gaithersburg, MD are White alone (22,760 residents), Black alone (9,088 residents), and Hispanic (24,549 residents). 47.9% of Gaithersburg residents speak English at home. 42.8% of Gaithersburg, MD residents are foreign-born (17.3% born in Latin America, 16.4% born in Asia), which is 62.7% greater than the foreign-born rate of 16.0% across the entire state of Maryland.
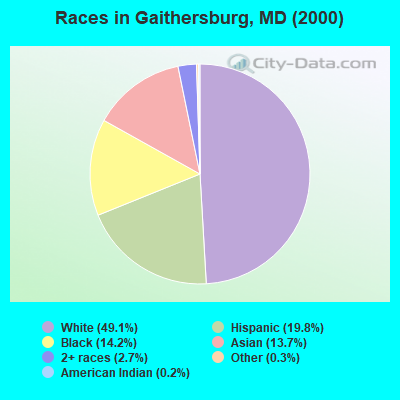
Race distribution in Gaithersburg
2000 2022
25,818 49.1% White alone 10,398 19.8% Hispanic 7,457 14.2% Black alone 7,205 13.7% Asian alone 1,401 2.7% Two or more races 170 0.3% Other race alone 131 0.2% American Indian alone 33 0.06% Native Hawaiian and Other
24,549 35.6% Hispanic 22,760 33.0% White alone 10,175 14.8% Asian alone 9,088 13.2% Black alone 1,828 2.7% Two or more races 514 0.7% Other race alone 38 0.06% American Indian alone
2000 2022
3,286,547 62.1% White alone 1,464,735 27.7% Black alone 227,916 4.3% Hispanic 209,738 4.0% Asian alone 82,946 1.6% Two or more races 13,312 0.3% American Indian alone 9,379 0.2% Other race alone 1,913 0.04% Native Hawaiian and Other
2,906,492 47.1% White alone 1,800,914 29.2% Black alone 705,842 11.4% Hispanic 401,818 6.5% Asian alone 291,317 4.7% Two or more races 46,930 0.8% Other race alone 8,930 0.1% American Indian alone 2,417 0.04% Native Hawaiian and Other
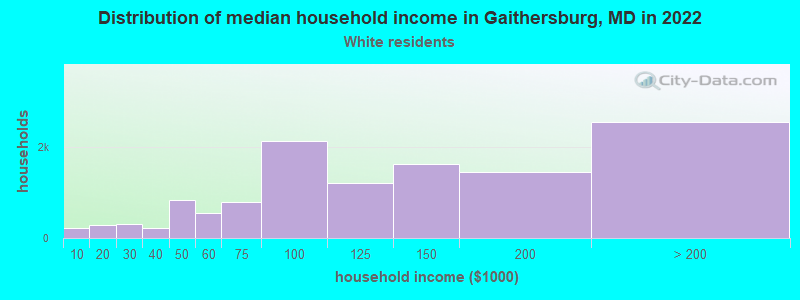
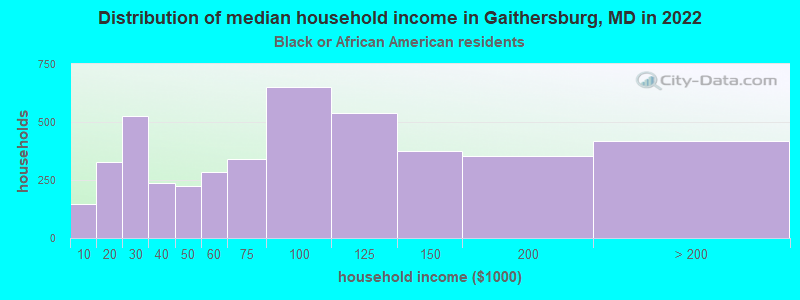
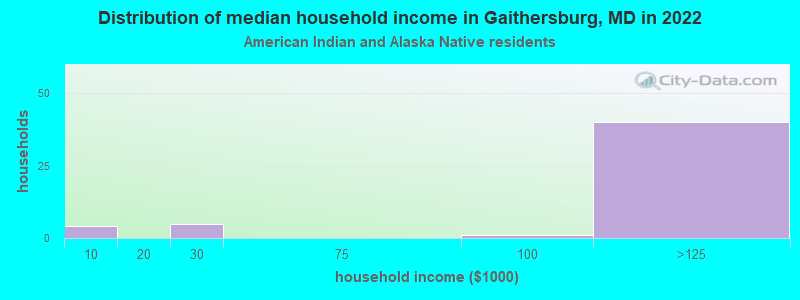
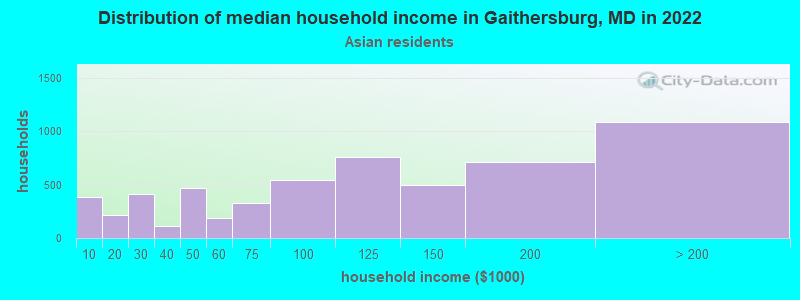
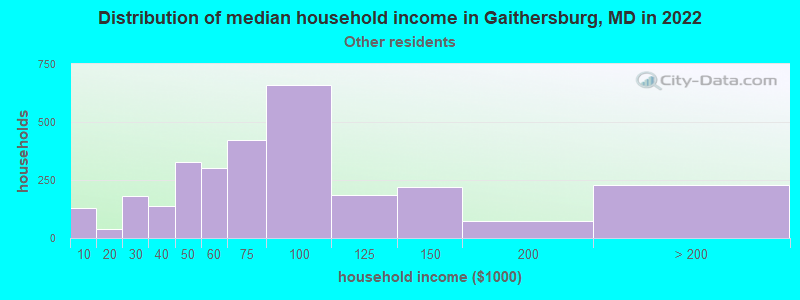
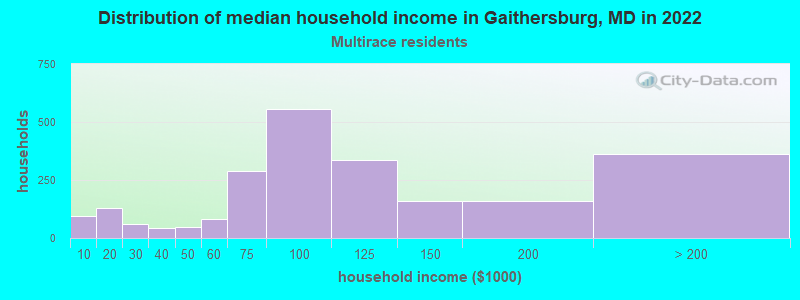
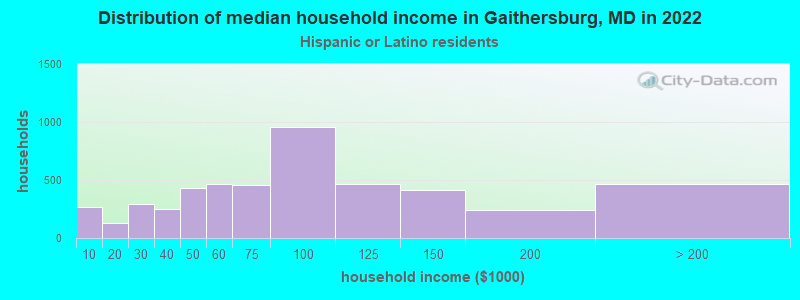
Income and house value in Gaithersburg Median household income in 2022 $124,110 White non-Hispanic householders$78,726 Black householders$103,755 Asian householders$69,460 Some other race householders$88,977 Two or more races householders$80,629 Hispanic or Latino race householdersMedian 2022 house value $644,820 White Non-Hispanic householders$449,450 Black or African American householdersover $1,000,000 American Indian or Alaska Native householders $623,260 Asian householders$411,637 Some other race householders$487,264 Two or more races householders$410,641 Hispanic or Latino householders
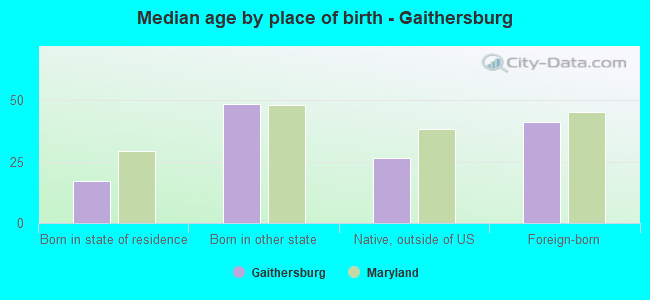
Median age by race in Gaithersburg
45.4 Median age for White residents41.9 48.6 37.3 Median age for Black or African American residents40.0 36.3 42.0 Median age for American Indian / Alaska Native residents24.1 57.8 36.3 Median age for Asian residents36.7 35.6 -666,666,666.0 Median age for Native Hawaiian / Pacific Islander residents-666,666,666.0 -666,666,666.0 24.4 Median age for Other race residents27.1 22.9 35.4 Median age for Two or more races residents29.7 36.1 48.3 Median age for White alone residents45.3 48.7 29.1 Median age for Hispanic or Latino residents24.5 34.0
Owner/renter occupied households by race in Gaithersburg
House owners and renters - White residents 6,666 55.0% Owner occupied5,455 45.0% Renter occupiedHouse owners and renters - Black or African American residents 1,548 41.3% Owner occupied2,198 58.7% Renter occupiedHouse owners and renters - American Indian / Alaska Native residents 26 48.1% Owner occupied28 51.9% Renter occupiedHouse owners and renters - Asian residents 2,028 52.9% Owner occupied1,809 47.1% Renter occupiedHouse owners and renters - Native Hawaiian / Pacific Islander residents 62 100.0% Owner occupiedHouse owners and renters - Other race residents 1,021 37.8% Owner occupied1,683 62.2% Renter occupiedHouse owners and renters - Two or more races residents 1,294 62.2% Owner occupied787 37.8% Renter occupiedHouse owners and renters - White alone residents 6,550 57.0% Owner occupied4,935 43.0% Renter occupiedHouse owners and renters - Hispanic or Latino residents 2,185 43.7% Owner occupied2,811 56.3% Renter occupied
Language usage in Gaithersburg
English speakers - Total 47.9% of residents of Gaithersburg speak English at home.
29.7% of residents speak Spanish at home 8,653 45.7% Speak English very well10,271 54.3% Speak English less than very well22.3% of residents speak other language at home 9,447 66.5% Speak English very well4,753 33.5% Speak English less than very well
English speakers - Born in the United States 85.4% of residents of Gaithersburg speak English at home.
3.4% of residents speak Spanish at home 491 79.4% Speak English very well127 20.6% Speak English less than very well11.1% of residents speak other language at home 1,209 60.2% Speak English very well798 39.8% Speak English less than very well
English speakers - Native, born elsewhere 23.5% of residents of Gaithersburg speak English at home.
37.6% of residents speak Spanish at home 587 96.1% Speak English very well24 3.9% Speak English less than very well38.9% of residents speak other language at home 515 81.4% Speak English very well118 18.6% Speak English less than very well
English speakers - Foreign-born 13.7% of residents of Gaithersburg speak English at home.
50.8% of residents speak Spanish at home 4,288 30.5% Speak English very well9,768 69.5% Speak English less than very well35.6% of residents speak other language at home 6,186 62.8% Speak English very well3,667 37.2% Speak English less than very well
White (Caucasian) - Speak only English Native:
88.1% (17,515)Foreign-born:
23.5% (1,097)
White (Caucasian) - Speak another language Native:
11.9% (2,362)Foreign-born:
76.5% (3,563)
Black or African American - Speak only English Native:
83.9% (5,374)Foreign-born:
55.8% (1,437)
Black or African American - Speak another language Native:
16.1% (1,034)Foreign-born:
44.2% (1,140)
American Indian / Alaska Native - Speak only English Native:
38.3% (67)Foreign-born:
12.9% (17)
American Indian / Alaska Native - Speak another language Native:
60.1% (105)Foreign-born:
93.7% (124)
Asian - Speak only English Native:
30.2% (854)Foreign-born:
9.0% (635)
Asian - Speak another language Native:
69.8% (1,971)Foreign-born:
91.0% (6,446)
Other race - Speak only English Native:
41.7% (1,078)Foreign-born:
5.2% (456)
Other race - Speak another language Native:
58.3% (1,510)Foreign-born:
94.8% (8,375)
Two or more races - Speak only English Native:
44.4% (1,866)Foreign-born:
3.7% (159)
Two or more races - Speak another language Native:
55.6% (2,338)Foreign-born:
96.3% (4,194)
White alone - Speak only English Native:
93.2% (17,397)Foreign-born:
19.2% (570)
White alone - Speak another language Native:
6.8% (1,264)Foreign-born:
80.8% (2,400)
Hispanic or Latino - Speak only English Native:
24.4% (1,477)Foreign-born:
6.6% (983)
Hispanic or Latino - Speak another language Native:
75.6% (4,583)Foreign-born:
93.4% (13,931)
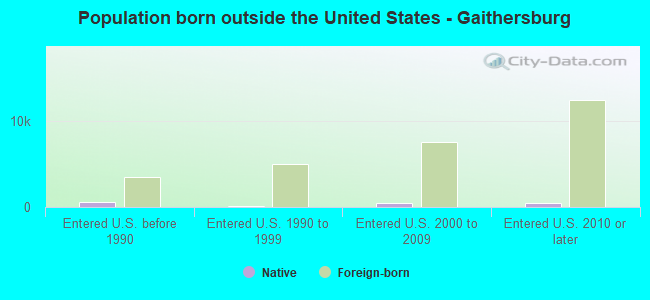
Foreign-born residents in Gaithersburg 29,445 residents are foreign born (17.3% Latin America , 16.4% Asia ).
This city:
42.8%Maryland:
15.7%
Marital status for residents in Gaithersburg Marital status - White (Caucasian) population 15 years and over
Males 35.4% Never married58.0% Now married0.3% Separated1.0% Widowed5.3% DivorcedFemales 30.9% Never married40.3% Now married2.3% Separated15.8% Widowed10.7% DivorcedWomen who gave birth in the past 12 months Now married:
100.0% (555)Unmarried:
0.0% (0)
Women who did not give birth in the past 12 months Now married:
33.2% (1,710)Unmarried:
66.8% (3,433)
Marital status - Black or African American population 15 years and over
Males 44.8% Never married35.0% Now married1.1% Separated0.0% Widowed19.1% DivorcedFemales 64.1% Never married17.7% Now married6.0% Separated3.5% Widowed8.7% DivorcedWomen who gave birth in the past 12 months Now married:
78.0% (177)Unmarried:
22.0% (50)
Women who did not give birth in the past 12 months Now married:
28.8% (980)Unmarried:
71.2% (2,420)
Marital status - American Indian / Alaska Native population 15 years and over
Males 44.3% Never married55.7% Now married0.0% Separated0.0% Widowed0.0% DivorcedFemales 32.9% Never married39.8% Now married0.0% Separated0.0% Widowed27.3% DivorcedWomen who did not give birth in the past 12 months Now married:
0.0% (0)Unmarried:
100.0% (111)
Marital status - Asian population 15 years and over
Males 17.5% Never married80.7% Now married1.8% Separated0.0% Widowed0.0% DivorcedFemales 26.9% Never married53.5% Now married0.0% Separated10.2% Widowed9.4% DivorcedWomen who gave birth in the past 12 months Now married:
98.9% (182)Unmarried:
1.1% (2)
Women who did not give birth in the past 12 months Now married:
63.6% (2,289)Unmarried:
36.4% (1,308)
Marital status - Native Hawaiian / Pacific Islander population 15 years and over
Males 0.0% Never married100.0% Now married0.0% Separated0.0% Widowed0.0% DivorcedFemales 0.0% Never married100.0% Now married0.0% Separated0.0% Widowed0.0% DivorcedWomen who did not give birth in the past 12 months Now married:
100.0% (2)Unmarried:
0.0% (0)
Marital status - Other race population 15 years and over
Males 49.9% Never married47.0% Now married0.0% Separated0.3% Widowed2.8% DivorcedFemales 37.0% Never married48.9% Now married2.6% Separated3.5% Widowed8.0% DivorcedWomen who gave birth in the past 12 months Now married:
100.0% (250)Unmarried:
0.0% (0)
Women who did not give birth in the past 12 months Now married:
48.0% (1,264)Unmarried:
52.0% (1,371)
Marital status - Two or more races population 15 years and over
Males 31.9% Never married64.2% Now married0.0% Separated2.1% Widowed1.8% DivorcedFemales 33.1% Never married50.7% Now married0.0% Separated1.7% Widowed14.5% DivorcedWomen who gave birth in the past 12 months Now married:
88.9% (46)Unmarried:
11.1% (6)
Women who did not give birth in the past 12 months Now married:
40.1% (972)Unmarried:
59.9% (1,450)
Marital status - White alone, not Hispanic / Latino population 15 years and over
Males 36.9% Never married56.0% Now married0.3% Separated1.0% Widowed5.8% DivorcedFemales 27.2% Never married41.6% Now married2.5% Separated17.5% Widowed11.2% DivorcedWomen who gave birth in the past 12 months Now married:
100.0% (243)Unmarried:
0.0% (0)
Women who did not give birth in the past 12 months Now married:
35.6% (1,710)Unmarried:
64.4% (3,091)
Marital status - Hispanic or Latino population 15 years and over
Males 44.1% Never married51.5% Now married0.0% Separated0.0% Widowed4.4% DivorcedFemales 38.5% Never married51.9% Now married0.0% Separated1.5% Widowed8.1% DivorcedWomen who gave birth in the past 12 months Now married:
100.0% (597)Unmarried:
0.0% (0)
Women who did not give birth in the past 12 months Now married:
45.4% (2,177)Unmarried:
54.6% (2,621)
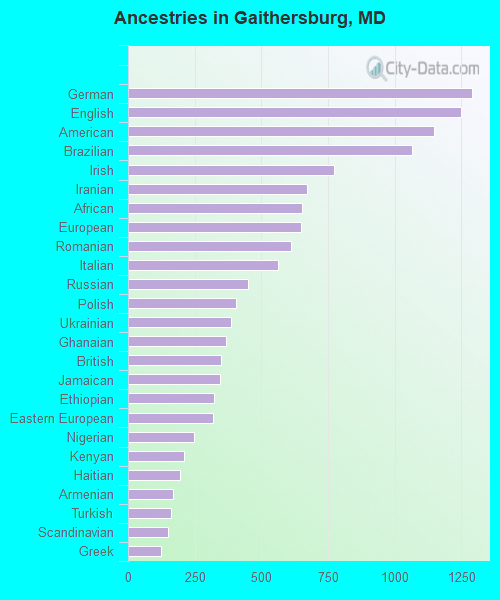
Ancestries in Gaithersburg
1,290 2.8% German1,251 2.7% English1,148 2.5% American1,067 2.3% Brazilian774 1.7% Irish670 1.5% Iranian653 1.4% African649 1.4% European610 1.3% Romanian564 1.2% Italian452 1.0% Russian406 0.9% Polish387 0.9% Ukrainian369 0.8% Ghanaian350 0.8% British347 0.8% Jamaican324 0.7% Ethiopian319 0.7% Eastern European247 0.5% Nigerian210 0.5% Kenyan194 0.4% Haitian167 0.4% Armenian163 0.4% Turkish151 0.3% Scandinavian123 0.3% Greek118 0.3% Scottish111 0.2% French107 0.2% Portuguese106 0.2% Norwegian104 0.2% Albanian104 0.2% Trinidadian and Tobagonian98 0.2% Scotch-Irish89 0.2% Swedish87 0.2% Slovak65 0.1% Australian52 0.1% Northern European48 0.1% Canadian46 0.1% Afghan44 0.10% Hungarian43 0.09% Austrian41 0.09% Danish38 0.08% Iraqi35 0.08% Lebanese35 0.08% Lithuanian35 0.08% British West Indian34 0.07% Bahamian31 0.07% Finnish28 0.06% Guyanese27 0.06% Barbadian26 0.06% Belgian25 0.05% Czechoslovakian24 0.05% Egyptian23 0.05% Moroccan20 0.04% Dutch20 0.04% French Canadian18 0.04% Slovene12 0.03% Yugoslavian12 0.03% Israeli11 0.02% South African8 0.02% Swiss8 0.02% Welsh7 0.02% Syrian6 0.01% Czech5 0.01% Bulgarian5 0.01% Liberian
Geographical mobility in Gaithersburg Same house 1 year ago 22,225 86.1% White (Caucasian)6,807 74.5% Black or African American217 61.0% American Indian / Alaska Native8,431 81.3% Asian135 100.0% Native Hawaiian / Pacific Islander8,031 74.3% Other race7,760 88.6% Two or more races19,191 84.9% White alone, not Hispanic / Latino19,228 79.9% Hispanic or LatinoMoved within same county 2,561 9.9% White / Caucasian1,746 19.1% Black or African American129 36.4% American Indian / Alaska Native1,098 10.6% Asian2,184 20.2% Other race435 5.0% Two or more races2,378 10.5% White alone, not Hispanic / Latino4,055 16.9% Hispanic or LatinoMoved within same state 379 1.5% White / Caucasian210 2.3% Black or African American8 2.2% American Indian / Alaska Native98 0.9% Asian235 2.2% Other race379 1.7% White alone, not Hispanic / Latino107 0.4% Hispanic or LatinoMoved from different state 520 2.0% White / Caucasian278 3.0% Black or African American671 6.5% Asian180 1.7% Other race484 5.5% Two or more races520 2.3% White alone, not Hispanic / Latino529 2.2% Hispanic or LatinoMoved from abroad 129 0.5% White91 1.0% Black or African American76 0.7% Asian154 1.4% Other race81 0.9% Two or more races129 0.6% White alone, not Hispanic / Latino136 0.6% Hispanic or Latino
Children Nativity (place of birth) in Gaithersburg
Children under 6 years - Living with two parents Both parents native 644 100.0% NativeBoth parents foreign-born 2,541 78.8% Native682 21.2% Foreign-bornOne native, one foreign-born parent 725 100.0% NativeChildren under 6 years - Living with one parent Native parent 380 100.0% NativeForeign-born parent 1,110 91.7% Native101 8.3% Foreign-bornChildren 6 to 17 years - Living with two parents Both parents native 1,618 100.0% NativeBoth parents foreign-born 2,822 79.5% Native727 20.5% Foreign-bornOne native, one foreign-born parent 616 89.0% Native76 11.0% Foreign-bornChildren 6 to 17 years - Living with one parent Native parent 1,042 100.0% NativeForeign-born parent 2,156 59.7% Native1,457 40.3% Foreign-born
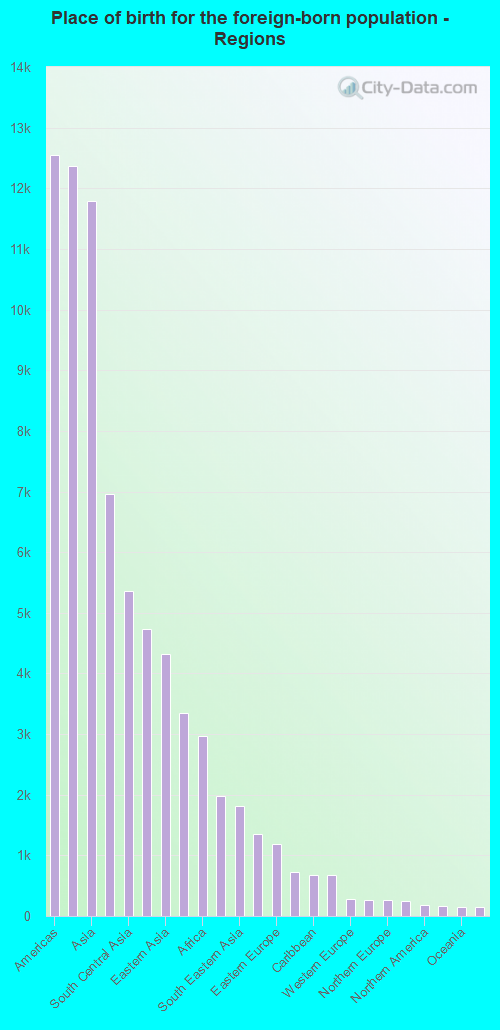
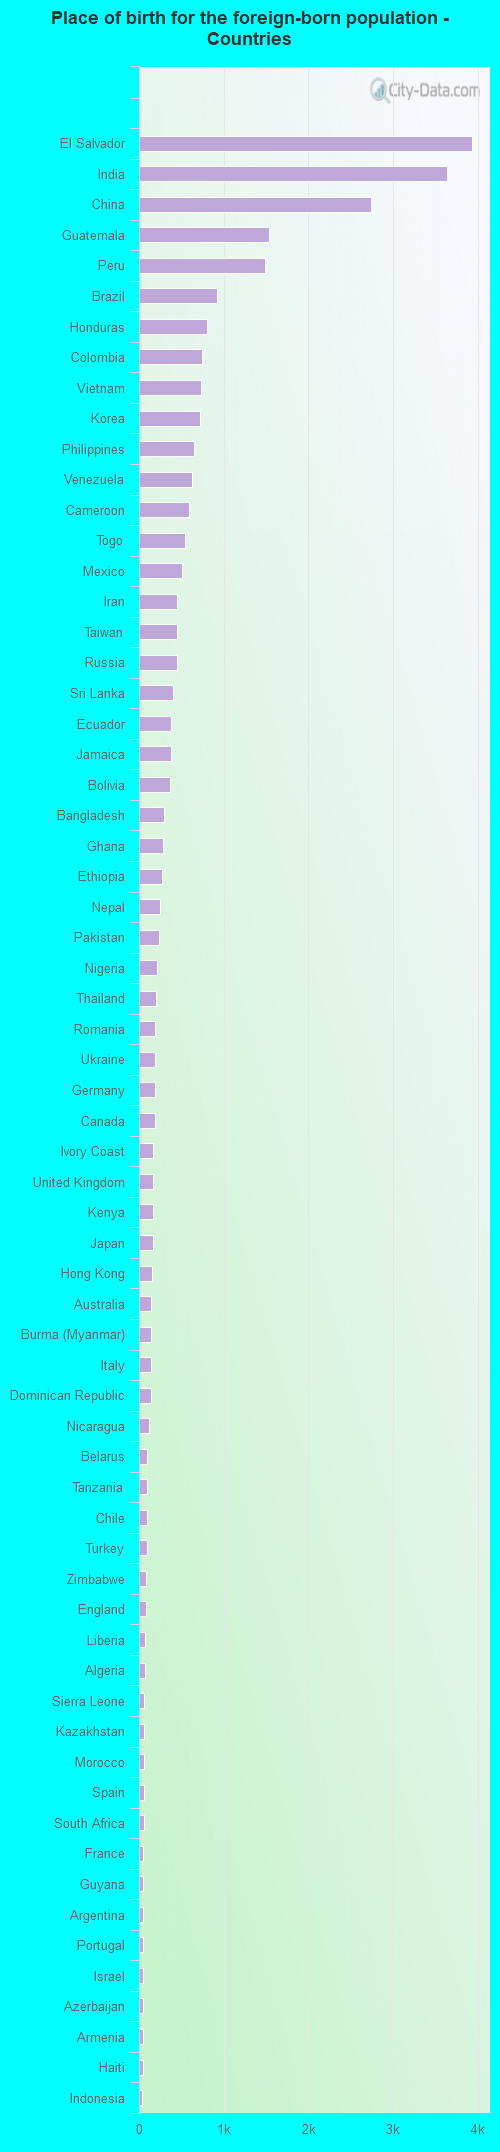
Place of birth for residents in Gaithersburg 12,556 Americas12,371 Latin America11,790 Asia6,952 Central America5,356 South Central Asia4,736 South America4,315 Eastern Asia3,344 China2,960 Africa1,985 Europe1,808 South Eastern Asia1,360 Western Africa1,190 Eastern Europe718 Eastern Africa682 Caribbean668 Middle Africa281 Western Europe271 Western Asia261 Northern Europe252 Southern Europe184 Northern America157 Northern Africa152 Oceania145 Australia and New Zealand Subregion54 Southern Africa3,938 El Salvador3,642 India2,736 China1,537 Guatemala1,491 Peru919 Brazil800 Honduras746 Colombia738 Vietnam715 Korea646 Philippines624 Venezuela586 Cameroon542 Togo504 Mexico450 Iran447 Taiwan446 Russia407 Sri Lanka378 Ecuador376 Jamaica369 Bolivia294 Bangladesh282 Ghana273 Ethiopia254 Nepal232 Pakistan207 Nigeria195 Thailand192 Romania192 Ukraine186 Germany184 Canada168 Ivory Coast166 United Kingdom163 Kenya163 Japan159 Hong Kong145 Australia140 Burma (Myanmar)137 Italy136 Dominican Republic121 Nicaragua94 Belarus93 Tanzania91 Chile89 Turkey88 Zimbabwe84 England70 Liberia65 Algeria64 Sierra Leone62 Kazakhstan61 Morocco56 Spain54 South Africa51 France51 Guyana51 Argentina49 Portugal45 Israel43 Azerbaijan43 Armenia42 Haiti39 Indonesia32 Albania31 Hungary29 Barbados28 Sudan27 Laos25 Dominica24 Belgium24 Democratic Republic of Congo (Zaire)23 Costa Rica20 Panama20 Czechoslovakia19 Poland18 Lebanon17 Netherlands16 Grenada15 Bahamas15 Malaysia12 Cuba12 Iraq11 Uzbekistan11 Sweden11 Jordan11 Bosnia and Herzegovina10 Uruguay9 Greece9 Trinidad and Tobago9 Senegal7 Fiji7 Eritrea6 Uganda6 Singapore6 Syria5 Belize5 Bulgaria3 Congo3 Egypt
Grandparents responsible for own grandchildren in Gaithersburg
Grandparents (30 to 59 years) White / Caucasian 10 20.1% Responsible for grandchildren39 79.9% Not responsible for grandchildrenBlack or African American 31 53.1% Responsible for grandchildren27 46.9% Not responsible for grandchildrenAmerican Indian / Alaska Native 19 100.0% Not responsible for grandchildrenAsian 27 100.0% Not responsible for grandchildrenOther race 50 58.3% Responsible for grandchildren36 41.7% Not responsible for grandchildrenTwo or more races 16 67.9% Responsible for grandchildren7 32.1% Not responsible for grandchildrenWhite alone, not Hispanic / Latino 4 5.0% Responsible for grandchildren67 95.0% Not responsible for grandchildrenHispanic or Latino 108 74.1% Responsible for grandchildren38 25.9% Not responsible for grandchildrenGrandparents (60 years and over) White / Caucasian 28 8.3% Responsible for grandchildren304 91.7% Not responsible for grandchildrenBlack or African American 40 41.3% Responsible for grandchildren57 58.7% Not responsible for grandchildrenAsian 431 100.0% Not responsible for grandchildrenOther race 89 100.0% Not responsible for grandchildrenTwo or more races 19 3.7% Responsible for grandchildren486 96.3% Not responsible for grandchildrenWhite alone, not Hispanic / Latino 22 7.0% Responsible for grandchildren297 93.0% Not responsible for grandchildrenHispanic or Latino 13 4.0% Responsible for grandchildren317 96.0% Not responsible for grandchildren