Races in Fuquay-Varina, North Carolina (NC) Detailed Stats
Data:
Races - White alone (%)
Races - White alone (% change since 2000)
Races - Black alone (%)
Races - Black alone (% change since 2000)
Races - American Indian alone (%)
Races - American Indian alone (% change since 2000)
Races - Asian alone (%)
Races - Asian alone (% change since 2000)
Races - Hispanic (%)
Races - Hispanic (% change since 2000)
Races - Native Hawaiian and Other Pacific Islander alone (%)
Races - Native Hawaiian and Other Pacific Islander alone (% change since 2000)
Races - Two or more races(%)
Races - Two or more races(% change since 2000)
Races - Other race alone (%)
Races - Other race alone (% change since 2000)
Racial diversity
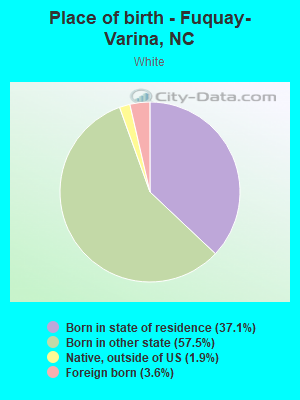
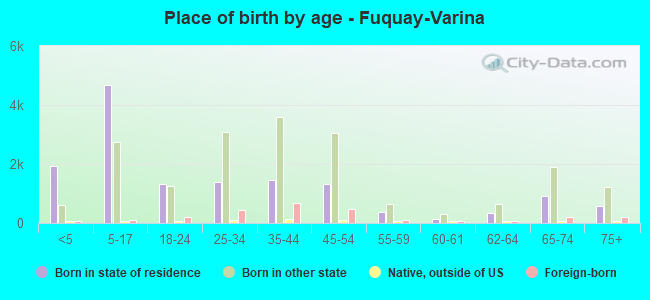
Place of birth - Born in state of residence (%)
Place of birth - Born in state of residence (%) - White
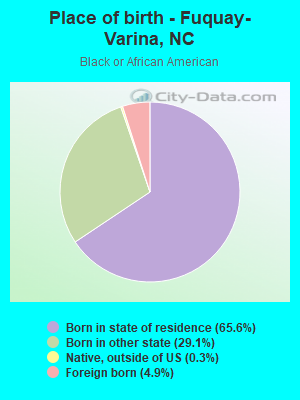
Place of birth - Born in state of residence (%) - Black or African American
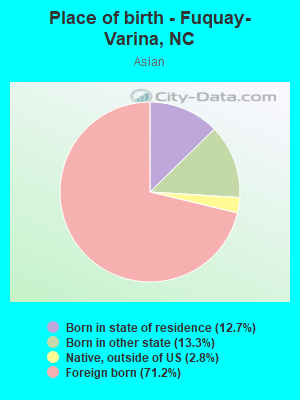
Place of birth - Born in state of residence (%) - Asian
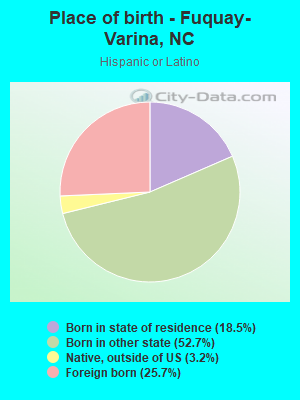
Place of birth - Born in state of residence (%) - Hispanic or Latino
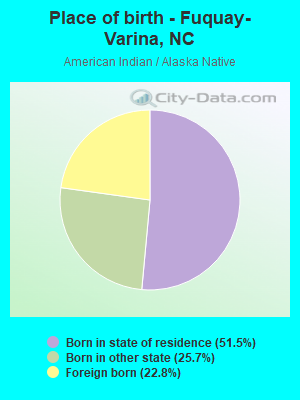
Place of birth - Born in state of residence (%) - American Indian and Alaska Native
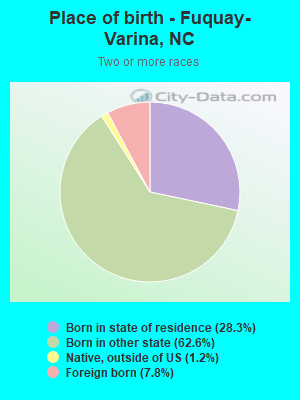
Place of birth - Born in state of residence (%) - Multirace
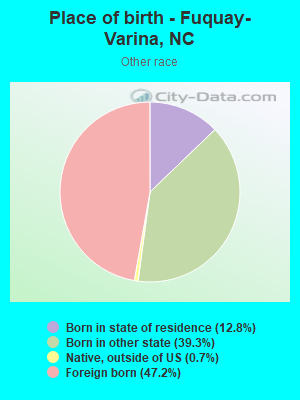
Place of birth - Born in state of residence (%) - Other Race
Place of birth - Born in other state (%)
Place of birth - Born in other state (%) - White
Place of birth - Born in other state (%) - Black or African American
Place of birth - Born in other state (%) - Asian
Place of birth - Born in other state (%) - Hispanic or Latino
Place of birth - Born in other state (%) - American Indian and Alaska Native
Place of birth - Born in other state (%) - Multirace
Place of birth - Born in other state (%) - Other Race
Place of birth - Native, outside of US (%)
Place of birth - Native, outside of US (%) - White
Place of birth - Native, outside of US (%) - Black or African American
Place of birth - Native, outside of US (%) - Asian
Place of birth - Native, outside of US (%) - Hispanic or Latino
Place of birth - Native, outside of US (%) - American Indian and Alaska Native
Place of birth - Native, outside of US (%) - Multirace
Place of birth - Native, outside of US (%) - Other Race
Place of birth - Foreign born (%)
Place of birth - Foreign born (%) - White
Place of birth - Foreign born (%) - Black or African American
Place of birth - Foreign born (%) - Asian
Place of birth - Foreign born (%) - Hispanic or Latino
Place of birth - Foreign born (%) - American Indian and Alaska Native
Place of birth - Foreign born (%) - Multirace
Place of birth - Foreign born (%) - Other Race
Residents speaking English at home (%)
Residents speaking English at home - Born in the United States (%)
Residents speaking English at home - Native, born elsewhere (%)
Residents speaking English at home - Foreign born (%)
Residents speaking Spanish at home (%)
Residents speaking Spanish at home - Born in the United States (%)
Residents speaking Spanish at home - Native, born elsewhere (%)
Residents speaking Spanish at home - Foreign born (%)
Residents speaking other language at home (%)
Residents speaking other language at home - Born in the United States (%)
Residents speaking other language at home - Native, born elsewhere (%)
Residents speaking other language at home - Foreign born (%)
Marital status - Never married (%)
Marital status - Now married (%)
Marital status - Separated (%)
Marital status - Widowed (%)
Marital status - Divorced (%)
Ancestries Reported - Arab (%)
Ancestries Reported - Czech (%)
Ancestries Reported - Danish (%)
Ancestries Reported - Dutch (%)
Ancestries Reported - English (%)
Ancestries Reported - French (%)
Ancestries Reported - French Canadian (%)
Ancestries Reported - German (%)
Ancestries Reported - Greek (%)
Ancestries Reported - Hungarian (%)
Ancestries Reported - Irish (%)
Ancestries Reported - Italian (%)
Ancestries Reported - Lithuanian (%)
Ancestries Reported - Norwegian (%)
Ancestries Reported - Polish (%)
Ancestries Reported - Portuguese (%)
Ancestries Reported - Russian (%)
Ancestries Reported - Scotch-Irish (%)
Ancestries Reported - Scottish (%)
Ancestries Reported - Slovak (%)
Ancestries Reported - Subsaharan African (%)
Ancestries Reported - Swedish (%)
Ancestries Reported - Swiss (%)
Ancestries Reported - Ukrainian (%)
Ancestries Reported - United States (%)
Ancestries Reported - Welsh (%)
Ancestries Reported - West Indian (%)
Ancestries Reported - Other (%)
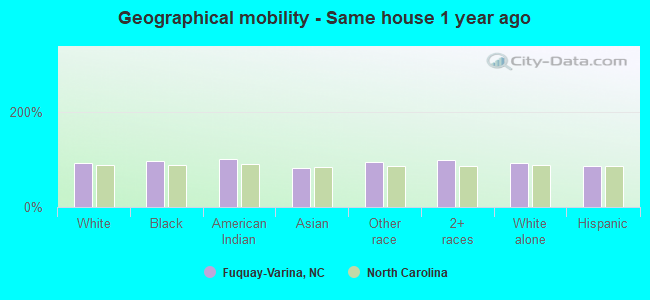
Geographical mobility - Same house 1 year ago (%)
Geographical mobility - Same house 1 year ago (%) - White
Geographical mobility - Same house 1 year ago (%) - Black or African American
Geographical mobility - Same house 1 year ago (%) - Asian
Geographical mobility - Same house 1 year ago (%) - Hispanic or Latino
Geographical mobility - Same house 1 year ago (%) - American Indian and Alaska Native
Geographical mobility - Same house 1 year ago (%) - Multirace
Geographical mobility - Same house 1 year ago (%) - Other Race
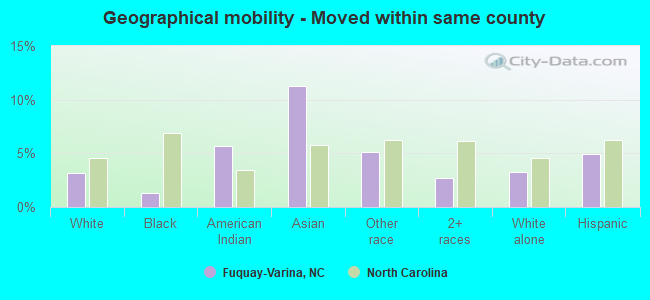
Geographical mobility - Moved within same county (%)
Geographical mobility - Moved within same county (%) - White
Geographical mobility - Moved within same county (%) - Black or African American
Geographical mobility - Moved within same county (%) - Asian
Geographical mobility - Moved within same county (%) - Hispanic or Latino
Geographical mobility - Moved within same county (%) - American Indian and Alaska Native
Geographical mobility - Moved within same county (%) - Multirace
Geographical mobility - Moved within same county (%) - Other Race
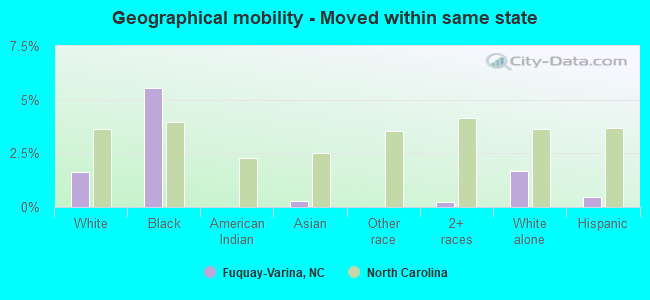
Geographical mobility - Moved from different county within same state (%)
Geographical mobility - Moved from different county within same state (%) - White
Geographical mobility - Moved from different county within same state (%) - Black or African American
Geographical mobility - Moved from different county within same state (%) - Asian
Geographical mobility - Moved from different county within same state (%) - Hispanic or Latino
Geographical mobility - Moved from different county within same state (%) - American Indian and Alaska Native
Geographical mobility - Moved from different county within same state (%) - Multirace
Geographical mobility - Moved from different county within same state (%) - Other Race
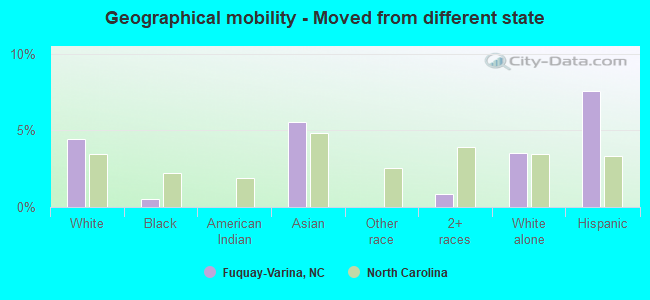
Geographical mobility - Moved from different state (%)
Geographical mobility - Moved from different state (%) - White
Geographical mobility - Moved from different state (%) - Black or African American
Geographical mobility - Moved from different state (%) - Asian
Geographical mobility - Moved from different state (%) - Hispanic or Latino
Geographical mobility - Moved from different state (%) - American Indian and Alaska Native
Geographical mobility - Moved from different state (%) - Multirace
Geographical mobility - Moved from different state (%) - Other Race
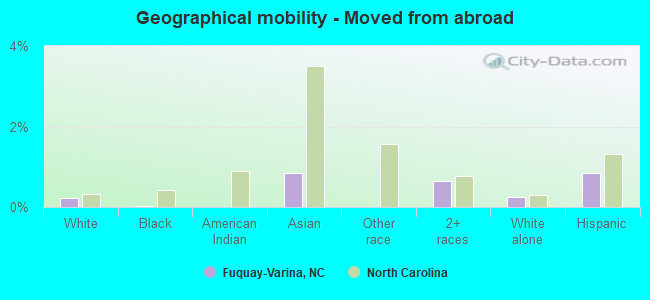
Geographical mobility - Moved from abroad (%)
Geographical mobility - Moved from abroad (%) - White
Geographical mobility - Moved from abroad (%) - Black or African American
Geographical mobility - Moved from abroad (%) - Asian
Geographical mobility - Moved from abroad (%) - Hispanic or Latino
Geographical mobility - Moved from abroad (%) - American Indian and Alaska Native
Geographical mobility - Moved from abroad (%) - Multirace
Geographical mobility - Moved from abroad (%) - Other Race
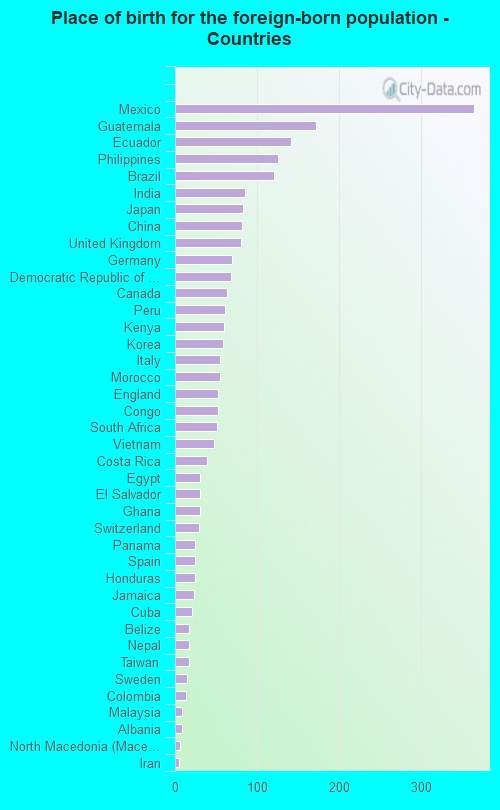
Place of birth for the foreign-born population - Ireland (%)
Place of birth for the foreign-born population - Denmark (%)
Place of birth for the foreign-born population - Norway (%)
Place of birth for the foreign-born population - Sweden (%)
Place of birth for the foreign-born population - United Kingdom (%)
Place of birth for the foreign-born population - England (%)
Place of birth for the foreign-born population - Scotland (%)
Place of birth for the foreign-born population - Other Northern Europe (%)
Place of birth for the foreign-born population - Austria (%)
Place of birth for the foreign-born population - Belgium (%)
Place of birth for the foreign-born population - France (%)
Place of birth for the foreign-born population - Germany (%)
Place of birth for the foreign-born population - Netherlands (%)
Place of birth for the foreign-born population - Switzerland (%)
Place of birth for the foreign-born population - Other Western Europe (%)
Place of birth for the foreign-born population - Greece (%)
Place of birth for the foreign-born population - Italy (%)
Place of birth for the foreign-born population - Portugal (%)
Place of birth for the foreign-born population - Spain (%)
Place of birth for the foreign-born population - Other Southern Europe (%)
Place of birth for the foreign-born population - Albania (%)
Place of birth for the foreign-born population - Belarus (%)
Place of birth for the foreign-born population - Bosnia and Herzegovina (%)
Place of birth for the foreign-born population - Bulgaria (%)
Place of birth for the foreign-born population - Croatia (%)
Place of birth for the foreign-born population - Czechoslovakia (%)
Place of birth for the foreign-born population - Hungary (%)
Place of birth for the foreign-born population - Latvia (%)
Place of birth for the foreign-born population - Lithuania (%)
Place of birth for the foreign-born population - North Macedonia (Macedonia) (%)
Place of birth for the foreign-born population - Moldova (%)
Place of birth for the foreign-born population - Poland (%)
Place of birth for the foreign-born population - Romania (%)
Place of birth for the foreign-born population - Russia (%)
Place of birth for the foreign-born population - Serbia (%)
Place of birth for the foreign-born population - Ukraine (%)
Place of birth for the foreign-born population - Other Eastern Europe (%)
Place of birth for the foreign-born population - China (%)
Place of birth for the foreign-born population - Hong Kong (%)
Place of birth for the foreign-born population - Taiwan (%)
Place of birth for the foreign-born population - Japan (%)
Place of birth for the foreign-born population - Korea (%)
Place of birth for the foreign-born population - Other Eastern Asia (%)
Place of birth for the foreign-born population - Afghanistan (%)
Place of birth for the foreign-born population - Bangladesh (%)
Place of birth for the foreign-born population - India (%)
Place of birth for the foreign-born population - Iran (%)
Place of birth for the foreign-born population - Kazakhstan (%)
Place of birth for the foreign-born population - Nepal (%)
Place of birth for the foreign-born population - Pakistan (%)
Place of birth for the foreign-born population - Sri Lanka (%)
Place of birth for the foreign-born population - Uzbekistan (%)
Place of birth for the foreign-born population - Other South Central Asia (%)
Place of birth for the foreign-born population - Burma (%)
Place of birth for the foreign-born population - Cambodia (%)
Place of birth for the foreign-born population - Indonesia (%)
Place of birth for the foreign-born population - Laos (%)
Place of birth for the foreign-born population - Malaysia (%)
Place of birth for the foreign-born population - Philippines (%)
Place of birth for the foreign-born population - Singapore (%)
Place of birth for the foreign-born population - Thailand (%)
Place of birth for the foreign-born population - Vietnam (%)
Place of birth for the foreign-born population - Other South Eastern Asia (%)
Place of birth for the foreign-born population - Armenia (%)
Place of birth for the foreign-born population - Iraq (%)
Place of birth for the foreign-born population - Israel (%)
Place of birth for the foreign-born population - Jordan (%)
Place of birth for the foreign-born population - Kuwait (%)
Place of birth for the foreign-born population - Lebanon (%)
Place of birth for the foreign-born population - Saudi Arabia (%)
Place of birth for the foreign-born population - Syria (%)
Place of birth for the foreign-born population - Turkey (%)
Place of birth for the foreign-born population - Yemen (%)
Place of birth for the foreign-born population - Other Western Asia (%)
Place of birth for the foreign-born population - Eritrea (%)
Place of birth for the foreign-born population - Ethiopia (%)
Place of birth for the foreign-born population - Kenya (%)
Place of birth for the foreign-born population - Somalia (%)
Place of birth for the foreign-born population - Uganda (%)
Place of birth for the foreign-born population - Zimbabwe (%)
Place of birth for the foreign-born population - Other Eastern Africa (%)
Place of birth for the foreign-born population - Cameroon (%)
Place of birth for the foreign-born population - Congo (%)
Place of birth for the foreign-born population - Democratic Republic of Congo (Zaire) (%)
Place of birth for the foreign-born population - Other Middle Africa (%)
Place of birth for the foreign-born population - Egypt (%)
Place of birth for the foreign-born population - Morocco (%)
Place of birth for the foreign-born population - Sudan (%)
Place of birth for the foreign-born population - Other Northern Africa (%)
Place of birth for the foreign-born population - South Africa (%)
Place of birth for the foreign-born population - Other Southern Africa (%)
Place of birth for the foreign-born population - Cabo Verde (%)
Place of birth for the foreign-born population - Ghana (%)
Place of birth for the foreign-born population - Liberia (%)
Place of birth for the foreign-born population - Nigeria (%)
Place of birth for the foreign-born population - Senegal (%)
Place of birth for the foreign-born population - Sierra Leone (%)
Place of birth for the foreign-born population - Other Western Africa (%)
Place of birth for the foreign-born population - Australia (%)
Place of birth for the foreign-born population - New Zealand (%)
Place of birth for the foreign-born population - Fiji (%)
Place of birth for the foreign-born population - Micronesia (%)
Place of birth for the foreign-born population - Bahamas (%)
Place of birth for the foreign-born population - Barbados (%)
Place of birth for the foreign-born population - Cuba (%)
Place of birth for the foreign-born population - Dominica (%)
Place of birth for the foreign-born population - Dominican Republic (%)
Place of birth for the foreign-born population - Grenada (%)
Place of birth for the foreign-born population - Haiti (%)
Place of birth for the foreign-born population - Jamaica (%)
Place of birth for the foreign-born population - St. Vincent and the Grenadines (%)
Place of birth for the foreign-born population - Trinidad and Tobago (%)
Place of birth for the foreign-born population - West Indies (%)
Place of birth for the foreign-born population - Other Caribbean (%)
Place of birth for the foreign-born population - Belize (%)
Place of birth for the foreign-born population - Costa Rica (%)
Place of birth for the foreign-born population - El Salvador (%)
Place of birth for the foreign-born population - Guatemala (%)
Place of birth for the foreign-born population - Honduras (%)
Place of birth for the foreign-born population - Mexico (%)
Place of birth for the foreign-born population - Nicaragua (%)
Place of birth for the foreign-born population - Panama (%)
Place of birth for the foreign-born population - Other Central America (%)
Place of birth for the foreign-born population - Argentina (%)
Place of birth for the foreign-born population - Bolivia (%)
Place of birth for the foreign-born population - Brazil (%)
Place of birth for the foreign-born population - Chile (%)
Place of birth for the foreign-born population - Colombia (%)
Place of birth for the foreign-born population - Ecuador (%)
Place of birth for the foreign-born population - Guyana (%)
Place of birth for the foreign-born population - Peru (%)
Place of birth for the foreign-born population - Uruguay (%)
Place of birth for the foreign-born population - Venezuela (%)
Place of birth for the foreign-born population - Other South America (%)
Place of birth for the foreign-born population - Canada (%)
Place of birth for the foreign-born population - Other Northern America (%)
Place of birth for the foreign-born population - Other (%)
Latest news about races in Fuquay-Varina, NC collected exclusively by city-data.com from local newspapers, TV, and radio stations
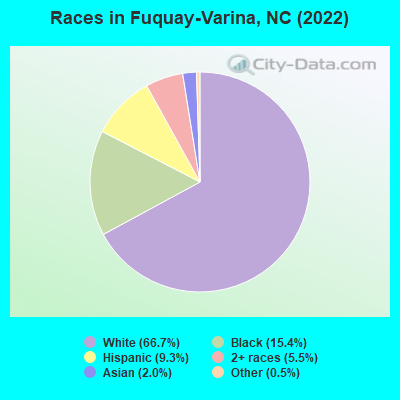
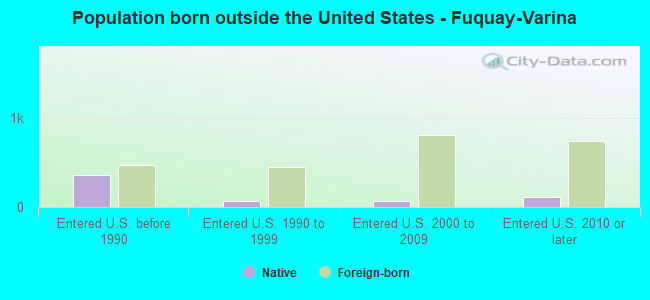
According to 2022 data, the most numerous races in Fuquay-Varina, NC are White alone (24,521 residents), Black alone (5,672 residents), and Hispanic (3,415 residents). 89.1% of Fuquay-Varina residents speak English at home. 6.5% of Fuquay-Varina, NC residents are foreign-born (2.9% born in Latin America, 1.4% born in Asia, 0.9% born in Africa, 0.9% born in Europe), which is 22.7% less than the foreign-born rate of 8.0% across the entire state of North Carolina.
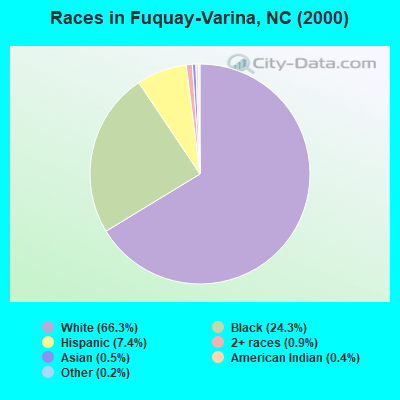
Race distribution in Fuquay-Varina
2000 2022
5,647,155 70.2% White alone 1,723,301 21.4% Black alone 378,963 4.7% Hispanic 112,416 1.4% Asian alone 95,333 1.2% American Indian alone 79,965 1.0% Two or more races 9,015 0.1% Other race alone 3,165 0.04% Native Hawaiian and Other
6,497,519 60.7% White alone 2,155,650 20.1% Black alone 1,114,799 10.4% Hispanic 438,061 4.1% Two or more races 341,052 3.2% Asian alone 91,758 0.9% American Indian alone 50,180 0.5% Other race alone 9,954 0.09% Native Hawaiian and Other
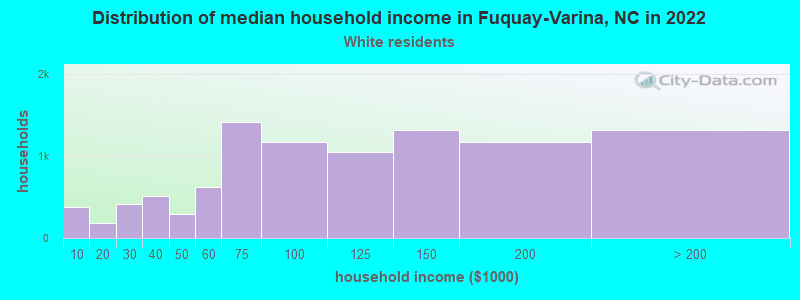
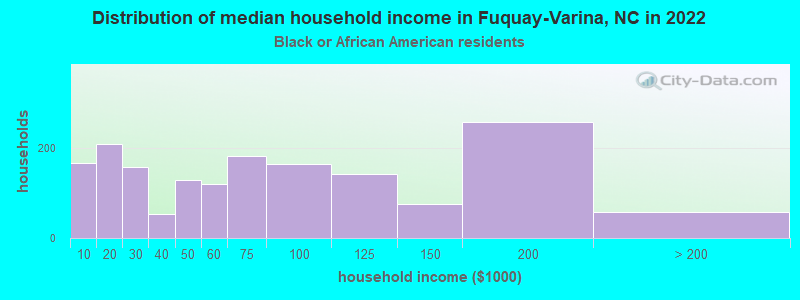
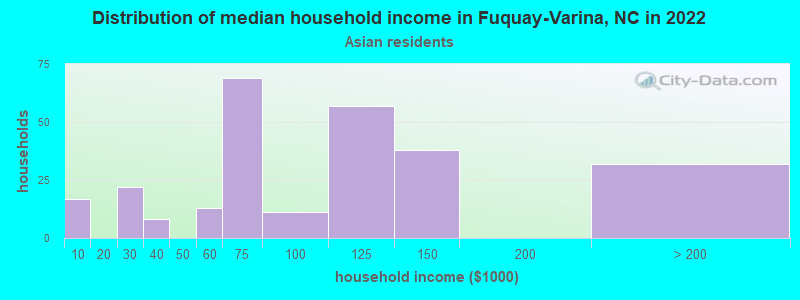
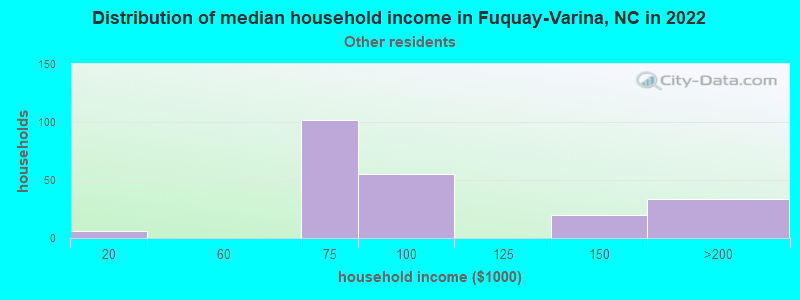
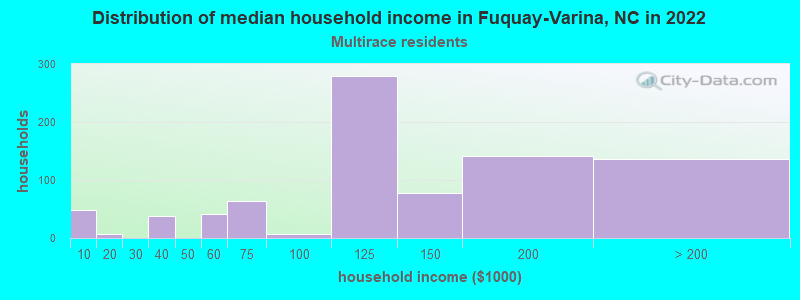
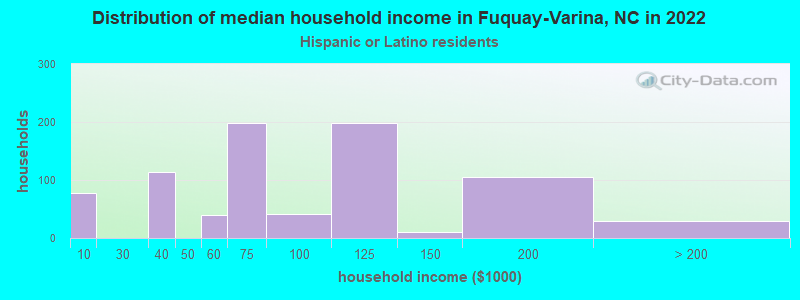
Income and house value in Fuquay-Varina Median household income in 2022 $98,749 White non-Hispanic householders$61,718 Black householders$86,070 Asian householders$120,566 Two or more races householders$81,897 Hispanic or Latino race householdersMedian 2022 house value $460,121 White Non-Hispanic householders$381,843 Black or African American householders$410,481 American Indian or Alaska Native householders $445,611 Asian householders$439,120 Some other race householders$477,304 Two or more races householders$445,611 Hispanic or Latino householders
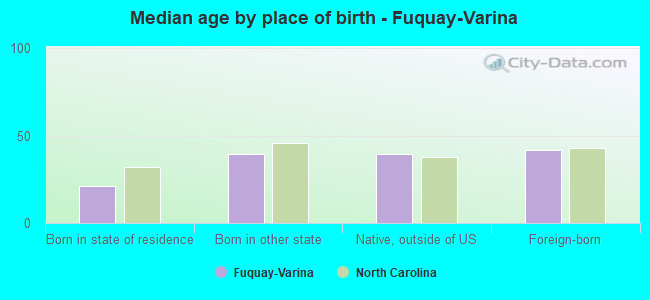
Median age by race in Fuquay-Varina
38.8 Median age for White residents37.1 39.6 32.6 Median age for Black or African American residents31.8 32.9 17.4 Median age for American Indian / Alaska Native residents11.5 39.6 44.5 Median age for Asian residents53.6 42.2 -609,884,331.7 Median age for Native Hawaiian / Pacific Islander residents-611,708,482.1 -612,403,100.2 31.5 Median age for Other race residents31.2 33.4 14.6 Median age for Two or more races residents14.3 15.4 38.9 Median age for White alone residents38.2 40.3 26.9 Median age for Hispanic or Latino residents27.1 26.6
Owner/renter occupied households by race in Fuquay-Varina
House owners and renters - White residents 7,304 75.0% Owner occupied2,431 25.0% Renter occupiedHouse owners and renters - Black or African American residents 931 52.8% Owner occupied831 47.2% Renter occupiedHouse owners and renters - American Indian / Alaska Native residents 2 100.0% Owner occupiedHouse owners and renters - Asian residents 249 97.0% Owner occupied8 3.0% Renter occupiedHouse owners and renters - Other race residents 108 44.3% Owner occupied135 55.7% Renter occupiedHouse owners and renters - Two or more races residents 683 84.3% Owner occupied127 15.7% Renter occupiedHouse owners and renters - White alone residents 7,195 75.0% Owner occupied2,399 25.0% Renter occupiedHouse owners and renters - Hispanic or Latino residents 533 69.9% Owner occupied229 30.1% Renter occupied
Language usage in Fuquay-Varina
English speakers - Total 89.1% of residents of Fuquay-Varina speak English at home.
5.8% of residents speak Spanish at home 1,540 77.5% Speak English very well448 22.5% Speak English less than very well4.3% of residents speak other language at home 1,101 75.6% Speak English very well356 24.4% Speak English less than very well
English speakers - Born in the United States 94.8% of residents of Fuquay-Varina speak English at home.
3.4% of residents speak Spanish at home 545 87.2% Speak English very well80 12.8% Speak English less than very well1.5% of residents speak other language at home 204 72.6% Speak English very well77 27.4% Speak English less than very well
English speakers - Native, born elsewhere 69.5% of residents of Fuquay-Varina speak English at home.
15.5% of residents speak Spanish at home 82 85.4% Speak English very well14 14.6% Speak English less than very well17.0% of residents speak other language at home 105 100.0% Speak English very well
English speakers - Foreign-born 23.5% of residents of Fuquay-Varina speak English at home.
39.1% of residents speak Spanish at home 663 67.2% Speak English very well323 32.8% Speak English less than very well37.3% of residents speak other language at home 652 69.4% Speak English very well288 30.6% Speak English less than very well
White (Caucasian) - Speak only English Native:
96.2% (21,928)Foreign-born:
38.4% (347)
White (Caucasian) - Speak another language Native:
3.7% (852)Foreign-born:
61.6% (556)
Black or African American - Speak only English Native:
98.7% (4,812)Foreign-born:
19.1% (51)
Black or African American - Speak another language Native:
0.9% (43)Foreign-born:
82.7% (222)
Asian - Speak only English Native:
29.2% (67)Foreign-born:
19.4% (111)
Asian - Speak another language Native:
72.1% (165)Foreign-born:
80.8% (463)
Other race - Speak another language Native:
6.4% (22)Foreign-born:
99.7% (345)
Two or more races - Speak only English Native:
88.0% (2,782)Foreign-born:
27.9% (94)
Two or more races - Speak another language Native:
12.2% (386)Foreign-born:
65.7% (220)
White alone - Speak only English Native:
98.0% (21,950)Foreign-born:
45.9% (309)
White alone - Speak another language Native:
1.9% (427)Foreign-born:
54.2% (364)
Hispanic or Latino - Speak only English Native:
62.0% (1,330)Foreign-born:
8.4% (78)
Hispanic or Latino - Speak another language Native:
40.2% (862)Foreign-born:
91.3% (847)
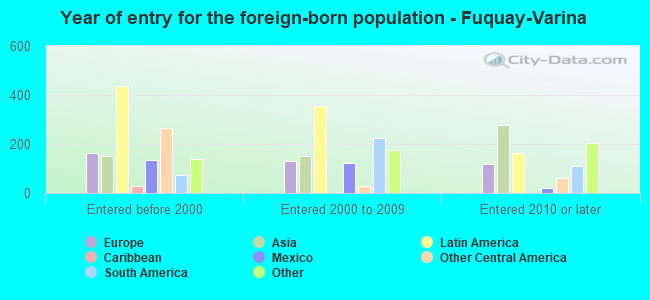
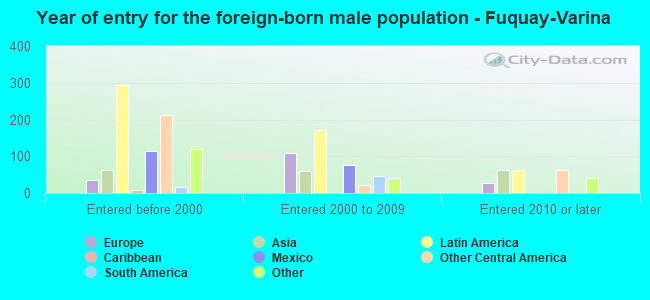
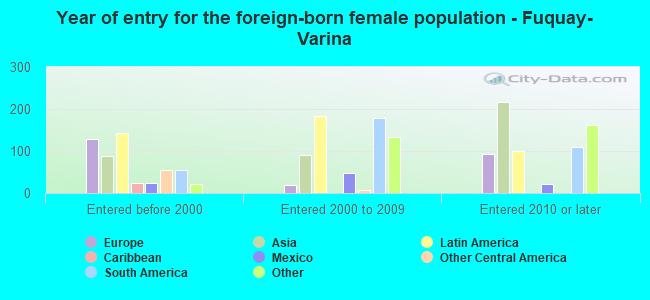
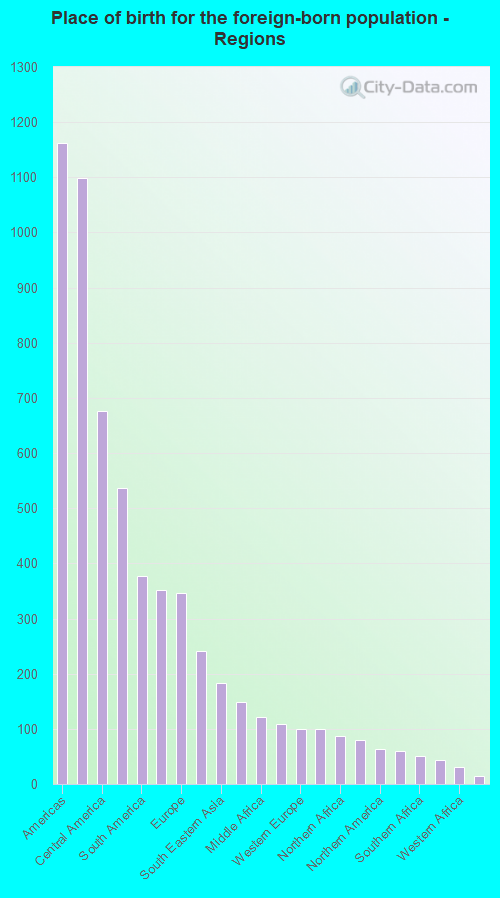
Foreign-born residents in Fuquay-Varina 2,397 residents are foreign born (2.9% Latin America , 1.4% Asia , 0.9% Africa , 0.9% Europe ).
This city:
6.5%North Carolina:
8.3%
Marital status for residents in Fuquay-Varina Marital status - White (Caucasian) population 15 years and over
Males 21.4% Never married71.7% Now married0.8% Separated1.0% Widowed5.1% DivorcedFemales 20.0% Never married61.4% Now married2.5% Separated6.3% Widowed9.8% DivorcedWomen who gave birth in the past 12 months Now married:
100.0% (216)Unmarried:
0.0% (0)
Women who did not give birth in the past 12 months Now married:
66.3% (4,083)Unmarried:
33.7% (2,071)
Marital status - Black or African American population 15 years and over
Males 57.0% Never married37.1% Now married2.9% Separated1.2% Widowed1.9% DivorcedFemales 45.9% Never married26.6% Now married3.1% Separated8.7% Widowed15.8% DivorcedWomen who gave birth in the past 12 months Now married:
11.8% (22)Unmarried:
88.2% (162)
Women who did not give birth in the past 12 months Now married:
22.5% (278)Unmarried:
77.5% (956)
Marital status - American Indian / Alaska Native population 15 years and over
Males 81.2% Never married18.8% Now married0.0% Separated0.0% Widowed0.0% DivorcedFemales 19.5% Never married80.5% Now married0.0% Separated0.0% Widowed0.0% DivorcedWomen who did not give birth in the past 12 months Now married:
72.6% (48)Unmarried:
27.4% (18)
Marital status - Asian population 15 years and over
Males 12.4% Never married64.9% Now married1.7% Separated5.8% Widowed15.3% DivorcedFemales 7.8% Never married63.2% Now married0.0% Separated4.9% Widowed24.1% DivorcedWomen who gave birth in the past 12 months Now married:
100.0% (9)Unmarried:
0.0% (0)
Women who did not give birth in the past 12 months Now married:
68.9% (197)Unmarried:
31.1% (89)
Marital status - Other race population 15 years and over
Males 62.4% Never married19.8% Now married11.0% Separated0.0% Widowed6.8% DivorcedFemales 29.4% Never married70.6% Now married0.0% Separated0.0% Widowed0.0% DivorcedWomen who did not give birth in the past 12 months Now married:
63.2% (51)Unmarried:
36.8% (30)
Marital status - Two or more races population 15 years and over
Males 30.3% Never married69.7% Now married0.0% Separated0.0% Widowed0.0% DivorcedFemales 36.2% Never married59.4% Now married0.0% Separated3.0% Widowed1.3% DivorcedWomen who gave birth in the past 12 months Now married:
100.0% (119)Unmarried:
0.0% (0)
Women who did not give birth in the past 12 months Now married:
52.9% (483)Unmarried:
47.1% (430)
Marital status - White alone, not Hispanic / Latino population 15 years and over
Males 21.7% Never married71.3% Now married0.8% Separated1.1% Widowed5.1% DivorcedFemales 19.9% Never married61.6% Now married2.6% Separated6.2% Widowed9.6% DivorcedWomen who gave birth in the past 12 months Now married:
100.0% (220)Unmarried:
0.0% (0)
Women who did not give birth in the past 12 months Now married:
66.4% (3,901)Unmarried:
33.6% (1,971)
Marital status - Hispanic or Latino population 15 years and over
Males 39.7% Never married51.0% Now married5.7% Separated0.0% Widowed3.5% DivorcedFemales 24.8% Never married61.5% Now married0.0% Separated6.6% Widowed7.1% DivorcedWomen who gave birth in the past 12 months Now married:
100.0% (8)Unmarried:
0.0% (0)
Women who did not give birth in the past 12 months Now married:
65.5% (557)Unmarried:
34.5% (293)
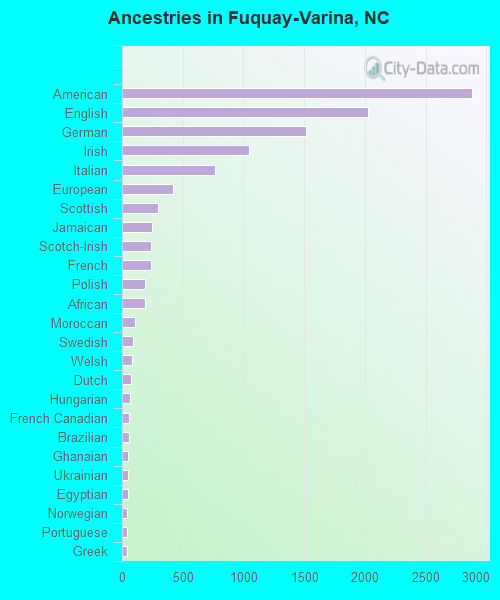
Ancestries in Fuquay-Varina
2,879 15.5% American2,025 10.9% English1,513 8.1% German1,042 5.6% Irish763 4.1% Italian416 2.2% European298 1.6% Scottish246 1.3% Jamaican242 1.3% Scotch-Irish235 1.3% French188 1.0% Polish188 1.0% African110 0.6% Moroccan87 0.5% Swedish81 0.4% Welsh78 0.4% Dutch64 0.3% Hungarian59 0.3% French Canadian56 0.3% Brazilian52 0.3% Ghanaian49 0.3% Ukrainian46 0.2% Egyptian45 0.2% Norwegian40 0.2% Portuguese38 0.2% Greek28 0.2% Icelander27 0.1% Slavic24 0.1% Finnish20 0.1% Austrian20 0.1% Albanian19 0.1% Kenyan16 0.09% Eastern European14 0.08% Croatian10 0.05% British10 0.05% Haitian6 0.03% Macedonian6 0.03% Carpatho Rusyn3 0.02% Iranian
Geographical mobility in Fuquay-Varina Same house 1 year ago 22,907 91.7% White (Caucasian)5,243 95.9% Black or African American131 100.0% American Indian / Alaska Native664 81.8% Asian691 95.4% Other race4,048 98.3% Two or more races22,551 92.6% White alone, not Hispanic / Latino2,952 86.1% Hispanic or LatinoMoved within same county 800 3.2% White / Caucasian72 1.3% Black or African American6 5.7% American Indian / Alaska Native92 11.3% Asian37 5.1% Other race112 2.7% Two or more races796 3.3% White alone, not Hispanic / Latino169 4.9% Hispanic or LatinoMoved within same state 411 1.6% White / Caucasian304 5.6% Black or African American2 0.3% Asian9 0.2% Two or more races405 1.7% White alone, not Hispanic / Latino16 0.5% Hispanic or LatinoMoved from different state 1,111 4.4% White / Caucasian29 0.5% Black or African American45 5.5% Asian36 0.9% Two or more races859 3.5% White alone, not Hispanic / Latino260 7.6% Hispanic or LatinoMoved from abroad 58 0.2% White1 0.0% Black or African American7 0.8% Asian26 0.6% Two or more races58 0.2% White alone, not Hispanic / Latino29 0.8% Hispanic or Latino
Children Nativity (place of birth) in Fuquay-Varina
Children under 6 years - Living with two parents Both parents native 2,378 100.0% Native1 0.0% Foreign-bornBoth parents foreign-born 191 100.0% NativeOne native, one foreign-born parent 80 90.1% Native9 9.9% Foreign-bornChildren under 6 years - Living with one parent Native parent 342 100.0% NativeForeign-born parent 8 100.0% NativeChildren 6 to 17 years - Living with two parents Both parents native 5,125 100.0% NativeBoth parents foreign-born 302 84.8% Native54 15.2% Foreign-bornOne native, one foreign-born parent 404 100.0% NativeChildren 6 to 17 years - Living with one parent Native parent 1,076 100.0% NativeForeign-born parent 26 52.0% Native24 48.0% Foreign-born
Grandparents responsible for own grandchildren in Fuquay-Varina
Grandparents (30 to 59 years) White / Caucasian 17 63.8% Responsible for grandchildren9 36.2% Not responsible for grandchildrenBlack or African American 94 100.0% Not responsible for grandchildrenAsian 9 57.5% Responsible for grandchildren6 42.5% Not responsible for grandchildrenWhite alone, not Hispanic / Latino 17 65.0% Responsible for grandchildren9 35.0% Not responsible for grandchildrenGrandparents (60 years and over) White / Caucasian 149 100.0% Not responsible for grandchildrenBlack or African American 14 21.5% Responsible for grandchildren52 78.5% Not responsible for grandchildrenAsian 50 100.0% Not responsible for grandchildrenWhite alone, not Hispanic / Latino 149 100.0% Not responsible for grandchildren