Races in Frostproof, Florida (FL) Detailed Stats
Data:
Races - White alone (%)
Races - White alone (% change since 2000)
Races - Black alone (%)
Races - Black alone (% change since 2000)
Races - American Indian alone (%)
Races - American Indian alone (% change since 2000)
Races - Asian alone (%)
Races - Asian alone (% change since 2000)
Races - Hispanic (%)
Races - Hispanic (% change since 2000)
Races - Native Hawaiian and Other Pacific Islander alone (%)
Races - Native Hawaiian and Other Pacific Islander alone (% change since 2000)
Races - Two or more races(%)
Races - Two or more races(% change since 2000)
Races - Other race alone (%)
Races - Other race alone (% change since 2000)
Racial diversity
Place of birth - Born in state of residence (%)
Place of birth - Born in state of residence (%) - White
Place of birth - Born in state of residence (%) - Black or African American
Place of birth - Born in state of residence (%) - Asian
Place of birth - Born in state of residence (%) - Hispanic or Latino
Place of birth - Born in state of residence (%) - American Indian and Alaska Native
Place of birth - Born in state of residence (%) - Multirace
Place of birth - Born in state of residence (%) - Other Race
Place of birth - Born in other state (%)
Place of birth - Born in other state (%) - White
Place of birth - Born in other state (%) - Black or African American
Place of birth - Born in other state (%) - Asian
Place of birth - Born in other state (%) - Hispanic or Latino
Place of birth - Born in other state (%) - American Indian and Alaska Native
Place of birth - Born in other state (%) - Multirace
Place of birth - Born in other state (%) - Other Race
Place of birth - Native, outside of US (%)
Place of birth - Native, outside of US (%) - White
Place of birth - Native, outside of US (%) - Black or African American
Place of birth - Native, outside of US (%) - Asian
Place of birth - Native, outside of US (%) - Hispanic or Latino
Place of birth - Native, outside of US (%) - American Indian and Alaska Native
Place of birth - Native, outside of US (%) - Multirace
Place of birth - Native, outside of US (%) - Other Race
Place of birth - Foreign born (%)
Place of birth - Foreign born (%) - White
Place of birth - Foreign born (%) - Black or African American
Place of birth - Foreign born (%) - Asian
Place of birth - Foreign born (%) - Hispanic or Latino
Place of birth - Foreign born (%) - American Indian and Alaska Native
Place of birth - Foreign born (%) - Multirace
Place of birth - Foreign born (%) - Other Race
Residents speaking English at home (%)
Residents speaking English at home - Born in the United States (%)
Residents speaking English at home - Native, born elsewhere (%)
Residents speaking English at home - Foreign born (%)
Residents speaking Spanish at home (%)
Residents speaking Spanish at home - Born in the United States (%)
Residents speaking Spanish at home - Native, born elsewhere (%)
Residents speaking Spanish at home - Foreign born (%)
Residents speaking other language at home (%)
Residents speaking other language at home - Born in the United States (%)
Residents speaking other language at home - Native, born elsewhere (%)
Residents speaking other language at home - Foreign born (%)
Marital status - Never married (%)
Marital status - Now married (%)
Marital status - Separated (%)
Marital status - Widowed (%)
Marital status - Divorced (%)
Ancestries Reported - Arab (%)
Ancestries Reported - Czech (%)
Ancestries Reported - Danish (%)
Ancestries Reported - Dutch (%)
Ancestries Reported - English (%)
Ancestries Reported - French (%)
Ancestries Reported - French Canadian (%)
Ancestries Reported - German (%)
Ancestries Reported - Greek (%)
Ancestries Reported - Hungarian (%)
Ancestries Reported - Irish (%)
Ancestries Reported - Italian (%)
Ancestries Reported - Lithuanian (%)
Ancestries Reported - Norwegian (%)
Ancestries Reported - Polish (%)
Ancestries Reported - Portuguese (%)
Ancestries Reported - Russian (%)
Ancestries Reported - Scotch-Irish (%)
Ancestries Reported - Scottish (%)
Ancestries Reported - Slovak (%)
Ancestries Reported - Subsaharan African (%)
Ancestries Reported - Swedish (%)
Ancestries Reported - Swiss (%)
Ancestries Reported - Ukrainian (%)
Ancestries Reported - United States (%)
Ancestries Reported - Welsh (%)
Ancestries Reported - West Indian (%)
Ancestries Reported - Other (%)
Geographical mobility - Same house 1 year ago (%)
Geographical mobility - Same house 1 year ago (%) - White
Geographical mobility - Same house 1 year ago (%) - Black or African American
Geographical mobility - Same house 1 year ago (%) - Asian
Geographical mobility - Same house 1 year ago (%) - Hispanic or Latino
Geographical mobility - Same house 1 year ago (%) - American Indian and Alaska Native
Geographical mobility - Same house 1 year ago (%) - Multirace
Geographical mobility - Same house 1 year ago (%) - Other Race
Geographical mobility - Moved within same county (%)
Geographical mobility - Moved within same county (%) - White
Geographical mobility - Moved within same county (%) - Black or African American
Geographical mobility - Moved within same county (%) - Asian
Geographical mobility - Moved within same county (%) - Hispanic or Latino
Geographical mobility - Moved within same county (%) - American Indian and Alaska Native
Geographical mobility - Moved within same county (%) - Multirace
Geographical mobility - Moved within same county (%) - Other Race
Geographical mobility - Moved from different county within same state (%)
Geographical mobility - Moved from different county within same state (%) - White
Geographical mobility - Moved from different county within same state (%) - Black or African American
Geographical mobility - Moved from different county within same state (%) - Asian
Geographical mobility - Moved from different county within same state (%) - Hispanic or Latino
Geographical mobility - Moved from different county within same state (%) - American Indian and Alaska Native
Geographical mobility - Moved from different county within same state (%) - Multirace
Geographical mobility - Moved from different county within same state (%) - Other Race
Geographical mobility - Moved from different state (%)
Geographical mobility - Moved from different state (%) - White
Geographical mobility - Moved from different state (%) - Black or African American
Geographical mobility - Moved from different state (%) - Asian
Geographical mobility - Moved from different state (%) - Hispanic or Latino
Geographical mobility - Moved from different state (%) - American Indian and Alaska Native
Geographical mobility - Moved from different state (%) - Multirace
Geographical mobility - Moved from different state (%) - Other Race
Geographical mobility - Moved from abroad (%)
Geographical mobility - Moved from abroad (%) - White
Geographical mobility - Moved from abroad (%) - Black or African American
Geographical mobility - Moved from abroad (%) - Asian
Geographical mobility - Moved from abroad (%) - Hispanic or Latino
Geographical mobility - Moved from abroad (%) - American Indian and Alaska Native
Geographical mobility - Moved from abroad (%) - Multirace
Geographical mobility - Moved from abroad (%) - Other Race
Place of birth for the foreign-born population - Ireland (%)
Place of birth for the foreign-born population - Denmark (%)
Place of birth for the foreign-born population - Norway (%)
Place of birth for the foreign-born population - Sweden (%)
Place of birth for the foreign-born population - United Kingdom (%)
Place of birth for the foreign-born population - England (%)
Place of birth for the foreign-born population - Scotland (%)
Place of birth for the foreign-born population - Other Northern Europe (%)
Place of birth for the foreign-born population - Austria (%)
Place of birth for the foreign-born population - Belgium (%)
Place of birth for the foreign-born population - France (%)
Place of birth for the foreign-born population - Germany (%)
Place of birth for the foreign-born population - Netherlands (%)
Place of birth for the foreign-born population - Switzerland (%)
Place of birth for the foreign-born population - Other Western Europe (%)
Place of birth for the foreign-born population - Greece (%)
Place of birth for the foreign-born population - Italy (%)
Place of birth for the foreign-born population - Portugal (%)
Place of birth for the foreign-born population - Spain (%)
Place of birth for the foreign-born population - Other Southern Europe (%)
Place of birth for the foreign-born population - Albania (%)
Place of birth for the foreign-born population - Belarus (%)
Place of birth for the foreign-born population - Bosnia and Herzegovina (%)
Place of birth for the foreign-born population - Bulgaria (%)
Place of birth for the foreign-born population - Croatia (%)
Place of birth for the foreign-born population - Czechoslovakia (%)
Place of birth for the foreign-born population - Hungary (%)
Place of birth for the foreign-born population - Latvia (%)
Place of birth for the foreign-born population - Lithuania (%)
Place of birth for the foreign-born population - North Macedonia (Macedonia) (%)
Place of birth for the foreign-born population - Moldova (%)
Place of birth for the foreign-born population - Poland (%)
Place of birth for the foreign-born population - Romania (%)
Place of birth for the foreign-born population - Russia (%)
Place of birth for the foreign-born population - Serbia (%)
Place of birth for the foreign-born population - Ukraine (%)
Place of birth for the foreign-born population - Other Eastern Europe (%)
Place of birth for the foreign-born population - China (%)
Place of birth for the foreign-born population - Hong Kong (%)
Place of birth for the foreign-born population - Taiwan (%)
Place of birth for the foreign-born population - Japan (%)
Place of birth for the foreign-born population - Korea (%)
Place of birth for the foreign-born population - Other Eastern Asia (%)
Place of birth for the foreign-born population - Afghanistan (%)
Place of birth for the foreign-born population - Bangladesh (%)
Place of birth for the foreign-born population - India (%)
Place of birth for the foreign-born population - Iran (%)
Place of birth for the foreign-born population - Kazakhstan (%)
Place of birth for the foreign-born population - Nepal (%)
Place of birth for the foreign-born population - Pakistan (%)
Place of birth for the foreign-born population - Sri Lanka (%)
Place of birth for the foreign-born population - Uzbekistan (%)
Place of birth for the foreign-born population - Other South Central Asia (%)
Place of birth for the foreign-born population - Burma (%)
Place of birth for the foreign-born population - Cambodia (%)
Place of birth for the foreign-born population - Indonesia (%)
Place of birth for the foreign-born population - Laos (%)
Place of birth for the foreign-born population - Malaysia (%)
Place of birth for the foreign-born population - Philippines (%)
Place of birth for the foreign-born population - Singapore (%)
Place of birth for the foreign-born population - Thailand (%)
Place of birth for the foreign-born population - Vietnam (%)
Place of birth for the foreign-born population - Other South Eastern Asia (%)
Place of birth for the foreign-born population - Armenia (%)
Place of birth for the foreign-born population - Iraq (%)
Place of birth for the foreign-born population - Israel (%)
Place of birth for the foreign-born population - Jordan (%)
Place of birth for the foreign-born population - Kuwait (%)
Place of birth for the foreign-born population - Lebanon (%)
Place of birth for the foreign-born population - Saudi Arabia (%)
Place of birth for the foreign-born population - Syria (%)
Place of birth for the foreign-born population - Turkey (%)
Place of birth for the foreign-born population - Yemen (%)
Place of birth for the foreign-born population - Other Western Asia (%)
Place of birth for the foreign-born population - Eritrea (%)
Place of birth for the foreign-born population - Ethiopia (%)
Place of birth for the foreign-born population - Kenya (%)
Place of birth for the foreign-born population - Somalia (%)
Place of birth for the foreign-born population - Uganda (%)
Place of birth for the foreign-born population - Zimbabwe (%)
Place of birth for the foreign-born population - Other Eastern Africa (%)
Place of birth for the foreign-born population - Cameroon (%)
Place of birth for the foreign-born population - Congo (%)
Place of birth for the foreign-born population - Democratic Republic of Congo (Zaire) (%)
Place of birth for the foreign-born population - Other Middle Africa (%)
Place of birth for the foreign-born population - Egypt (%)
Place of birth for the foreign-born population - Morocco (%)
Place of birth for the foreign-born population - Sudan (%)
Place of birth for the foreign-born population - Other Northern Africa (%)
Place of birth for the foreign-born population - South Africa (%)
Place of birth for the foreign-born population - Other Southern Africa (%)
Place of birth for the foreign-born population - Cabo Verde (%)
Place of birth for the foreign-born population - Ghana (%)
Place of birth for the foreign-born population - Liberia (%)
Place of birth for the foreign-born population - Nigeria (%)
Place of birth for the foreign-born population - Senegal (%)
Place of birth for the foreign-born population - Sierra Leone (%)
Place of birth for the foreign-born population - Other Western Africa (%)
Place of birth for the foreign-born population - Australia (%)
Place of birth for the foreign-born population - New Zealand (%)
Place of birth for the foreign-born population - Fiji (%)
Place of birth for the foreign-born population - Micronesia (%)
Place of birth for the foreign-born population - Bahamas (%)
Place of birth for the foreign-born population - Barbados (%)
Place of birth for the foreign-born population - Cuba (%)
Place of birth for the foreign-born population - Dominica (%)
Place of birth for the foreign-born population - Dominican Republic (%)
Place of birth for the foreign-born population - Grenada (%)
Place of birth for the foreign-born population - Haiti (%)
Place of birth for the foreign-born population - Jamaica (%)
Place of birth for the foreign-born population - St. Vincent and the Grenadines (%)
Place of birth for the foreign-born population - Trinidad and Tobago (%)
Place of birth for the foreign-born population - West Indies (%)
Place of birth for the foreign-born population - Other Caribbean (%)
Place of birth for the foreign-born population - Belize (%)
Place of birth for the foreign-born population - Costa Rica (%)
Place of birth for the foreign-born population - El Salvador (%)
Place of birth for the foreign-born population - Guatemala (%)
Place of birth for the foreign-born population - Honduras (%)
Place of birth for the foreign-born population - Mexico (%)
Place of birth for the foreign-born population - Nicaragua (%)
Place of birth for the foreign-born population - Panama (%)
Place of birth for the foreign-born population - Other Central America (%)
Place of birth for the foreign-born population - Argentina (%)
Place of birth for the foreign-born population - Bolivia (%)
Place of birth for the foreign-born population - Brazil (%)
Place of birth for the foreign-born population - Chile (%)
Place of birth for the foreign-born population - Colombia (%)
Place of birth for the foreign-born population - Ecuador (%)
Place of birth for the foreign-born population - Guyana (%)
Place of birth for the foreign-born population - Peru (%)
Place of birth for the foreign-born population - Uruguay (%)
Place of birth for the foreign-born population - Venezuela (%)
Place of birth for the foreign-born population - Other South America (%)
Place of birth for the foreign-born population - Canada (%)
Place of birth for the foreign-born population - Other Northern America (%)
Place of birth for the foreign-born population - Other (%)
Latest news about races in Frostproof, FL collected exclusively by city-data.com from local newspapers, TV, and radio stations
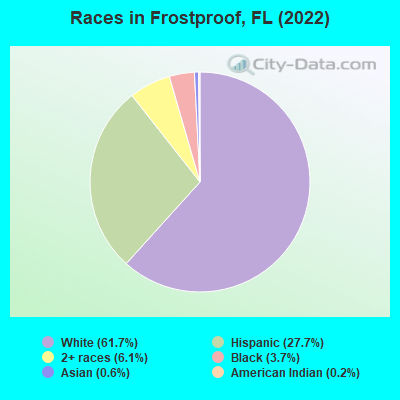
According to 2022 data, the most numerous races in Frostproof, FL are White alone (1,945 residents), Hispanic (872 residents), and Black alone (116 residents). 79.8% of Frostproof residents speak English at home. 7.3% of Frostproof, FL residents are foreign-born (5.1% born in Latin America, 2.3% born in Asia), which is 189.0% less than the foreign-born rate of 21.0% across the entire state of Florida.
Race distribution in Frostproof
2000 2022
10,458,509 65.4% White alone 2,682,715 16.8% Hispanic 2,264,268 14.2% Black alone 261,693 1.6% Asian alone 236,954 1.5% Two or more races 42,358 0.3% American Indian alone 28,994 0.2% Other race alone 6,887 0.04% Native Hawaiian and Other
11,309,403 50.8% White alone 6,025,039 27.1% Hispanic 3,241,015 14.6% Black alone 861,630 3.9% Two or more races 623,692 2.8% Asian alone 152,054 0.7% Other race alone 22,504 0.1% American Indian alone 9,486 0.04% Native Hawaiian and Other
Income and house value in Frostproof Median household income in 2022 $48,002 White non-Hispanic householders$26,707 Black householders$27,628 Some other race householders$70,993 Two or more races householders$32,724 Hispanic or Latino race householdersMedian 2022 house value $220,037 White Non-Hispanic householders$151,118 American Indian or Alaska Native householders $161,528 Asian householders$134,606 Some other race householders$141,785 Hispanic or Latino householders
Median age by race in Frostproof
61.1 Median age for White residents63.1 58.6 56.1 Median age for Black or African American residents40.4 57.7 25.5 Median age for American Indian / Alaska Native residents54.5 9.4 -691,075,514.2 Median age for Asian residents-651,924,651.3 -671,071,952.3 -679,849,340.2 Median age for Native Hawaiian / Pacific Islander residents-858,307,848.3 -443,298,968.6 20.5 Median age for Other race residents26.2 2.8 21.1 Median age for Two or more races residents47.1 15.8 59.2 Median age for White alone residents61.9 57.8 20.9 Median age for Hispanic or Latino residents27.6 19.4
Owner/renter occupied households by race in Frostproof
House owners and renters - White residents 677 77.8% Owner occupied193 22.2% Renter occupiedHouse owners and renters - Black or African American residents 25 40.5% Owner occupied37 59.5% Renter occupiedHouse owners and renters - American Indian / Alaska Native residents 21 100.0% Owner occupiedHouse owners and renters - Asian residents 19 100.0% Owner occupiedHouse owners and renters - Other race residents 35 21.5% Owner occupied127 78.5% Renter occupiedHouse owners and renters - Two or more races residents 93 73.4% Owner occupied34 26.6% Renter occupiedHouse owners and renters - White alone residents 645 76.0% Owner occupied203 24.0% Renter occupiedHouse owners and renters - Hispanic or Latino residents 169 56.9% Owner occupied128 43.1% Renter occupied
Language usage in Frostproof
English speakers - Total 79.8% of residents of Frostproof speak English at home.
17.3% of residents speak Spanish at home 214 43.9% Speak English very well274 56.1% Speak English less than very well2.2% of residents speak other language at home 12 19.4% Speak English very well50 80.6% Speak English less than very well
English speakers - Born in the United States 94.7% of residents of Frostproof speak English at home.
5.5% of residents speak Spanish at home 42 70.0% Speak English very well18 30.0% Speak English less than very well
English speakers - Native, born elsewhere 55.0% of residents of Frostproof speak English at home.
45.8% of residents speak Spanish at home 14 12.8% Speak English very well95 87.2% Speak English less than very well
English speakers - Foreign-born 24.2% of residents of Frostproof speak English at home.
53.2% of residents speak Spanish at home 36 25.5% Speak English very well105 74.5% Speak English less than very well24.9% of residents speak other language at home 11 16.7% Speak English very well55 83.3% Speak English less than very well
White (Caucasian) - Speak another language Native:
1.6% (29)Foreign-born:
72.2% (27)
Black or African American - Speak only English Native:
100.0% (68)Foreign-born:
90.4% (38)
Other race - Speak another language Native:
61.5% (198)Foreign-born:
100.0% (14)
Two or more races - Speak another language Native:
38.5% (143)Foreign-born:
93.7% (156)
White alone - Speak another language Native:
0.4% (7)Foreign-born:
79.1% (5)
Hispanic or Latino - Speak another language Native:
62.3% (331)Foreign-born:
99.3% (140)
Foreign-born residents in Frostproof 229 residents are foreign born (5.1% Latin America , 2.3% Asia ).
This city:
7.3%Florida:
21.1%
Marital status for residents in Frostproof Marital status - White (Caucasian) population 15 years and over
Males 12.7% Never married49.0% Now married4.2% Separated18.7% Widowed15.5% DivorcedFemales 15.4% Never married41.9% Now married7.4% Separated15.2% Widowed20.1% DivorcedWomen who gave birth in the past 12 months Now married:
75.0% (8)Unmarried:
25.0% (3)
Women who did not give birth in the past 12 months Now married:
44.1% (128)Unmarried:
55.9% (162)
Marital status - Black or African American population 15 years and over
Males 20.4% Never married44.9% Now married0.0% Separated0.0% Widowed34.7% DivorcedFemales 21.3% Never married40.4% Now married0.0% Separated0.0% Widowed38.3% DivorcedWomen who did not give birth in the past 12 months Now married:
100.0% (11)Unmarried:
0.0% (0)
Marital status - American Indian / Alaska Native population 15 years and over
Males 38.1% Never married33.3% Now married0.0% Separated0.0% Widowed28.6% DivorcedFemales 0.0% Never married100.0% Now married0.0% Separated0.0% Widowed0.0% DivorcedWomen who did not give birth in the past 12 months Now married:
100.0% (10)Unmarried:
0.0% (0)
Marital status - Other race population 15 years and over
Males 90.2% Never married9.8% Now married0.0% Separated0.0% Widowed0.0% DivorcedFemales 77.8% Never married11.1% Now married0.0% Separated11.1% Widowed0.0% DivorcedWomen who did not give birth in the past 12 months Now married:
12.5% (18)Unmarried:
87.5% (123)
Marital status - Two or more races population 15 years and over
Males 30.4% Never married41.9% Now married0.0% Separated27.7% Widowed0.0% DivorcedFemales 70.8% Never married24.8% Now married0.0% Separated0.0% Widowed4.4% DivorcedWomen who gave birth in the past 12 months Now married:
0.0% (0)Unmarried:
100.0% (20)
Women who did not give birth in the past 12 months Now married:
17.3% (28)Unmarried:
82.7% (134)
Marital status - White alone, not Hispanic / Latino population 15 years and over
Males 12.8% Never married48.7% Now married4.2% Separated18.9% Widowed15.3% DivorcedFemales 15.6% Never married44.3% Now married8.1% Separated13.1% Widowed18.8% DivorcedWomen who gave birth in the past 12 months Now married:
75.0% (9)Unmarried:
25.0% (3)
Women who did not give birth in the past 12 months Now married:
47.7% (134)Unmarried:
52.3% (147)
Marital status - Hispanic or Latino population 15 years and over
Males 65.0% Never married29.9% Now married0.0% Separated3.7% Widowed1.4% DivorcedFemales 48.1% Never married24.6% Now married0.0% Separated16.2% Widowed11.2% DivorcedWomen who gave birth in the past 12 months Now married:
0.0% (0)Unmarried:
100.0% (14)
Women who did not give birth in the past 12 months Now married:
26.3% (56)Unmarried:
73.7% (157)
Ancestries in Frostproof
336 23.1% American262 18.0% English160 11.0% Scottish100 6.9% Irish48 3.3% European43 3.0% Syrian41 2.8% German35 2.4% Jamaican32 2.2% Italian23 1.6% Scotch-Irish14 1.0% French9 0.6% Russian6 0.4% Arab1 0.07% Maltese
Children Nativity (place of birth) in Frostproof
Children under 6 years - Living with two parents Both parents native 49 100.0% NativeBoth parents foreign-born 11 100.0% NativeOne native, one foreign-born parent 19 100.0% NativeChildren under 6 years - Living with one parent Native parent 249 100.0% NativeForeign-born parent 19 100.0% NativeChildren 6 to 17 years - Living with two parents Both parents native 72 100.0% NativeBoth parents foreign-born 65 100.0% NativeOne native, one foreign-born parent 14 100.0% NativeChildren 6 to 17 years - Living with one parent Native parent 130 100.0% NativeForeign-born parent 11 48.9% Native12 51.1% Foreign-born
Grandparents responsible for own grandchildren in Frostproof
Grandparents (30 to 59 years) White / Caucasian 17 100.0% Not responsible for grandchildrenBlack or African American 5 100.0% Not responsible for grandchildrenWhite alone, not Hispanic / Latino 22 100.0% Not responsible for grandchildrenGrandparents (60 years and over) White / Caucasian 45 62.0% Responsible for grandchildren28 38.0% Not responsible for grandchildrenWhite alone, not Hispanic / Latino 53 64.8% Responsible for grandchildren29 35.2% Not responsible for grandchildren