Races in Friendship Village, Maryland (MD) Detailed Stats
Ancestries, Foreign-born residents, place of birth

Discuss Friendship Village, Maryland races on our local forum with over 2,400,000 registered users
36.5% of Friendship Village, MD residents are foreign-born (14.3% born in Asia, 10.6% born in Europe, 6.5% born in Latin America, 4.6% born in Africa), which is 56.2% greater than the foreign-born rate of 16.0% across the entire state of Maryland.
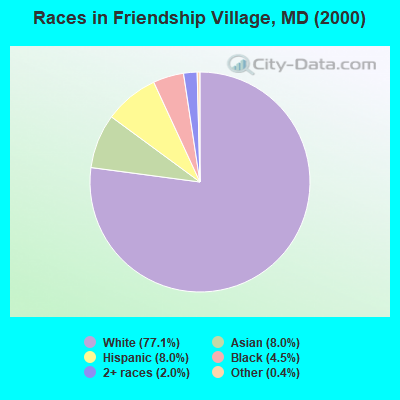
Race distribution in Friendship Village

- 3,47877.1%White alone
- 3598.0%Hispanic
- 3618.0%Asian alone
- 2044.5%Black alone
- 912.0%Two or more races
- 160.4%Other race alone
- 20.04%American Indian alone
- 10.02%Native Hawaiian and Other
Pacific Islander alone
2000
2022
-
- 3,286,54762.1%White alone
- 1,464,73527.7%Black alone
- 227,9164.3%Hispanic
- 209,7384.0%Asian alone
- 82,9461.6%Two or more races
- 13,3120.3%American Indian alone
- 9,3790.2%Other race alone
- 1,9130.04%Native Hawaiian and Other
Pacific Islander alone

-
- 2,906,49247.1%White alone
- 1,800,91429.2%Black alone
- 705,84211.4%Hispanic
- 401,8186.5%Asian alone
- 291,3174.7%Two or more races
- 46,9300.8%Other race alone
- 8,9300.1%American Indian alone
- 2,4170.04%Native Hawaiian and Other
Pacific Islander alone

Income and house value in Friendship Village
- Median household income in 2022
- $113,167White non-Hispanic householders
- $120,140Black householders
- $99,727Asian householders
- $78,996Some other race householders
- $92,109Two or more races householders
- $68,418Hispanic or Latino race householders
- Median 2022 house value
- over $1,000,000White Non-Hispanic householders
- $655,982Black or African American householders
- $247,815Hispanic or Latino householders
Household income for White non-Hispanic householders

Household income for Black householders

Household income for Asian householders

Household income for Two or more races householders

Household income for Hispanic or Latino race householders

Foreign-born residents in Friendship Village
1,648 residents are foreign born (14.3% Asia, 10.6% Europe, 6.5% Latin America, 4.6% Africa).
| This city: | 36.5% |
| Maryland: | 9.8% |
Ancestries in Friendship Village

- 1,67333.8%Other
- 4689.5%German
- 4338.8%Irish
- 3196.5%English
- 2625.3%Italian
- 2535.1%Russian
- 2114.3%Arab
- 1943.9%French
- 1763.6%Polish
- 1452.9%United States
- 1182.4%Subsaharan African
- 1112.2%Greek
- 972.0%Scottish
- 701.4%Ukrainian
- 661.3%Hungarian
- 661.3%Scotch-Irish
- 581.2%Swedish
- 551.1%Czech
- 350.7%Lithuanian
- 330.7%Norwegian
- 200.4%Dutch
- 200.4%West Indian
- 170.3%Danish
- 170.3%Welsh
- 100.2%Portuguese
- 100.2%Slovak
- 80.2%French Canadian

Zip codes: 20815.