Races in Friendship Heights Village, Maryland (MD) Detailed Stats
Data:
Races - White alone (%)
Races - White alone (% change since 2000)
Races - Black alone (%)
Races - Black alone (% change since 2000)
Races - American Indian alone (%)
Races - American Indian alone (% change since 2000)
Races - Asian alone (%)
Races - Asian alone (% change since 2000)
Races - Hispanic (%)
Races - Hispanic (% change since 2000)
Races - Native Hawaiian and Other Pacific Islander alone (%)
Races - Native Hawaiian and Other Pacific Islander alone (% change since 2000)
Races - Two or more races(%)
Races - Two or more races(% change since 2000)
Races - Other race alone (%)
Races - Other race alone (% change since 2000)
Racial diversity
Place of birth - Born in state of residence (%)
Place of birth - Born in state of residence (%) - White
Place of birth - Born in state of residence (%) - Black or African American
Place of birth - Born in state of residence (%) - Asian
Place of birth - Born in state of residence (%) - Hispanic or Latino
Place of birth - Born in state of residence (%) - American Indian and Alaska Native
Place of birth - Born in state of residence (%) - Multirace
Place of birth - Born in state of residence (%) - Other Race
Place of birth - Born in other state (%)
Place of birth - Born in other state (%) - White
Place of birth - Born in other state (%) - Black or African American
Place of birth - Born in other state (%) - Asian
Place of birth - Born in other state (%) - Hispanic or Latino
Place of birth - Born in other state (%) - American Indian and Alaska Native
Place of birth - Born in other state (%) - Multirace
Place of birth - Born in other state (%) - Other Race
Place of birth - Native, outside of US (%)
Place of birth - Native, outside of US (%) - White
Place of birth - Native, outside of US (%) - Black or African American
Place of birth - Native, outside of US (%) - Asian
Place of birth - Native, outside of US (%) - Hispanic or Latino
Place of birth - Native, outside of US (%) - American Indian and Alaska Native
Place of birth - Native, outside of US (%) - Multirace
Place of birth - Native, outside of US (%) - Other Race
Place of birth - Foreign born (%)
Place of birth - Foreign born (%) - White
Place of birth - Foreign born (%) - Black or African American
Place of birth - Foreign born (%) - Asian
Place of birth - Foreign born (%) - Hispanic or Latino
Place of birth - Foreign born (%) - American Indian and Alaska Native
Place of birth - Foreign born (%) - Multirace
Place of birth - Foreign born (%) - Other Race
Residents speaking English at home (%)
Residents speaking English at home - Born in the United States (%)
Residents speaking English at home - Native, born elsewhere (%)
Residents speaking English at home - Foreign born (%)
Residents speaking Spanish at home (%)
Residents speaking Spanish at home - Born in the United States (%)
Residents speaking Spanish at home - Native, born elsewhere (%)
Residents speaking Spanish at home - Foreign born (%)
Residents speaking other language at home (%)
Residents speaking other language at home - Born in the United States (%)
Residents speaking other language at home - Native, born elsewhere (%)
Residents speaking other language at home - Foreign born (%)
Marital status - Never married (%)
Marital status - Now married (%)
Marital status - Separated (%)
Marital status - Widowed (%)
Marital status - Divorced (%)
Ancestries Reported - Arab (%)
Ancestries Reported - Czech (%)
Ancestries Reported - Danish (%)
Ancestries Reported - Dutch (%)
Ancestries Reported - English (%)
Ancestries Reported - French (%)
Ancestries Reported - French Canadian (%)
Ancestries Reported - German (%)
Ancestries Reported - Greek (%)
Ancestries Reported - Hungarian (%)
Ancestries Reported - Irish (%)
Ancestries Reported - Italian (%)
Ancestries Reported - Lithuanian (%)
Ancestries Reported - Norwegian (%)
Ancestries Reported - Polish (%)
Ancestries Reported - Portuguese (%)
Ancestries Reported - Russian (%)
Ancestries Reported - Scotch-Irish (%)
Ancestries Reported - Scottish (%)
Ancestries Reported - Slovak (%)
Ancestries Reported - Subsaharan African (%)
Ancestries Reported - Swedish (%)
Ancestries Reported - Swiss (%)
Ancestries Reported - Ukrainian (%)
Ancestries Reported - United States (%)
Ancestries Reported - Welsh (%)
Ancestries Reported - West Indian (%)
Ancestries Reported - Other (%)
Geographical mobility - Same house 1 year ago (%)
Geographical mobility - Same house 1 year ago (%) - White
Geographical mobility - Same house 1 year ago (%) - Black or African American
Geographical mobility - Same house 1 year ago (%) - Asian
Geographical mobility - Same house 1 year ago (%) - Hispanic or Latino
Geographical mobility - Same house 1 year ago (%) - American Indian and Alaska Native
Geographical mobility - Same house 1 year ago (%) - Multirace
Geographical mobility - Same house 1 year ago (%) - Other Race
Geographical mobility - Moved within same county (%)
Geographical mobility - Moved within same county (%) - White
Geographical mobility - Moved within same county (%) - Black or African American
Geographical mobility - Moved within same county (%) - Asian
Geographical mobility - Moved within same county (%) - Hispanic or Latino
Geographical mobility - Moved within same county (%) - American Indian and Alaska Native
Geographical mobility - Moved within same county (%) - Multirace
Geographical mobility - Moved within same county (%) - Other Race
Geographical mobility - Moved from different county within same state (%)
Geographical mobility - Moved from different county within same state (%) - White
Geographical mobility - Moved from different county within same state (%) - Black or African American
Geographical mobility - Moved from different county within same state (%) - Asian
Geographical mobility - Moved from different county within same state (%) - Hispanic or Latino
Geographical mobility - Moved from different county within same state (%) - American Indian and Alaska Native
Geographical mobility - Moved from different county within same state (%) - Multirace
Geographical mobility - Moved from different county within same state (%) - Other Race
Geographical mobility - Moved from different state (%)
Geographical mobility - Moved from different state (%) - White
Geographical mobility - Moved from different state (%) - Black or African American
Geographical mobility - Moved from different state (%) - Asian
Geographical mobility - Moved from different state (%) - Hispanic or Latino
Geographical mobility - Moved from different state (%) - American Indian and Alaska Native
Geographical mobility - Moved from different state (%) - Multirace
Geographical mobility - Moved from different state (%) - Other Race
Geographical mobility - Moved from abroad (%)
Geographical mobility - Moved from abroad (%) - White
Geographical mobility - Moved from abroad (%) - Black or African American
Geographical mobility - Moved from abroad (%) - Asian
Geographical mobility - Moved from abroad (%) - Hispanic or Latino
Geographical mobility - Moved from abroad (%) - American Indian and Alaska Native
Geographical mobility - Moved from abroad (%) - Multirace
Geographical mobility - Moved from abroad (%) - Other Race
Place of birth for the foreign-born population - Ireland (%)
Place of birth for the foreign-born population - Denmark (%)
Place of birth for the foreign-born population - Norway (%)
Place of birth for the foreign-born population - Sweden (%)
Place of birth for the foreign-born population - United Kingdom (%)
Place of birth for the foreign-born population - England (%)
Place of birth for the foreign-born population - Scotland (%)
Place of birth for the foreign-born population - Other Northern Europe (%)
Place of birth for the foreign-born population - Austria (%)
Place of birth for the foreign-born population - Belgium (%)
Place of birth for the foreign-born population - France (%)
Place of birth for the foreign-born population - Germany (%)
Place of birth for the foreign-born population - Netherlands (%)
Place of birth for the foreign-born population - Switzerland (%)
Place of birth for the foreign-born population - Other Western Europe (%)
Place of birth for the foreign-born population - Greece (%)
Place of birth for the foreign-born population - Italy (%)
Place of birth for the foreign-born population - Portugal (%)
Place of birth for the foreign-born population - Spain (%)
Place of birth for the foreign-born population - Other Southern Europe (%)
Place of birth for the foreign-born population - Albania (%)
Place of birth for the foreign-born population - Belarus (%)
Place of birth for the foreign-born population - Bosnia and Herzegovina (%)
Place of birth for the foreign-born population - Bulgaria (%)
Place of birth for the foreign-born population - Croatia (%)
Place of birth for the foreign-born population - Czechoslovakia (%)
Place of birth for the foreign-born population - Hungary (%)
Place of birth for the foreign-born population - Latvia (%)
Place of birth for the foreign-born population - Lithuania (%)
Place of birth for the foreign-born population - North Macedonia (Macedonia) (%)
Place of birth for the foreign-born population - Moldova (%)
Place of birth for the foreign-born population - Poland (%)
Place of birth for the foreign-born population - Romania (%)
Place of birth for the foreign-born population - Russia (%)
Place of birth for the foreign-born population - Serbia (%)
Place of birth for the foreign-born population - Ukraine (%)
Place of birth for the foreign-born population - Other Eastern Europe (%)
Place of birth for the foreign-born population - China (%)
Place of birth for the foreign-born population - Hong Kong (%)
Place of birth for the foreign-born population - Taiwan (%)
Place of birth for the foreign-born population - Japan (%)
Place of birth for the foreign-born population - Korea (%)
Place of birth for the foreign-born population - Other Eastern Asia (%)
Place of birth for the foreign-born population - Afghanistan (%)
Place of birth for the foreign-born population - Bangladesh (%)
Place of birth for the foreign-born population - India (%)
Place of birth for the foreign-born population - Iran (%)
Place of birth for the foreign-born population - Kazakhstan (%)
Place of birth for the foreign-born population - Nepal (%)
Place of birth for the foreign-born population - Pakistan (%)
Place of birth for the foreign-born population - Sri Lanka (%)
Place of birth for the foreign-born population - Uzbekistan (%)
Place of birth for the foreign-born population - Other South Central Asia (%)
Place of birth for the foreign-born population - Burma (%)
Place of birth for the foreign-born population - Cambodia (%)
Place of birth for the foreign-born population - Indonesia (%)
Place of birth for the foreign-born population - Laos (%)
Place of birth for the foreign-born population - Malaysia (%)
Place of birth for the foreign-born population - Philippines (%)
Place of birth for the foreign-born population - Singapore (%)
Place of birth for the foreign-born population - Thailand (%)
Place of birth for the foreign-born population - Vietnam (%)
Place of birth for the foreign-born population - Other South Eastern Asia (%)
Place of birth for the foreign-born population - Armenia (%)
Place of birth for the foreign-born population - Iraq (%)
Place of birth for the foreign-born population - Israel (%)
Place of birth for the foreign-born population - Jordan (%)
Place of birth for the foreign-born population - Kuwait (%)
Place of birth for the foreign-born population - Lebanon (%)
Place of birth for the foreign-born population - Saudi Arabia (%)
Place of birth for the foreign-born population - Syria (%)
Place of birth for the foreign-born population - Turkey (%)
Place of birth for the foreign-born population - Yemen (%)
Place of birth for the foreign-born population - Other Western Asia (%)
Place of birth for the foreign-born population - Eritrea (%)
Place of birth for the foreign-born population - Ethiopia (%)
Place of birth for the foreign-born population - Kenya (%)
Place of birth for the foreign-born population - Somalia (%)
Place of birth for the foreign-born population - Uganda (%)
Place of birth for the foreign-born population - Zimbabwe (%)
Place of birth for the foreign-born population - Other Eastern Africa (%)
Place of birth for the foreign-born population - Cameroon (%)
Place of birth for the foreign-born population - Congo (%)
Place of birth for the foreign-born population - Democratic Republic of Congo (Zaire) (%)
Place of birth for the foreign-born population - Other Middle Africa (%)
Place of birth for the foreign-born population - Egypt (%)
Place of birth for the foreign-born population - Morocco (%)
Place of birth for the foreign-born population - Sudan (%)
Place of birth for the foreign-born population - Other Northern Africa (%)
Place of birth for the foreign-born population - South Africa (%)
Place of birth for the foreign-born population - Other Southern Africa (%)
Place of birth for the foreign-born population - Cabo Verde (%)
Place of birth for the foreign-born population - Ghana (%)
Place of birth for the foreign-born population - Liberia (%)
Place of birth for the foreign-born population - Nigeria (%)
Place of birth for the foreign-born population - Senegal (%)
Place of birth for the foreign-born population - Sierra Leone (%)
Place of birth for the foreign-born population - Other Western Africa (%)
Place of birth for the foreign-born population - Australia (%)
Place of birth for the foreign-born population - New Zealand (%)
Place of birth for the foreign-born population - Fiji (%)
Place of birth for the foreign-born population - Micronesia (%)
Place of birth for the foreign-born population - Bahamas (%)
Place of birth for the foreign-born population - Barbados (%)
Place of birth for the foreign-born population - Cuba (%)
Place of birth for the foreign-born population - Dominica (%)
Place of birth for the foreign-born population - Dominican Republic (%)
Place of birth for the foreign-born population - Grenada (%)
Place of birth for the foreign-born population - Haiti (%)
Place of birth for the foreign-born population - Jamaica (%)
Place of birth for the foreign-born population - St. Vincent and the Grenadines (%)
Place of birth for the foreign-born population - Trinidad and Tobago (%)
Place of birth for the foreign-born population - West Indies (%)
Place of birth for the foreign-born population - Other Caribbean (%)
Place of birth for the foreign-born population - Belize (%)
Place of birth for the foreign-born population - Costa Rica (%)
Place of birth for the foreign-born population - El Salvador (%)
Place of birth for the foreign-born population - Guatemala (%)
Place of birth for the foreign-born population - Honduras (%)
Place of birth for the foreign-born population - Mexico (%)
Place of birth for the foreign-born population - Nicaragua (%)
Place of birth for the foreign-born population - Panama (%)
Place of birth for the foreign-born population - Other Central America (%)
Place of birth for the foreign-born population - Argentina (%)
Place of birth for the foreign-born population - Bolivia (%)
Place of birth for the foreign-born population - Brazil (%)
Place of birth for the foreign-born population - Chile (%)
Place of birth for the foreign-born population - Colombia (%)
Place of birth for the foreign-born population - Ecuador (%)
Place of birth for the foreign-born population - Guyana (%)
Place of birth for the foreign-born population - Peru (%)
Place of birth for the foreign-born population - Uruguay (%)
Place of birth for the foreign-born population - Venezuela (%)
Place of birth for the foreign-born population - Other South America (%)
Place of birth for the foreign-born population - Canada (%)
Place of birth for the foreign-born population - Other Northern America (%)
Place of birth for the foreign-born population - Other (%)
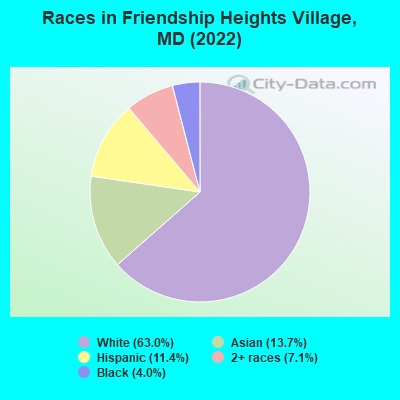
According to 2022 data, the most numerous races in Friendship Heights Village, MD are White alone (2,706 residents), Black alone (171 residents), and Hispanic (489 residents). 69.5% of Friendship Heights Village residents speak English at home.
Race distribution in Friendship Heights Village 2,706 63.0% White alone 590 13.7% Asian alone 489 11.4% Hispanic 305 7.1% Two or more races 171 4.0% Black alone
2000 2022
3,286,547 62.1% White alone 1,464,735 27.7% Black alone 227,916 4.3% Hispanic 209,738 4.0% Asian alone 82,946 1.6% Two or more races 13,312 0.3% American Indian alone 9,379 0.2% Other race alone 1,913 0.04% Native Hawaiian and Other
2,906,492 47.1% White alone 1,800,914 29.2% Black alone 705,842 11.4% Hispanic 401,818 6.5% Asian alone 291,317 4.7% Two or more races 46,930 0.8% Other race alone 8,930 0.1% American Indian alone 2,417 0.04% Native Hawaiian and Other
Income and house value in Friendship Heights Village Median household income in 2022 $110,257 White non-Hispanic householders$191,027 Black householders$101,461 Asian householders$147,697 Hispanic or Latino race householders
Median age by race in Friendship Heights Village
54.7 Median age for White residents53.6 61.9 57.1 Median age for Black or African American residents42.9 57.3 26.8 Median age for American Indian / Alaska Native residents-555,555,555.0 -671,704,449.4 33.2 Median age for Asian residents42.2 30.1 -763,333,332.6 Median age for Native Hawaiian / Pacific Islander residents-720,061,021.4 -760,942,760.2 26.5 Median age for Other race residents-668,796,591.5 -635,318,703.6 50.6 Median age for Two or more races residents50.4 51.5 60.9 Median age for White alone residents59.3 62.3 51.0 Median age for Hispanic or Latino residents52.0 46.1
Owner/renter occupied households by race in Friendship Heights Village
House owners and renters - White residents 801 43.7% Owner occupied1,032 56.3% Renter occupiedHouse owners and renters - Black or African American residents 82 49.0% Owner occupied86 51.0% Renter occupiedHouse owners and renters - American Indian / Alaska Native residents 17 100.0% Renter occupiedHouse owners and renters - Asian residents 108 33.0% Owner occupied219 67.0% Renter occupiedHouse owners and renters - Other race residents 20 100.0% Renter occupiedHouse owners and renters - Two or more races residents 74 29.3% Owner occupied180 70.7% Renter occupiedHouse owners and renters - White alone residents 793 43.7% Owner occupied1,022 56.3% Renter occupiedHouse owners and renters - Hispanic or Latino residents 64 34.6% Owner occupied122 65.4% Renter occupied
Language usage in Friendship Heights Village
English speakers - Total 69.5% of residents of Friendship Heights Village speak English at home.
11.0% of residents speak Spanish at home 339 75.0% Speak English very well113 25.0% Speak English less than very well18.7% of residents speak other language at home 665 86.0% Speak English very well108 14.0% Speak English less than very well
English speakers - Born in the United States 88.3% of residents of Friendship Heights Village speak English at home.
8.1% of residents speak Spanish at home 191 86.0% Speak English very well31 14.0% Speak English less than very well3.3% of residents speak other language at home 92 100.0% Speak English very well
English speakers - Native, born elsewhere 55.4% of residents of Friendship Heights Village speak English at home.
23.1% of residents speak Spanish at home 15 100.0% Speak English very well15.4% of residents speak other language at home 10 100.0% Speak English very well
English speakers - Foreign-born 20.0% of residents of Friendship Heights Village speak English at home.
17.7% of residents speak Spanish at home 130 68.1% Speak English very well61 31.9% Speak English less than very well62.0% of residents speak other language at home 564 84.2% Speak English very well106 15.8% Speak English less than very well
White (Caucasian) - Speak only English Native:
91.4% (2,113)Foreign-born:
24.7% (113)
White (Caucasian) - Speak another language Native:
8.2% (190)Foreign-born:
76.0% (348)
Black or African American - Speak only English Native:
98.7% (135)Foreign-born:
85.0% (29)
Asian - Speak only English Native:
79.8% (148)Foreign-born:
18.1% (53)
Asian - Speak another language Native:
13.7% (25)Foreign-born:
82.2% (241)
Other race - Speak another language Native:
55.8% (28)Foreign-born:
100.0% (18)
Two or more races - Speak only English Native:
75.8% (212)Foreign-born:
20.3% (29)
Two or more races - Speak another language Native:
21.5% (60)Foreign-born:
80.3% (113)
White alone - Speak only English Native:
94.6% (2,099)Foreign-born:
18.3% (91)
White alone - Speak another language Native:
5.4% (121)Foreign-born:
82.2% (410)
Hispanic or Latino - Speak only English Native:
19.9% (47)Foreign-born:
10.0% (22)
Hispanic or Latino - Speak another language Native:
79.0% (185)Foreign-born:
89.5% (196)
Foreign-born residents in Friendship Heights Village
Marital status for residents in Friendship Heights Village Marital status - White (Caucasian) population 15 years and over
Males 28.7% Never married56.0% Now married0.8% Separated5.7% Widowed8.9% DivorcedFemales 29.9% Never married37.2% Now married1.7% Separated14.9% Widowed16.3% DivorcedWomen who gave birth in the past 12 months Now married:
100.0% (10)Unmarried:
0.0% (0)
Women who did not give birth in the past 12 months Now married:
41.3% (310)Unmarried:
58.7% (440)
Marital status - Black or African American population 15 years and over
Males 74.2% Never married0.0% Now married0.0% Separated0.0% Widowed25.8% DivorcedFemales 69.1% Never married0.0% Now married0.0% Separated14.5% Widowed16.4% DivorcedWomen who did not give birth in the past 12 months Now married:
0.0% (0)Unmarried:
100.0% (22)
Marital status - American Indian / Alaska Native population 15 years and over
Males 0.0% Never married0.0% Now married100.0% Separated0.0% Widowed0.0% DivorcedFemales 100.0% Never married0.0% Now married0.0% Separated0.0% Widowed0.0% DivorcedWomen who did not give birth in the past 12 months Now married:
0.0% (0)Unmarried:
100.0% (18)
Marital status - Asian population 15 years and over
Males 46.4% Never married44.9% Now married0.0% Separated0.0% Widowed8.7% DivorcedFemales 48.3% Never married14.1% Now married10.4% Separated24.2% Widowed3.0% DivorcedWomen who did not give birth in the past 12 months Now married:
30.7% (50)Unmarried:
69.3% (113)
Marital status - Other race population 15 years and over
Males 57.6% Never married42.4% Now married0.0% Separated0.0% Widowed0.0% DivorcedFemales 100.0% Never married0.0% Now married0.0% Separated0.0% Widowed0.0% DivorcedWomen who did not give birth in the past 12 months Now married:
0.0% (0)Unmarried:
100.0% (15)
Marital status - Two or more races population 15 years and over
Males 24.5% Never married62.2% Now married0.0% Separated0.0% Widowed13.3% DivorcedFemales 47.9% Never married43.1% Now married0.0% Separated0.0% Widowed9.0% DivorcedWomen who did not give birth in the past 12 months Now married:
24.6% (38)Unmarried:
75.4% (117)
Marital status - White alone, not Hispanic / Latino population 15 years and over
Males 32.1% Never married50.6% Now married0.9% Separated6.4% Widowed10.0% DivorcedFemales 31.2% Never married34.8% Now married1.8% Separated14.8% Widowed17.4% DivorcedWomen who did not give birth in the past 12 months Now married:
36.9% (273)Unmarried:
63.1% (466)
Marital status - Hispanic or Latino population 15 years and over
Males 10.3% Never married81.4% Now married8.3% Separated0.0% Widowed0.0% DivorcedFemales 25.7% Never married65.0% Now married0.0% Separated9.3% Widowed0.0% DivorcedWomen who gave birth in the past 12 months Now married:
100.0% (12)Unmarried:
0.0% (0)
Women who did not give birth in the past 12 months Now married:
67.2% (80)Unmarried:
32.8% (39)
Ancestries in Friendship Heights Village
229 10.3% European192 8.6% Iranian153 6.9% Irish151 6.8% German57 2.6% Eastern European52 2.3% Polish50 2.2% French48 2.2% American41 1.8% Turkish39 1.7% British36 1.6% English35 1.6% Italian35 1.6% Russian34 1.5% Albanian31 1.4% Latvian23 1.0% South African22 1.0% Lebanese22 1.0% Romanian20 0.9% Ukrainian18 0.8% African17 0.8% Lithuanian17 0.8% Ghanaian14 0.6% Danish14 0.6% Scandinavian11 0.5% Norwegian10 0.4% Armenian9 0.4% Greek8 0.4% Moroccan8 0.4% Guyanese6 0.3% Canadian4 0.2% Dutch
Children Nativity (place of birth) in Friendship Heights Village
Children under 6 years - Living with two parents Both parents native 125 100.0% NativeBoth parents foreign-born 13 100.0% NativeOne native, one foreign-born parent 16 100.0% NativeChildren under 6 years - Living with one parent Native parent 21 100.0% NativeForeign-born parent 22 100.0% NativeChildren 6 to 17 years - Living with two parents Both parents native 112 100.0% Native0 0.0% Foreign-bornBoth parents foreign-born 36 70.7% Native15 29.3% Foreign-born