Races in Fridley, Minnesota (MN) Detailed Stats
Data:
Races - White alone (%)
Races - White alone (% change since 2000)
Races - Black alone (%)
Races - Black alone (% change since 2000)
Races - American Indian alone (%)
Races - American Indian alone (% change since 2000)
Races - Asian alone (%)
Races - Asian alone (% change since 2000)
Races - Hispanic (%)
Races - Hispanic (% change since 2000)
Races - Native Hawaiian and Other Pacific Islander alone (%)
Races - Native Hawaiian and Other Pacific Islander alone (% change since 2000)
Races - Two or more races(%)
Races - Two or more races(% change since 2000)
Races - Other race alone (%)
Races - Other race alone (% change since 2000)
Racial diversity
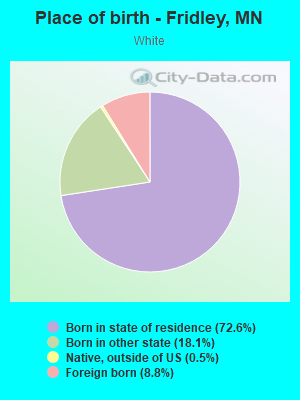
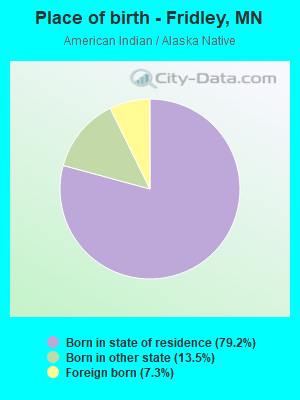
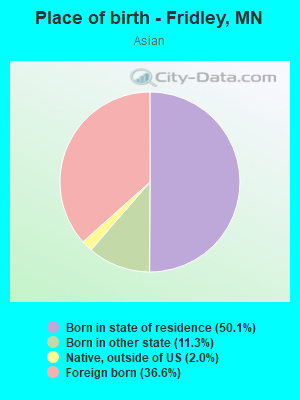
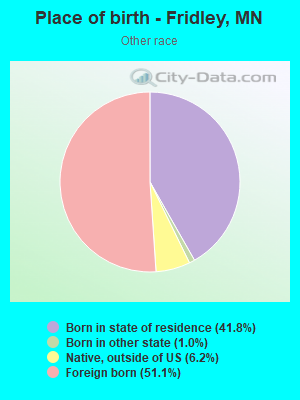
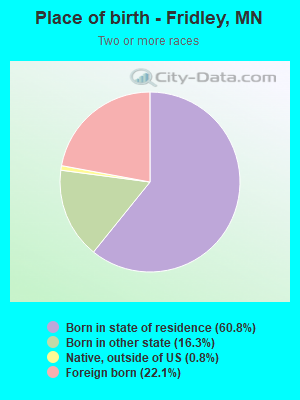
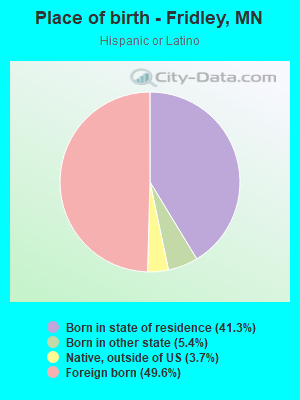
Place of birth - Born in state of residence (%)
Place of birth - Born in state of residence (%) - White
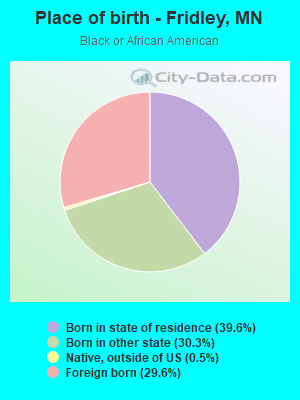
Place of birth - Born in state of residence (%) - Black or African American
Place of birth - Born in state of residence (%) - Asian
Place of birth - Born in state of residence (%) - Hispanic or Latino
Place of birth - Born in state of residence (%) - American Indian and Alaska Native
Place of birth - Born in state of residence (%) - Multirace
Place of birth - Born in state of residence (%) - Other Race
Place of birth - Born in other state (%)
Place of birth - Born in other state (%) - White
Place of birth - Born in other state (%) - Black or African American
Place of birth - Born in other state (%) - Asian
Place of birth - Born in other state (%) - Hispanic or Latino
Place of birth - Born in other state (%) - American Indian and Alaska Native
Place of birth - Born in other state (%) - Multirace
Place of birth - Born in other state (%) - Other Race
Place of birth - Native, outside of US (%)
Place of birth - Native, outside of US (%) - White
Place of birth - Native, outside of US (%) - Black or African American
Place of birth - Native, outside of US (%) - Asian
Place of birth - Native, outside of US (%) - Hispanic or Latino
Place of birth - Native, outside of US (%) - American Indian and Alaska Native
Place of birth - Native, outside of US (%) - Multirace
Place of birth - Native, outside of US (%) - Other Race
Place of birth - Foreign born (%)
Place of birth - Foreign born (%) - White
Place of birth - Foreign born (%) - Black or African American
Place of birth - Foreign born (%) - Asian
Place of birth - Foreign born (%) - Hispanic or Latino
Place of birth - Foreign born (%) - American Indian and Alaska Native
Place of birth - Foreign born (%) - Multirace
Place of birth - Foreign born (%) - Other Race
Residents speaking English at home (%)
Residents speaking English at home - Born in the United States (%)
Residents speaking English at home - Native, born elsewhere (%)
Residents speaking English at home - Foreign born (%)
Residents speaking Spanish at home (%)
Residents speaking Spanish at home - Born in the United States (%)
Residents speaking Spanish at home - Native, born elsewhere (%)
Residents speaking Spanish at home - Foreign born (%)
Residents speaking other language at home (%)
Residents speaking other language at home - Born in the United States (%)
Residents speaking other language at home - Native, born elsewhere (%)
Residents speaking other language at home - Foreign born (%)
Marital status - Never married (%)
Marital status - Now married (%)
Marital status - Separated (%)
Marital status - Widowed (%)
Marital status - Divorced (%)
Ancestries Reported - Arab (%)
Ancestries Reported - Czech (%)
Ancestries Reported - Danish (%)
Ancestries Reported - Dutch (%)
Ancestries Reported - English (%)
Ancestries Reported - French (%)
Ancestries Reported - French Canadian (%)
Ancestries Reported - German (%)
Ancestries Reported - Greek (%)
Ancestries Reported - Hungarian (%)
Ancestries Reported - Irish (%)
Ancestries Reported - Italian (%)
Ancestries Reported - Lithuanian (%)
Ancestries Reported - Norwegian (%)
Ancestries Reported - Polish (%)
Ancestries Reported - Portuguese (%)
Ancestries Reported - Russian (%)
Ancestries Reported - Scotch-Irish (%)
Ancestries Reported - Scottish (%)
Ancestries Reported - Slovak (%)
Ancestries Reported - Subsaharan African (%)
Ancestries Reported - Swedish (%)
Ancestries Reported - Swiss (%)
Ancestries Reported - Ukrainian (%)
Ancestries Reported - United States (%)
Ancestries Reported - Welsh (%)
Ancestries Reported - West Indian (%)
Ancestries Reported - Other (%)
Geographical mobility - Same house 1 year ago (%)
Geographical mobility - Same house 1 year ago (%) - White
Geographical mobility - Same house 1 year ago (%) - Black or African American
Geographical mobility - Same house 1 year ago (%) - Asian
Geographical mobility - Same house 1 year ago (%) - Hispanic or Latino
Geographical mobility - Same house 1 year ago (%) - American Indian and Alaska Native
Geographical mobility - Same house 1 year ago (%) - Multirace
Geographical mobility - Same house 1 year ago (%) - Other Race
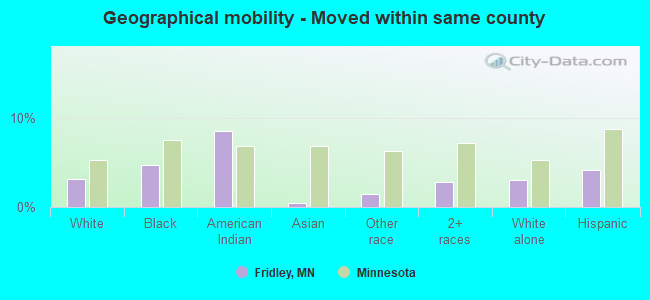
Geographical mobility - Moved within same county (%)
Geographical mobility - Moved within same county (%) - White
Geographical mobility - Moved within same county (%) - Black or African American
Geographical mobility - Moved within same county (%) - Asian
Geographical mobility - Moved within same county (%) - Hispanic or Latino
Geographical mobility - Moved within same county (%) - American Indian and Alaska Native
Geographical mobility - Moved within same county (%) - Multirace
Geographical mobility - Moved within same county (%) - Other Race
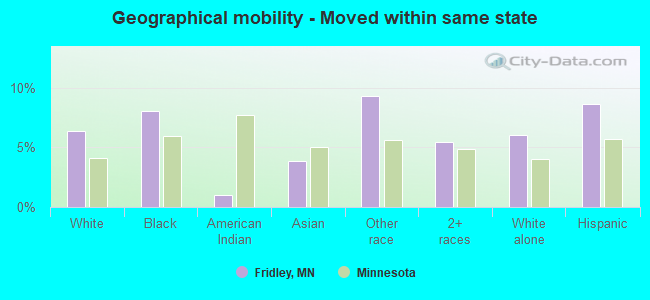
Geographical mobility - Moved from different county within same state (%)
Geographical mobility - Moved from different county within same state (%) - White
Geographical mobility - Moved from different county within same state (%) - Black or African American
Geographical mobility - Moved from different county within same state (%) - Asian
Geographical mobility - Moved from different county within same state (%) - Hispanic or Latino
Geographical mobility - Moved from different county within same state (%) - American Indian and Alaska Native
Geographical mobility - Moved from different county within same state (%) - Multirace
Geographical mobility - Moved from different county within same state (%) - Other Race
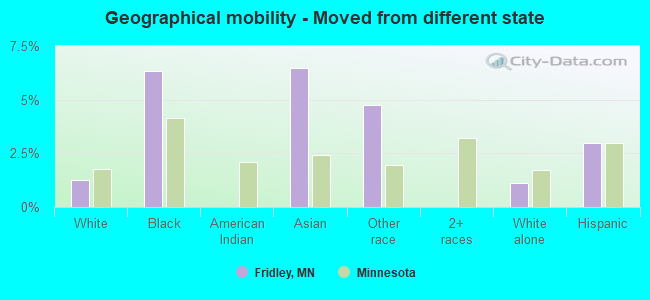
Geographical mobility - Moved from different state (%)
Geographical mobility - Moved from different state (%) - White
Geographical mobility - Moved from different state (%) - Black or African American
Geographical mobility - Moved from different state (%) - Asian
Geographical mobility - Moved from different state (%) - Hispanic or Latino
Geographical mobility - Moved from different state (%) - American Indian and Alaska Native
Geographical mobility - Moved from different state (%) - Multirace
Geographical mobility - Moved from different state (%) - Other Race
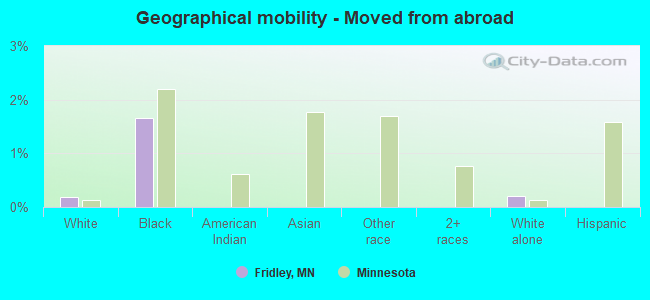
Geographical mobility - Moved from abroad (%)
Geographical mobility - Moved from abroad (%) - White
Geographical mobility - Moved from abroad (%) - Black or African American
Geographical mobility - Moved from abroad (%) - Asian
Geographical mobility - Moved from abroad (%) - Hispanic or Latino
Geographical mobility - Moved from abroad (%) - American Indian and Alaska Native
Geographical mobility - Moved from abroad (%) - Multirace
Geographical mobility - Moved from abroad (%) - Other Race
Place of birth for the foreign-born population - Ireland (%)
Place of birth for the foreign-born population - Denmark (%)
Place of birth for the foreign-born population - Norway (%)
Place of birth for the foreign-born population - Sweden (%)
Place of birth for the foreign-born population - United Kingdom (%)
Place of birth for the foreign-born population - England (%)
Place of birth for the foreign-born population - Scotland (%)
Place of birth for the foreign-born population - Other Northern Europe (%)
Place of birth for the foreign-born population - Austria (%)
Place of birth for the foreign-born population - Belgium (%)
Place of birth for the foreign-born population - France (%)
Place of birth for the foreign-born population - Germany (%)
Place of birth for the foreign-born population - Netherlands (%)
Place of birth for the foreign-born population - Switzerland (%)
Place of birth for the foreign-born population - Other Western Europe (%)
Place of birth for the foreign-born population - Greece (%)
Place of birth for the foreign-born population - Italy (%)
Place of birth for the foreign-born population - Portugal (%)
Place of birth for the foreign-born population - Spain (%)
Place of birth for the foreign-born population - Other Southern Europe (%)
Place of birth for the foreign-born population - Albania (%)
Place of birth for the foreign-born population - Belarus (%)
Place of birth for the foreign-born population - Bosnia and Herzegovina (%)
Place of birth for the foreign-born population - Bulgaria (%)
Place of birth for the foreign-born population - Croatia (%)
Place of birth for the foreign-born population - Czechoslovakia (%)
Place of birth for the foreign-born population - Hungary (%)
Place of birth for the foreign-born population - Latvia (%)
Place of birth for the foreign-born population - Lithuania (%)
Place of birth for the foreign-born population - North Macedonia (Macedonia) (%)
Place of birth for the foreign-born population - Moldova (%)
Place of birth for the foreign-born population - Poland (%)
Place of birth for the foreign-born population - Romania (%)
Place of birth for the foreign-born population - Russia (%)
Place of birth for the foreign-born population - Serbia (%)
Place of birth for the foreign-born population - Ukraine (%)
Place of birth for the foreign-born population - Other Eastern Europe (%)
Place of birth for the foreign-born population - China (%)
Place of birth for the foreign-born population - Hong Kong (%)
Place of birth for the foreign-born population - Taiwan (%)
Place of birth for the foreign-born population - Japan (%)
Place of birth for the foreign-born population - Korea (%)
Place of birth for the foreign-born population - Other Eastern Asia (%)
Place of birth for the foreign-born population - Afghanistan (%)
Place of birth for the foreign-born population - Bangladesh (%)
Place of birth for the foreign-born population - India (%)
Place of birth for the foreign-born population - Iran (%)
Place of birth for the foreign-born population - Kazakhstan (%)
Place of birth for the foreign-born population - Nepal (%)
Place of birth for the foreign-born population - Pakistan (%)
Place of birth for the foreign-born population - Sri Lanka (%)
Place of birth for the foreign-born population - Uzbekistan (%)
Place of birth for the foreign-born population - Other South Central Asia (%)
Place of birth for the foreign-born population - Burma (%)
Place of birth for the foreign-born population - Cambodia (%)
Place of birth for the foreign-born population - Indonesia (%)
Place of birth for the foreign-born population - Laos (%)
Place of birth for the foreign-born population - Malaysia (%)
Place of birth for the foreign-born population - Philippines (%)
Place of birth for the foreign-born population - Singapore (%)
Place of birth for the foreign-born population - Thailand (%)
Place of birth for the foreign-born population - Vietnam (%)
Place of birth for the foreign-born population - Other South Eastern Asia (%)
Place of birth for the foreign-born population - Armenia (%)
Place of birth for the foreign-born population - Iraq (%)
Place of birth for the foreign-born population - Israel (%)
Place of birth for the foreign-born population - Jordan (%)
Place of birth for the foreign-born population - Kuwait (%)
Place of birth for the foreign-born population - Lebanon (%)
Place of birth for the foreign-born population - Saudi Arabia (%)
Place of birth for the foreign-born population - Syria (%)
Place of birth for the foreign-born population - Turkey (%)
Place of birth for the foreign-born population - Yemen (%)
Place of birth for the foreign-born population - Other Western Asia (%)
Place of birth for the foreign-born population - Eritrea (%)
Place of birth for the foreign-born population - Ethiopia (%)
Place of birth for the foreign-born population - Kenya (%)
Place of birth for the foreign-born population - Somalia (%)
Place of birth for the foreign-born population - Uganda (%)
Place of birth for the foreign-born population - Zimbabwe (%)
Place of birth for the foreign-born population - Other Eastern Africa (%)
Place of birth for the foreign-born population - Cameroon (%)
Place of birth for the foreign-born population - Congo (%)
Place of birth for the foreign-born population - Democratic Republic of Congo (Zaire) (%)
Place of birth for the foreign-born population - Other Middle Africa (%)
Place of birth for the foreign-born population - Egypt (%)
Place of birth for the foreign-born population - Morocco (%)
Place of birth for the foreign-born population - Sudan (%)
Place of birth for the foreign-born population - Other Northern Africa (%)
Place of birth for the foreign-born population - South Africa (%)
Place of birth for the foreign-born population - Other Southern Africa (%)
Place of birth for the foreign-born population - Cabo Verde (%)
Place of birth for the foreign-born population - Ghana (%)
Place of birth for the foreign-born population - Liberia (%)
Place of birth for the foreign-born population - Nigeria (%)
Place of birth for the foreign-born population - Senegal (%)
Place of birth for the foreign-born population - Sierra Leone (%)
Place of birth for the foreign-born population - Other Western Africa (%)
Place of birth for the foreign-born population - Australia (%)
Place of birth for the foreign-born population - New Zealand (%)
Place of birth for the foreign-born population - Fiji (%)
Place of birth for the foreign-born population - Micronesia (%)
Place of birth for the foreign-born population - Bahamas (%)
Place of birth for the foreign-born population - Barbados (%)
Place of birth for the foreign-born population - Cuba (%)
Place of birth for the foreign-born population - Dominica (%)
Place of birth for the foreign-born population - Dominican Republic (%)
Place of birth for the foreign-born population - Grenada (%)
Place of birth for the foreign-born population - Haiti (%)
Place of birth for the foreign-born population - Jamaica (%)
Place of birth for the foreign-born population - St. Vincent and the Grenadines (%)
Place of birth for the foreign-born population - Trinidad and Tobago (%)
Place of birth for the foreign-born population - West Indies (%)
Place of birth for the foreign-born population - Other Caribbean (%)
Place of birth for the foreign-born population - Belize (%)
Place of birth for the foreign-born population - Costa Rica (%)
Place of birth for the foreign-born population - El Salvador (%)
Place of birth for the foreign-born population - Guatemala (%)
Place of birth for the foreign-born population - Honduras (%)
Place of birth for the foreign-born population - Mexico (%)
Place of birth for the foreign-born population - Nicaragua (%)
Place of birth for the foreign-born population - Panama (%)
Place of birth for the foreign-born population - Other Central America (%)
Place of birth for the foreign-born population - Argentina (%)
Place of birth for the foreign-born population - Bolivia (%)
Place of birth for the foreign-born population - Brazil (%)
Place of birth for the foreign-born population - Chile (%)
Place of birth for the foreign-born population - Colombia (%)
Place of birth for the foreign-born population - Ecuador (%)
Place of birth for the foreign-born population - Guyana (%)
Place of birth for the foreign-born population - Peru (%)
Place of birth for the foreign-born population - Uruguay (%)
Place of birth for the foreign-born population - Venezuela (%)
Place of birth for the foreign-born population - Other South America (%)
Place of birth for the foreign-born population - Canada (%)
Place of birth for the foreign-born population - Other Northern America (%)
Place of birth for the foreign-born population - Other (%)
Latest news about races in Fridley, MN collected exclusively by city-data.com from local newspapers, TV, and radio stations
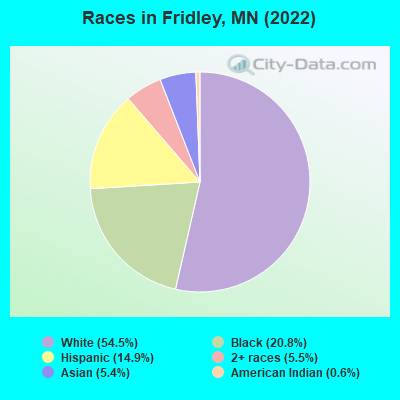
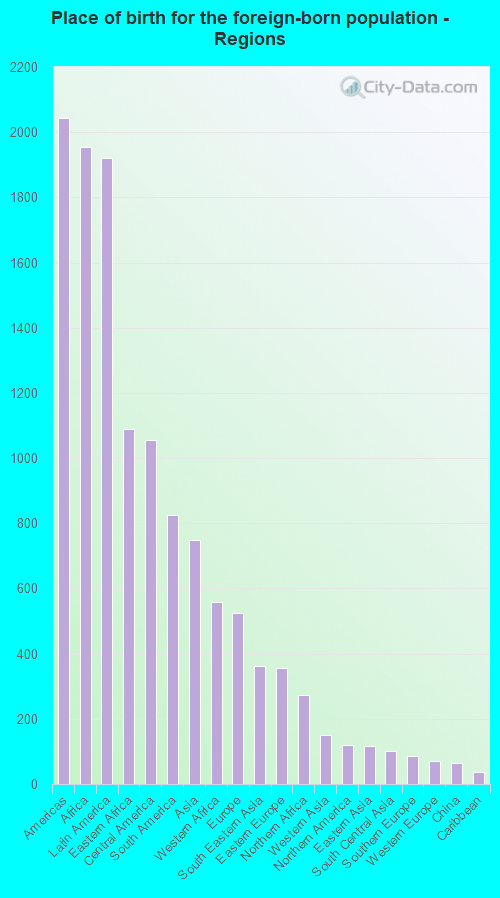
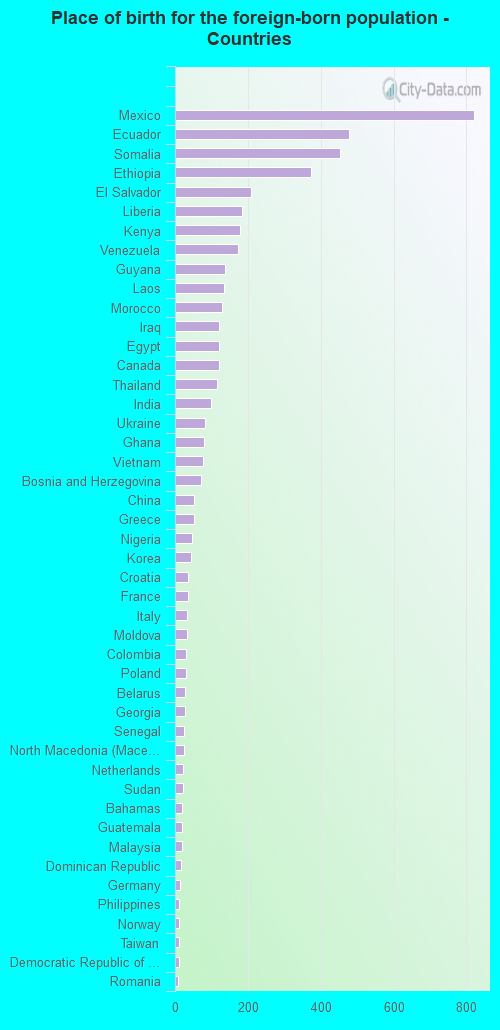
According to 2022 data, the most numerous races in Fridley, MN are White alone (16,419 residents), Black alone (6,253 residents), and Hispanic (4,487 residents). 70.1% of Fridley residents speak English at home. 17.5% of Fridley, MN residents are foreign-born (6.3% born in Africa, 6.2% born in Latin America, 2.4% born in Asia), which is 54.3% greater than the foreign-born rate of 8.0% across the entire state of Minnesota.
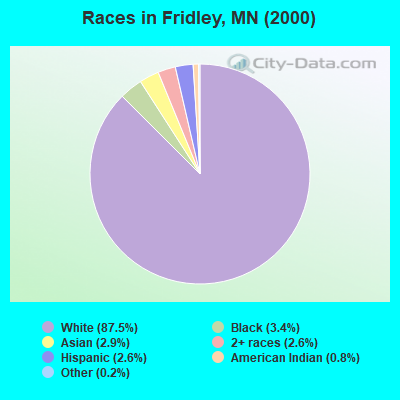
Race distribution in Fridley
2000 2022
4,337,143 88.2% White alone 168,813 3.4% Black alone 143,382 2.9% Hispanic 141,083 2.9% Asian alone 70,304 1.4% Two or more races 52,009 1.1% American Indian alone 5,031 0.1% Other race alone 1,714 0.03% Native Hawaiian and Other
4,356,347 76.2% White alone 395,179 6.9% Black alone 333,830 5.8% Hispanic 294,800 5.2% Asian alone 259,649 4.5% Two or more races 42,125 0.7% American Indian alone 32,976 0.6% Other race alone 2,278 0.04% Native Hawaiian and Other
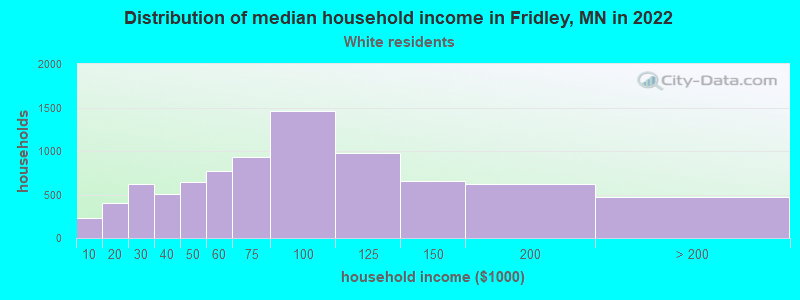
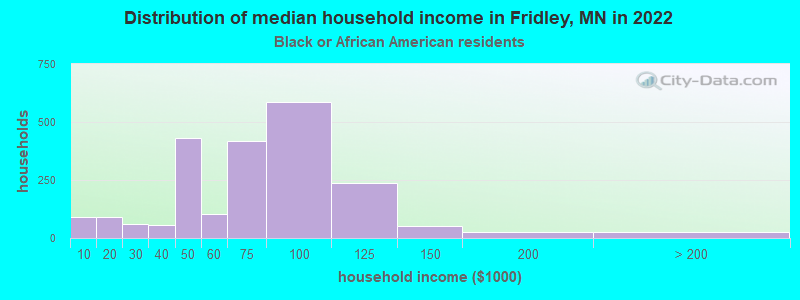
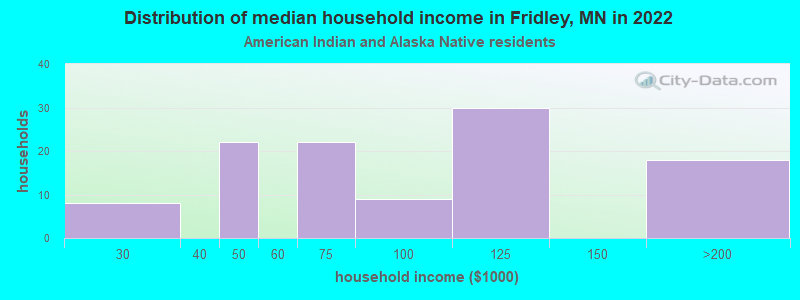
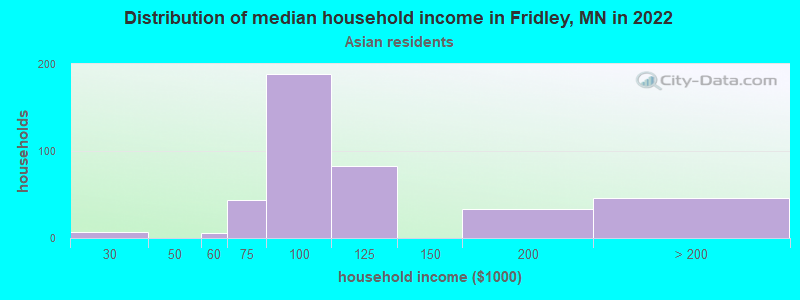
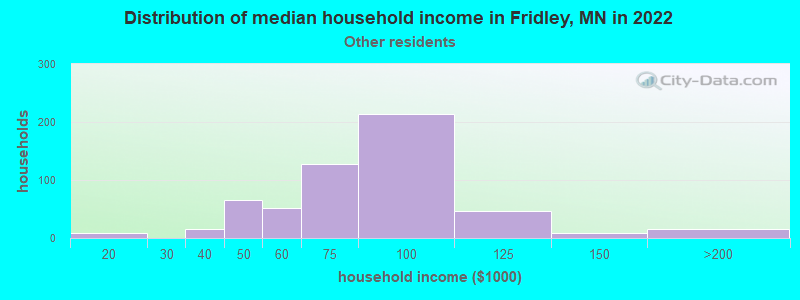
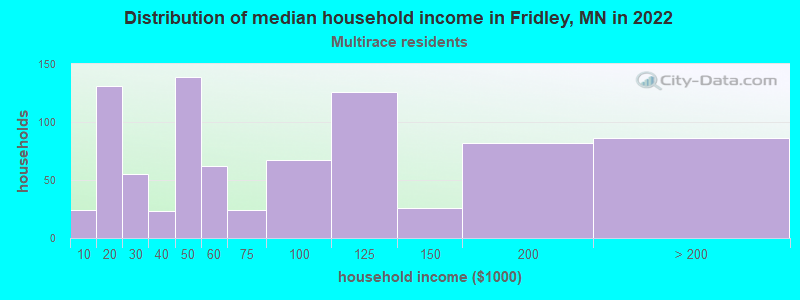
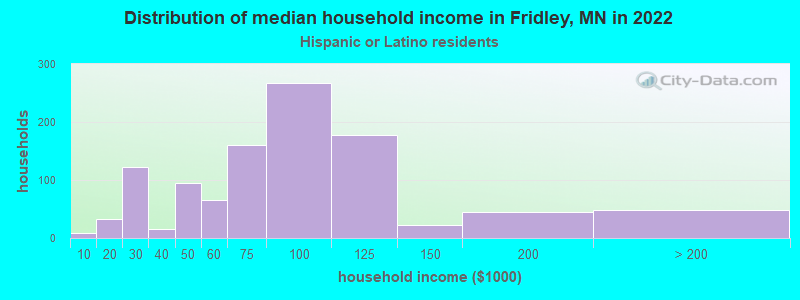
Income and house value in Fridley Median household income in 2022 $74,804 White non-Hispanic householders$65,368 Black householders$93,368 American Indian and Alaska Native householders$103,300 Asian householders$78,817 Some other race householders$67,865 Two or more races householders$70,629 Hispanic or Latino race householdersMedian 2022 house value $292,507 White Non-Hispanic householders$273,997 Black or African American householders$304,441 American Indian or Alaska Native householders $302,736 Asian householders$334,885 Some other race householders$309,312 Two or more races householders$328,796 Hispanic or Latino householders
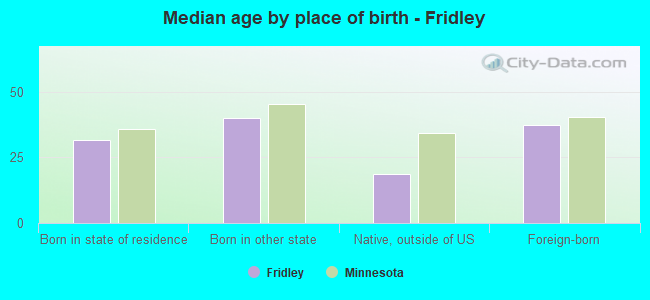
Median age by race in Fridley
43.8 Median age for White residents42.3 44.7 24.7 Median age for Black or African American residents27.9 23.6 42.8 Median age for American Indian / Alaska Native residents27.9 55.4 26.1 Median age for Asian residents29.3 25.0 -670,553,935.2 Median age for Native Hawaiian / Pacific Islander residents-670,553,935.2 -534,959,349.1 29.1 Median age for Other race residents26.7 31.2 31.4 Median age for Two or more races residents34.2 34.0 46.3 Median age for White alone residents44.7 47.7 25.6 Median age for Hispanic or Latino residents25.4 24.1
Owner/renter occupied households by race in Fridley
House owners and renters - White residents 5,723 69.1% Owner occupied2,562 30.9% Renter occupiedHouse owners and renters - Black or African American residents 465 23.7% Owner occupied1,497 76.3% Renter occupiedHouse owners and renters - American Indian / Alaska Native residents 30 31.1% Owner occupied66 68.9% Renter occupiedHouse owners and renters - Asian residents 282 66.0% Owner occupied145 34.0% Renter occupiedHouse owners and renters - Other race residents 521 68.7% Owner occupied238 31.3% Renter occupiedHouse owners and renters - Two or more races residents 488 59.7% Owner occupied330 40.3% Renter occupiedHouse owners and renters - White alone residents 5,559 68.8% Owner occupied2,523 31.2% Renter occupiedHouse owners and renters - Hispanic or Latino residents 735 71.6% Owner occupied291 28.4% Renter occupied
Language usage in Fridley
English speakers - Total 70.1% of residents of Fridley speak English at home.
12.1% of residents speak Spanish at home 1,654 49.1% Speak English very well1,718 50.9% Speak English less than very well20.6% of residents speak other language at home 3,670 64.0% Speak English very well2,063 36.0% Speak English less than very well
English speakers - Born in the United States 83.5% of residents of Fridley speak English at home.
5.2% of residents speak Spanish at home 265 93.0% Speak English very well20 7.0% Speak English less than very well15.3% of residents speak other language at home 760 91.1% Speak English very well74 8.9% Speak English less than very well
English speakers - Native, born elsewhere 60.1% of residents of Fridley speak English at home.
29.9% of residents speak Spanish at home 53 63.9% Speak English very well30 36.1% Speak English less than very well1.8% of residents speak other language at home 5 100.0% Speak English less than very well
English speakers - Foreign-born 9.7% of residents of Fridley speak English at home.
32.3% of residents speak Spanish at home 654 34.6% Speak English very well1,235 65.4% Speak English less than very well58.3% of residents speak other language at home 1,619 47.4% Speak English very well1,794 52.6% Speak English less than very well
White (Caucasian) - Speak only English Native:
93.7% (14,391)Foreign-born:
6.6% (104)
White (Caucasian) - Speak another language Native:
7.1% (1,090)Foreign-born:
95.0% (1,489)
Black or African American - Speak only English Native:
74.1% (2,697)Foreign-born:
12.5% (230)
Black or African American - Speak another language Native:
26.5% (964)Foreign-born:
87.4% (1,613)
American Indian / Alaska Native - Speak another language Native:
50.0% (203)Foreign-born:
100.0% (31)
Asian - Speak only English Native:
22.5% (183)Foreign-born:
8.0% (47)
Asian - Speak another language Native:
81.8% (668)Foreign-born:
95.1% (559)
Other race - Speak only English Native:
19.4% (220)Foreign-born:
8.5% (128)
Other race - Speak another language Native:
72.5% (824)Foreign-born:
80.5% (1,218)
Two or more races - Speak only English Native:
87.5% (1,509)Foreign-born:
7.1% (40)
Two or more races - Speak another language Native:
10.7% (184)Foreign-born:
97.8% (550)
White alone - Speak only English Native:
96.3% (14,114)Foreign-born:
7.9% (98)
White alone - Speak another language Native:
4.2% (620)Foreign-born:
94.5% (1,172)
Hispanic or Latino - Speak only English Native:
25.6% (472)Foreign-born:
11.4% (258)
Hispanic or Latino - Speak another language Native:
82.9% (1,529)Foreign-born:
83.8% (1,891)
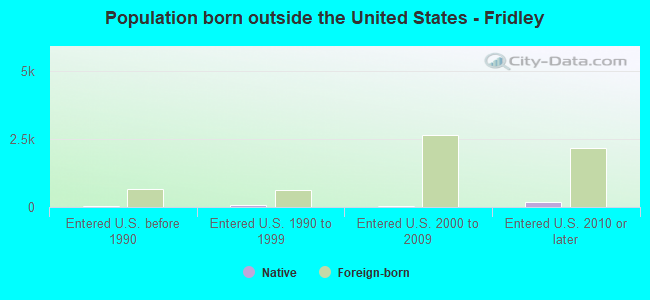
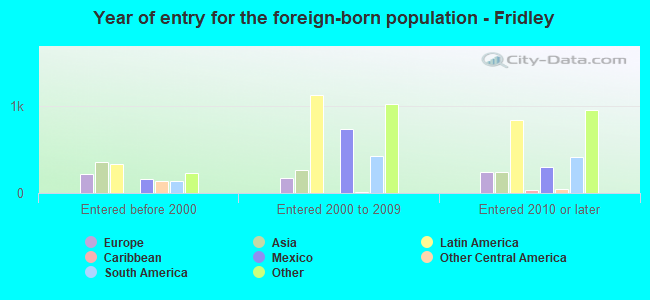
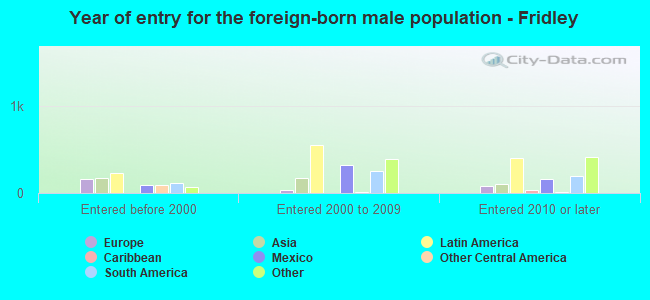
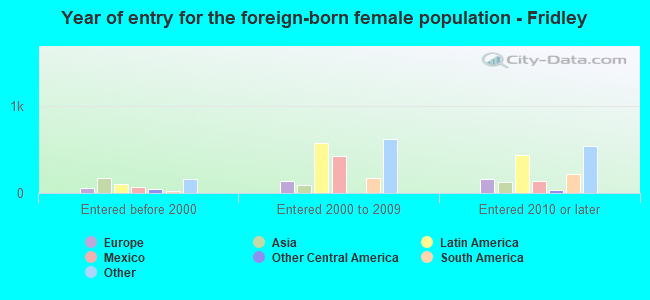
Foreign-born residents in Fridley 5,270 residents are foreign born (6.3% Africa , 6.2% Latin America , 2.4% Asia ).
This city:
17.5%Minnesota:
8.5%
Marital status for residents in Fridley Marital status - White (Caucasian) population 15 years and over
Males 38.5% Never married47.2% Now married0.4% Separated2.5% Widowed11.3% DivorcedFemales 25.9% Never married49.9% Now married2.0% Separated9.1% Widowed13.0% DivorcedWomen who gave birth in the past 12 months Now married:
81.9% (127)Unmarried:
18.1% (28)
Women who did not give birth in the past 12 months Now married:
45.9% (1,488)Unmarried:
54.1% (1,756)
Marital status - Black or African American population 15 years and over
Males 47.3% Never married43.0% Now married4.7% Separated0.4% Widowed4.6% DivorcedFemales 49.8% Never married31.7% Now married10.9% Separated1.7% Widowed5.8% DivorcedWomen who gave birth in the past 12 months Now married:
83.5% (102)Unmarried:
16.5% (20)
Women who did not give birth in the past 12 months Now married:
34.7% (621)Unmarried:
65.3% (1,170)
Marital status - American Indian / Alaska Native population 15 years and over
Males 67.1% Never married32.9% Now married0.0% Separated0.0% Widowed0.0% DivorcedFemales 12.5% Never married42.2% Now married0.0% Separated0.0% Widowed45.3% DivorcedWomen who did not give birth in the past 12 months Now married:
47.8% (56)Unmarried:
52.2% (61)
Marital status - Asian population 15 years and over
Males 41.7% Never married50.0% Now married2.7% Separated0.7% Widowed4.9% DivorcedFemales 41.2% Never married44.8% Now married0.0% Separated5.7% Widowed8.3% DivorcedWomen who gave birth in the past 12 months Now married:
73.7% (34)Unmarried:
26.3% (12)
Women who did not give birth in the past 12 months Now married:
41.2% (158)Unmarried:
58.8% (225)
Marital status - Other race population 15 years and over
Males 31.5% Never married61.2% Now married0.0% Separated0.0% Widowed7.3% DivorcedFemales 36.7% Never married43.6% Now married6.9% Separated3.6% Widowed9.1% DivorcedWomen who gave birth in the past 12 months Now married:
100.0% (50)Unmarried:
0.0% (0)
Women who did not give birth in the past 12 months Now married:
53.0% (424)Unmarried:
47.0% (376)
Marital status - Two or more races population 15 years and over
Males 55.3% Never married36.6% Now married1.2% Separated0.0% Widowed6.9% DivorcedFemales 46.1% Never married38.5% Now married0.0% Separated4.9% Widowed10.5% DivorcedWomen who did not give birth in the past 12 months Now married:
32.9% (233)Unmarried:
67.1% (475)
Marital status - White alone, not Hispanic / Latino population 15 years and over
Males 37.2% Never married48.2% Now married0.5% Separated2.3% Widowed11.8% DivorcedFemales 24.7% Never married50.1% Now married2.0% Separated9.5% Widowed13.6% DivorcedWomen who gave birth in the past 12 months Now married:
68.8% (63)Unmarried:
31.2% (28)
Women who did not give birth in the past 12 months Now married:
47.1% (1,455)Unmarried:
52.9% (1,632)
Marital status - Hispanic or Latino population 15 years and over
Males 49.5% Never married44.2% Now married0.6% Separated2.0% Widowed3.7% DivorcedFemales 39.0% Never married48.4% Now married3.3% Separated1.7% Widowed7.6% DivorcedWomen who gave birth in the past 12 months Now married:
100.0% (108)Unmarried:
0.0% (0)
Women who did not give birth in the past 12 months Now married:
48.3% (486)Unmarried:
51.7% (521)
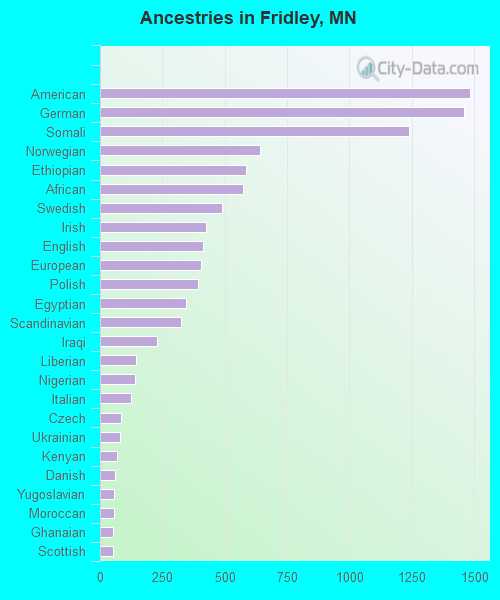
Ancestries in Fridley
1,485 8.9% American1,461 8.7% German1,237 7.4% Somali640 3.8% Norwegian587 3.5% Ethiopian573 3.4% African489 2.9% Swedish423 2.5% Irish412 2.5% English404 2.4% European393 2.3% Polish346 2.1% Egyptian324 1.9% Scandinavian228 1.4% Iraqi143 0.9% Liberian139 0.8% Nigerian124 0.7% Italian83 0.5% Czech81 0.5% Ukrainian69 0.4% Kenyan62 0.4% Danish58 0.3% Yugoslavian57 0.3% Moroccan53 0.3% Ghanaian52 0.3% Scottish46 0.3% Greek45 0.3% Bahamian43 0.3% Eastern European39 0.2% French Canadian37 0.2% Albanian37 0.2% Canadian35 0.2% Palestinian32 0.2% French28 0.2% Romanian26 0.2% Finnish25 0.1% Dutch25 0.1% Macedonian24 0.1% Scotch-Irish21 0.1% Northern European16 0.10% Russian14 0.08% Welsh13 0.08% Hungarian12 0.07% British11 0.07% Arab10 0.06% Lithuanian6 0.04% Slovene
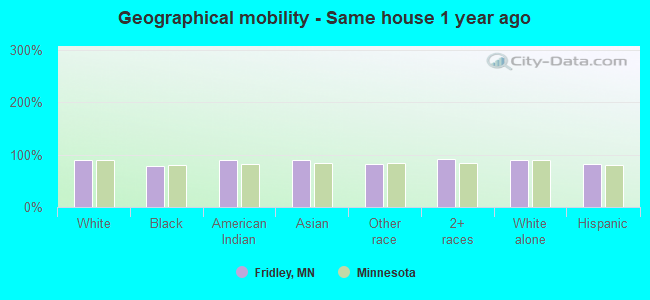
Geographical mobility in Fridley Same house 1 year ago 15,663 89.0% White (Caucasian)4,823 79.1% Black or African American387 89.7% American Indian / Alaska Native1,234 90.4% Asian2,375 82.2% Other race2,274 91.5% Two or more races14,649 89.4% White alone, not Hispanic / Latino3,561 81.7% Hispanic or LatinoMoved within same county 553 3.1% White / Caucasian288 4.7% Black or African American37 8.5% American Indian / Alaska Native5 0.4% Asian41 1.4% Other race70 2.8% Two or more races501 3.1% White alone, not Hispanic / Latino179 4.1% Hispanic or LatinoMoved within same state 1,114 6.3% White / Caucasian492 8.1% Black or African American5 1.0% American Indian / Alaska Native53 3.9% Asian269 9.3% Other race134 5.4% Two or more races995 6.1% White alone, not Hispanic / Latino375 8.6% Hispanic or LatinoMoved from different state 222 1.3% White / Caucasian386 6.3% Black or African American89 6.5% Asian138 4.8% Other race187 1.1% White alone, not Hispanic / Latino130 3.0% Hispanic or LatinoMoved from abroad 32 0.2% White101 1.7% Black or African American32 0.2% White alone, not Hispanic / Latino
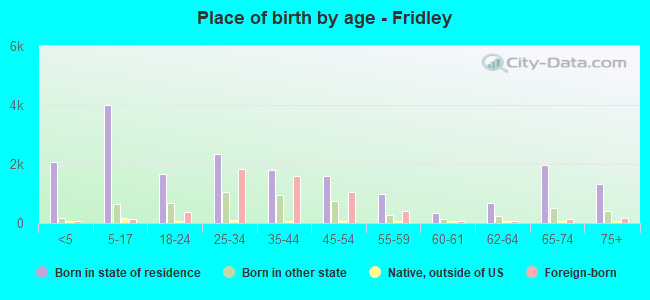
Children Nativity (place of birth) in Fridley
Children under 6 years - Living with two parents Both parents native 783 100.0% NativeBoth parents foreign-born 762 100.0% NativeOne native, one foreign-born parent 120 100.0% NativeChildren under 6 years - Living with one parent Native parent 654 100.0% NativeForeign-born parent 309 100.0% NativeChildren 6 to 17 years - Living with two parents Both parents native 588 100.0% NativeBoth parents foreign-born 1,316 97.8% Native29 2.2% Foreign-bornOne native, one foreign-born parent 338 100.0% NativeChildren 6 to 17 years - Living with one parent Native parent 1,111 100.0% NativeForeign-born parent 942 52.5% Native853 47.5% Foreign-born
Grandparents responsible for own grandchildren in Fridley
Grandparents (30 to 59 years) White / Caucasian 35 35.4% Responsible for grandchildren63 64.6% Not responsible for grandchildrenBlack or African American 26 73.7% Responsible for grandchildren9 26.3% Not responsible for grandchildrenAsian 40 100.0% Responsible for grandchildrenOther race 10 100.0% Not responsible for grandchildrenWhite alone, not Hispanic / Latino 35 33.9% Responsible for grandchildren67 66.1% Not responsible for grandchildrenHispanic or Latino 8 100.0% Not responsible for grandchildren
Grandparents (60 years and over) White / Caucasian 61 100.0% Not responsible for grandchildrenOther race 17 100.0% Not responsible for grandchildrenWhite alone, not Hispanic / Latino 61 100.0% Not responsible for grandchildrenHispanic or Latino 15 100.0% Not responsible for grandchildren