Races in Fredericktown-Millsboro, Pennsylvania (PA) Detailed Stats
Ancestries, Foreign-born residents, place of birth

Discuss Fredericktown-Millsboro, Pennsylvania races on our local forum with over 2,400,000 registered users
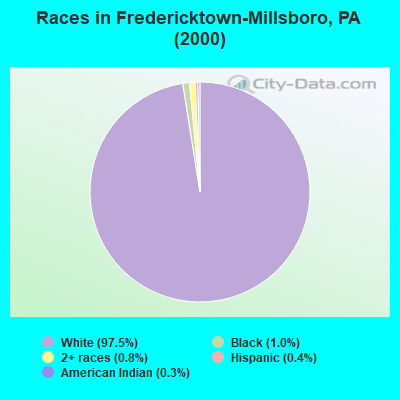
Race distribution in Fredericktown-Millsboro

- 1,06797.5%White alone
- 111.0%Black alone
- 90.8%Two or more races
- 40.4%Hispanic
- 30.3%American Indian alone
2000
2022
-
- 10,322,45584.1%White alone
- 1,202,4379.8%Black alone
- 394,0883.2%Hispanic
- 218,2961.8%Asian alone
- 113,0970.9%Two or more races
- 13,0860.1%Other race alone
- 14,9040.1%American Indian alone
- 2,6910.02%Native Hawaiian and Other
Pacific Islander alone

-
- 9,487,22873.1%White alone
- 1,311,58110.1%Black alone
- 1,115,9978.6%Hispanic
- 493,9423.8%Two or more races
- 487,1243.8%Asian alone
- 63,5820.5%Other race alone
- 10,1300.08%American Indian alone
- 2,4240.02%Native Hawaiian and Other
Pacific Islander alone

Income and house value in Fredericktown-Millsboro
- Median household income in 2022
- $48,501White non-Hispanic householders
- $5,322Black householders
- $67,865Two or more races householders
- Median 2022 house value
- $143,142White Non-Hispanic householders
- $118,190American Indian or Alaska Native householders
- $118,190Two or more races householders
Household income for White non-Hispanic householders

Household income for Black householders

Household income for American Indian and Alaska Native householders

Household income for Two or more races householders

Ancestries in Fredericktown-Millsboro

- 29821.6%Italian
- 17512.7%Irish
- 1339.6%Slovak
- 1299.3%German
- 1289.3%Polish
- 1208.7%English
- 1128.1%Other
- 493.5%Scotch-Irish
- 483.5%Hungarian
- 292.1%Russian
- 292.1%Scottish
- 261.9%Arab
- 241.7%Czech
- 201.4%Dutch
- 161.2%Lithuanian
- 151.1%United States
- 141.0%Welsh
- 100.7%French
- 70.5%French Canadian

Zip codes: 15333.