Races in Fox River Valley Gardens, Illinois (IL) Detailed Stats
Ancestries, Foreign-born residents, place of birth

Discuss Fox River Valley Gardens, Illinois races on our local forum with over 2,400,000 registered users
9.1% of Fox River Valley Gardens, IL residents are foreign-born (3.3% born in Europe, 3.0% born in Latin America, 2.8% born in Asia), which is 53.2% less than the foreign-born rate of 14.0% across the entire state of Illinois.
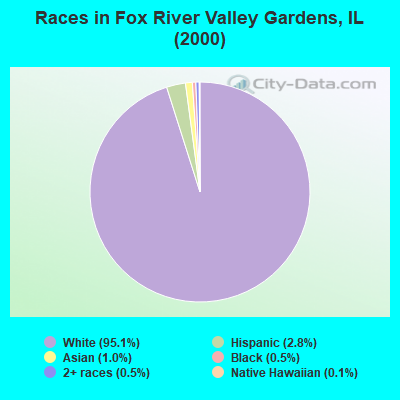
Race distribution in Fox River Valley Gardens

- 74995.1%White alone
- 222.8%Hispanic
- 81.0%Asian alone
- 40.5%Black alone
- 40.5%Two or more races
- 10.1%Native Hawaiian and Other
Pacific Islander alone
2000
2022
-
- 8,424,14067.8%White alone
- 1,856,15214.9%Black alone
- 1,530,26212.3%Hispanic
- 419,9163.4%Asian alone
- 153,9961.2%Two or more races
- 13,4790.1%Other race alone
- 18,2320.1%American Indian alone
- 3,1160.03%Native Hawaiian and Other
Pacific Islander alone

-
- 7,356,30158.5%White alone
- 2,299,72618.3%Hispanic
- 1,660,42313.2%Black alone
- 747,2965.9%Asian alone
- 458,5993.6%Two or more races
- 45,3860.4%Other race alone
- 10,4050.08%American Indian alone
- 3,8960.03%Native Hawaiian and Other
Pacific Islander alone

Income and house value in Fox River Valley Gardens
- Median household income in 2022
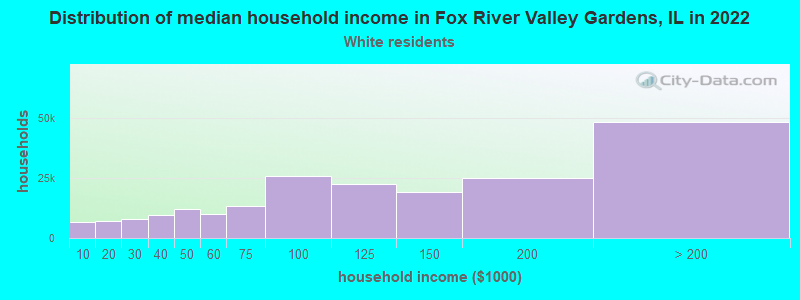
- $134,339White non-Hispanic householders
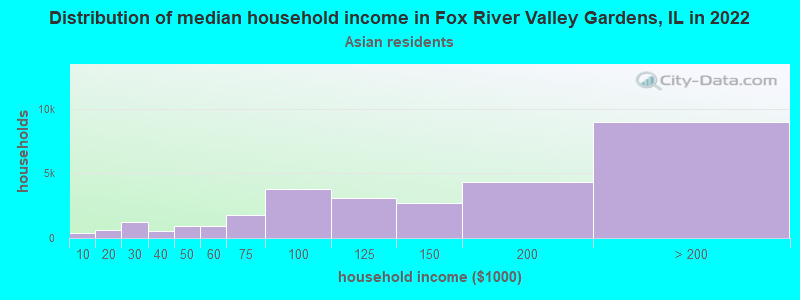
- $191,564Asian householders
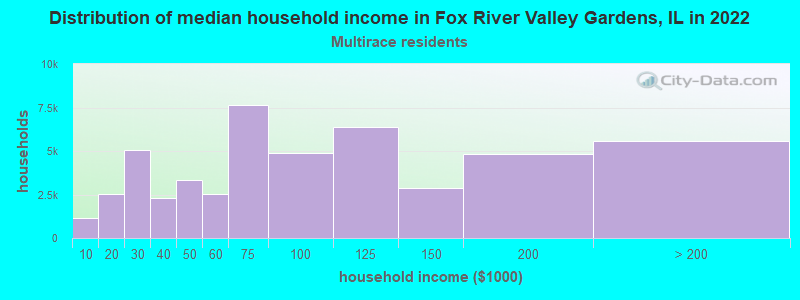
- $134,417Two or more races householders
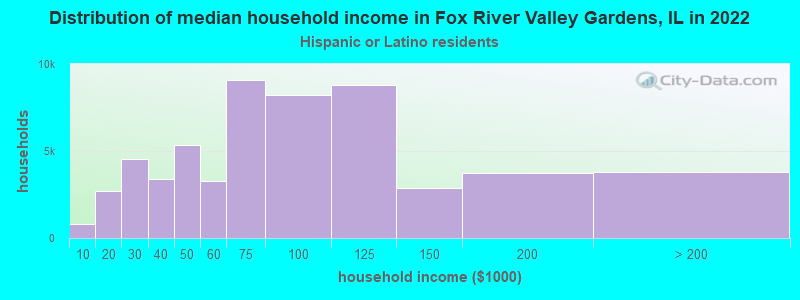
- $90,900Hispanic or Latino race householders
- Median 2022 house value
- $353,976White Non-Hispanic householders
- $206,671Asian householders
- $470,485Two or more races householders
- $598,799Hispanic or Latino householders
Household income for White non-Hispanic householders
Household income for Asian householders
Household income for Two or more races householders
Household income for Hispanic or Latino race householders
Foreign-born residents in Fox River Valley Gardens
72 residents are foreign born (3.3% Europe, 3.0% Latin America, 2.8% Asia).
| This city: | 9.1% |
| Illinois: | 12.3% |
Ancestries in Fox River Valley Gardens

- 31628.5%German
- 21019.0%Irish
- 13812.5%Other
- 1049.4%Italian
- 746.7%English
- 716.4%Polish
- 433.9%Swedish
- 322.9%United States
- 302.7%French
- 201.8%Czech
- 151.4%Norwegian
- 100.9%Scottish
- 70.6%Scotch-Irish
- 60.5%Russian
- 50.5%Welsh
- 40.4%Dutch
- 40.4%French Canadian
- 30.3%Arab
- 30.3%Swiss
- 30.3%Ukrainian
- 20.2%Danish
- 20.2%Hungarian
- 20.2%Lithuanian
- 20.2%Slovak
- 20.2%West Indian

Zip codes: 60010.