Races in Florence, Kentucky (KY) Detailed Stats
Data:
Races - White alone (%)
Races - White alone (% change since 2000)
Races - Black alone (%)
Races - Black alone (% change since 2000)
Races - American Indian alone (%)
Races - American Indian alone (% change since 2000)
Races - Asian alone (%)
Races - Asian alone (% change since 2000)
Races - Hispanic (%)
Races - Hispanic (% change since 2000)
Races - Native Hawaiian and Other Pacific Islander alone (%)
Races - Native Hawaiian and Other Pacific Islander alone (% change since 2000)
Races - Two or more races(%)
Races - Two or more races(% change since 2000)
Races - Other race alone (%)
Races - Other race alone (% change since 2000)
Racial diversity
Place of birth - Born in state of residence (%)
Place of birth - Born in state of residence (%) - White
Place of birth - Born in state of residence (%) - Black or African American
Place of birth - Born in state of residence (%) - Asian
Place of birth - Born in state of residence (%) - Hispanic or Latino
Place of birth - Born in state of residence (%) - American Indian and Alaska Native
Place of birth - Born in state of residence (%) - Multirace
Place of birth - Born in state of residence (%) - Other Race
Place of birth - Born in other state (%)
Place of birth - Born in other state (%) - White
Place of birth - Born in other state (%) - Black or African American
Place of birth - Born in other state (%) - Asian
Place of birth - Born in other state (%) - Hispanic or Latino
Place of birth - Born in other state (%) - American Indian and Alaska Native
Place of birth - Born in other state (%) - Multirace
Place of birth - Born in other state (%) - Other Race
Place of birth - Native, outside of US (%)
Place of birth - Native, outside of US (%) - White
Place of birth - Native, outside of US (%) - Black or African American
Place of birth - Native, outside of US (%) - Asian
Place of birth - Native, outside of US (%) - Hispanic or Latino
Place of birth - Native, outside of US (%) - American Indian and Alaska Native
Place of birth - Native, outside of US (%) - Multirace
Place of birth - Native, outside of US (%) - Other Race
Place of birth - Foreign born (%)
Place of birth - Foreign born (%) - White
Place of birth - Foreign born (%) - Black or African American
Place of birth - Foreign born (%) - Asian
Place of birth - Foreign born (%) - Hispanic or Latino
Place of birth - Foreign born (%) - American Indian and Alaska Native
Place of birth - Foreign born (%) - Multirace
Place of birth - Foreign born (%) - Other Race
Residents speaking English at home (%)
Residents speaking English at home - Born in the United States (%)
Residents speaking English at home - Native, born elsewhere (%)
Residents speaking English at home - Foreign born (%)
Residents speaking Spanish at home (%)
Residents speaking Spanish at home - Born in the United States (%)
Residents speaking Spanish at home - Native, born elsewhere (%)
Residents speaking Spanish at home - Foreign born (%)
Residents speaking other language at home (%)
Residents speaking other language at home - Born in the United States (%)
Residents speaking other language at home - Native, born elsewhere (%)
Residents speaking other language at home - Foreign born (%)
Marital status - Never married (%)
Marital status - Now married (%)
Marital status - Separated (%)
Marital status - Widowed (%)
Marital status - Divorced (%)
Ancestries Reported - Arab (%)
Ancestries Reported - Czech (%)
Ancestries Reported - Danish (%)
Ancestries Reported - Dutch (%)
Ancestries Reported - English (%)
Ancestries Reported - French (%)
Ancestries Reported - French Canadian (%)
Ancestries Reported - German (%)
Ancestries Reported - Greek (%)
Ancestries Reported - Hungarian (%)
Ancestries Reported - Irish (%)
Ancestries Reported - Italian (%)
Ancestries Reported - Lithuanian (%)
Ancestries Reported - Norwegian (%)
Ancestries Reported - Polish (%)
Ancestries Reported - Portuguese (%)
Ancestries Reported - Russian (%)
Ancestries Reported - Scotch-Irish (%)
Ancestries Reported - Scottish (%)
Ancestries Reported - Slovak (%)
Ancestries Reported - Subsaharan African (%)
Ancestries Reported - Swedish (%)
Ancestries Reported - Swiss (%)
Ancestries Reported - Ukrainian (%)
Ancestries Reported - United States (%)
Ancestries Reported - Welsh (%)
Ancestries Reported - West Indian (%)
Ancestries Reported - Other (%)
Geographical mobility - Same house 1 year ago (%)
Geographical mobility - Same house 1 year ago (%) - White
Geographical mobility - Same house 1 year ago (%) - Black or African American
Geographical mobility - Same house 1 year ago (%) - Asian
Geographical mobility - Same house 1 year ago (%) - Hispanic or Latino
Geographical mobility - Same house 1 year ago (%) - American Indian and Alaska Native
Geographical mobility - Same house 1 year ago (%) - Multirace
Geographical mobility - Same house 1 year ago (%) - Other Race
Geographical mobility - Moved within same county (%)
Geographical mobility - Moved within same county (%) - White
Geographical mobility - Moved within same county (%) - Black or African American
Geographical mobility - Moved within same county (%) - Asian
Geographical mobility - Moved within same county (%) - Hispanic or Latino
Geographical mobility - Moved within same county (%) - American Indian and Alaska Native
Geographical mobility - Moved within same county (%) - Multirace
Geographical mobility - Moved within same county (%) - Other Race
Geographical mobility - Moved from different county within same state (%)
Geographical mobility - Moved from different county within same state (%) - White
Geographical mobility - Moved from different county within same state (%) - Black or African American
Geographical mobility - Moved from different county within same state (%) - Asian
Geographical mobility - Moved from different county within same state (%) - Hispanic or Latino
Geographical mobility - Moved from different county within same state (%) - American Indian and Alaska Native
Geographical mobility - Moved from different county within same state (%) - Multirace
Geographical mobility - Moved from different county within same state (%) - Other Race
Geographical mobility - Moved from different state (%)
Geographical mobility - Moved from different state (%) - White
Geographical mobility - Moved from different state (%) - Black or African American
Geographical mobility - Moved from different state (%) - Asian
Geographical mobility - Moved from different state (%) - Hispanic or Latino
Geographical mobility - Moved from different state (%) - American Indian and Alaska Native
Geographical mobility - Moved from different state (%) - Multirace
Geographical mobility - Moved from different state (%) - Other Race
Geographical mobility - Moved from abroad (%)
Geographical mobility - Moved from abroad (%) - White
Geographical mobility - Moved from abroad (%) - Black or African American
Geographical mobility - Moved from abroad (%) - Asian
Geographical mobility - Moved from abroad (%) - Hispanic or Latino
Geographical mobility - Moved from abroad (%) - American Indian and Alaska Native
Geographical mobility - Moved from abroad (%) - Multirace
Geographical mobility - Moved from abroad (%) - Other Race
Place of birth for the foreign-born population - Ireland (%)
Place of birth for the foreign-born population - Denmark (%)
Place of birth for the foreign-born population - Norway (%)
Place of birth for the foreign-born population - Sweden (%)
Place of birth for the foreign-born population - United Kingdom (%)
Place of birth for the foreign-born population - England (%)
Place of birth for the foreign-born population - Scotland (%)
Place of birth for the foreign-born population - Other Northern Europe (%)
Place of birth for the foreign-born population - Austria (%)
Place of birth for the foreign-born population - Belgium (%)
Place of birth for the foreign-born population - France (%)
Place of birth for the foreign-born population - Germany (%)
Place of birth for the foreign-born population - Netherlands (%)
Place of birth for the foreign-born population - Switzerland (%)
Place of birth for the foreign-born population - Other Western Europe (%)
Place of birth for the foreign-born population - Greece (%)
Place of birth for the foreign-born population - Italy (%)
Place of birth for the foreign-born population - Portugal (%)
Place of birth for the foreign-born population - Spain (%)
Place of birth for the foreign-born population - Other Southern Europe (%)
Place of birth for the foreign-born population - Albania (%)
Place of birth for the foreign-born population - Belarus (%)
Place of birth for the foreign-born population - Bosnia and Herzegovina (%)
Place of birth for the foreign-born population - Bulgaria (%)
Place of birth for the foreign-born population - Croatia (%)
Place of birth for the foreign-born population - Czechoslovakia (%)
Place of birth for the foreign-born population - Hungary (%)
Place of birth for the foreign-born population - Latvia (%)
Place of birth for the foreign-born population - Lithuania (%)
Place of birth for the foreign-born population - North Macedonia (Macedonia) (%)
Place of birth for the foreign-born population - Moldova (%)
Place of birth for the foreign-born population - Poland (%)
Place of birth for the foreign-born population - Romania (%)
Place of birth for the foreign-born population - Russia (%)
Place of birth for the foreign-born population - Serbia (%)
Place of birth for the foreign-born population - Ukraine (%)
Place of birth for the foreign-born population - Other Eastern Europe (%)
Place of birth for the foreign-born population - China (%)
Place of birth for the foreign-born population - Hong Kong (%)
Place of birth for the foreign-born population - Taiwan (%)
Place of birth for the foreign-born population - Japan (%)
Place of birth for the foreign-born population - Korea (%)
Place of birth for the foreign-born population - Other Eastern Asia (%)
Place of birth for the foreign-born population - Afghanistan (%)
Place of birth for the foreign-born population - Bangladesh (%)
Place of birth for the foreign-born population - India (%)
Place of birth for the foreign-born population - Iran (%)
Place of birth for the foreign-born population - Kazakhstan (%)
Place of birth for the foreign-born population - Nepal (%)
Place of birth for the foreign-born population - Pakistan (%)
Place of birth for the foreign-born population - Sri Lanka (%)
Place of birth for the foreign-born population - Uzbekistan (%)
Place of birth for the foreign-born population - Other South Central Asia (%)
Place of birth for the foreign-born population - Burma (%)
Place of birth for the foreign-born population - Cambodia (%)
Place of birth for the foreign-born population - Indonesia (%)
Place of birth for the foreign-born population - Laos (%)
Place of birth for the foreign-born population - Malaysia (%)
Place of birth for the foreign-born population - Philippines (%)
Place of birth for the foreign-born population - Singapore (%)
Place of birth for the foreign-born population - Thailand (%)
Place of birth for the foreign-born population - Vietnam (%)
Place of birth for the foreign-born population - Other South Eastern Asia (%)
Place of birth for the foreign-born population - Armenia (%)
Place of birth for the foreign-born population - Iraq (%)
Place of birth for the foreign-born population - Israel (%)
Place of birth for the foreign-born population - Jordan (%)
Place of birth for the foreign-born population - Kuwait (%)
Place of birth for the foreign-born population - Lebanon (%)
Place of birth for the foreign-born population - Saudi Arabia (%)
Place of birth for the foreign-born population - Syria (%)
Place of birth for the foreign-born population - Turkey (%)
Place of birth for the foreign-born population - Yemen (%)
Place of birth for the foreign-born population - Other Western Asia (%)
Place of birth for the foreign-born population - Eritrea (%)
Place of birth for the foreign-born population - Ethiopia (%)
Place of birth for the foreign-born population - Kenya (%)
Place of birth for the foreign-born population - Somalia (%)
Place of birth for the foreign-born population - Uganda (%)
Place of birth for the foreign-born population - Zimbabwe (%)
Place of birth for the foreign-born population - Other Eastern Africa (%)
Place of birth for the foreign-born population - Cameroon (%)
Place of birth for the foreign-born population - Congo (%)
Place of birth for the foreign-born population - Democratic Republic of Congo (Zaire) (%)
Place of birth for the foreign-born population - Other Middle Africa (%)
Place of birth for the foreign-born population - Egypt (%)
Place of birth for the foreign-born population - Morocco (%)
Place of birth for the foreign-born population - Sudan (%)
Place of birth for the foreign-born population - Other Northern Africa (%)
Place of birth for the foreign-born population - South Africa (%)
Place of birth for the foreign-born population - Other Southern Africa (%)
Place of birth for the foreign-born population - Cabo Verde (%)
Place of birth for the foreign-born population - Ghana (%)
Place of birth for the foreign-born population - Liberia (%)
Place of birth for the foreign-born population - Nigeria (%)
Place of birth for the foreign-born population - Senegal (%)
Place of birth for the foreign-born population - Sierra Leone (%)
Place of birth for the foreign-born population - Other Western Africa (%)
Place of birth for the foreign-born population - Australia (%)
Place of birth for the foreign-born population - New Zealand (%)
Place of birth for the foreign-born population - Fiji (%)
Place of birth for the foreign-born population - Micronesia (%)
Place of birth for the foreign-born population - Bahamas (%)
Place of birth for the foreign-born population - Barbados (%)
Place of birth for the foreign-born population - Cuba (%)
Place of birth for the foreign-born population - Dominica (%)
Place of birth for the foreign-born population - Dominican Republic (%)
Place of birth for the foreign-born population - Grenada (%)
Place of birth for the foreign-born population - Haiti (%)
Place of birth for the foreign-born population - Jamaica (%)
Place of birth for the foreign-born population - St. Vincent and the Grenadines (%)
Place of birth for the foreign-born population - Trinidad and Tobago (%)
Place of birth for the foreign-born population - West Indies (%)
Place of birth for the foreign-born population - Other Caribbean (%)
Place of birth for the foreign-born population - Belize (%)
Place of birth for the foreign-born population - Costa Rica (%)
Place of birth for the foreign-born population - El Salvador (%)
Place of birth for the foreign-born population - Guatemala (%)
Place of birth for the foreign-born population - Honduras (%)
Place of birth for the foreign-born population - Mexico (%)
Place of birth for the foreign-born population - Nicaragua (%)
Place of birth for the foreign-born population - Panama (%)
Place of birth for the foreign-born population - Other Central America (%)
Place of birth for the foreign-born population - Argentina (%)
Place of birth for the foreign-born population - Bolivia (%)
Place of birth for the foreign-born population - Brazil (%)
Place of birth for the foreign-born population - Chile (%)
Place of birth for the foreign-born population - Colombia (%)
Place of birth for the foreign-born population - Ecuador (%)
Place of birth for the foreign-born population - Guyana (%)
Place of birth for the foreign-born population - Peru (%)
Place of birth for the foreign-born population - Uruguay (%)
Place of birth for the foreign-born population - Venezuela (%)
Place of birth for the foreign-born population - Other South America (%)
Place of birth for the foreign-born population - Canada (%)
Place of birth for the foreign-born population - Other Northern America (%)
Place of birth for the foreign-born population - Other (%)
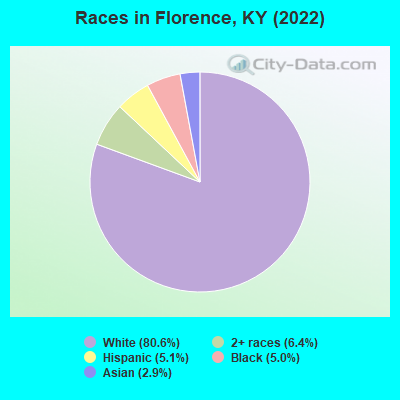
According to 2022 data, the most numerous races in Florence, KY are White alone (26,394 residents), Black alone (1,637 residents), and Hispanic (1,657 residents). 89.7% of Florence residents speak English at home. 8.4% of Florence, KY residents are foreign-born (2.7% born in Asia, 2.4% born in Africa, 2.1% born in Latin America, 0.9% born in Europe), which is 52.2% greater than the foreign-born rate of 4.0% across the entire state of Kentucky.
Race distribution in Florence
2000 2022
3,608,013 89.3% White alone 293,639 7.3% Black alone 59,939 1.5% Hispanic 37,750 0.9% Two or more races 29,368 0.7% Asian alone 7,939 0.2% American Indian alone 3,846 0.10% Other race alone 1,275 0.03% Native Hawaiian and Other
3,710,998 82.2% White alone 343,194 7.6% Black alone 187,483 4.2% Hispanic 187,394 4.2% Two or more races 62,240 1.4% Asian alone 13,529 0.3% Other race alone 4,302 0.10% American Indian alone 3,170 0.07% Native Hawaiian and Other
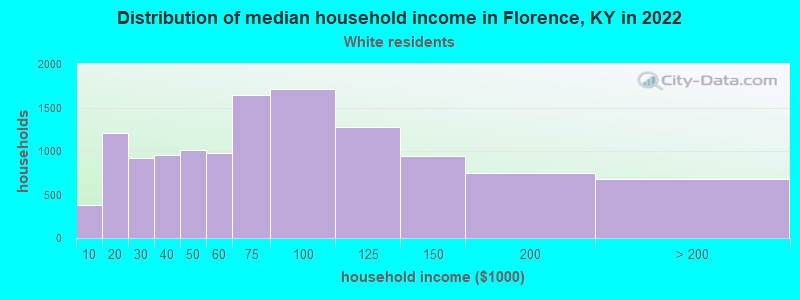
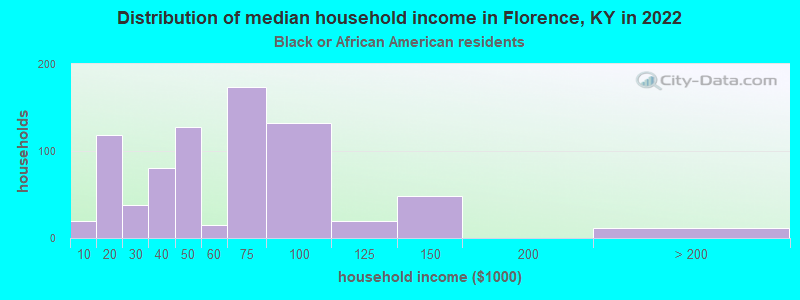
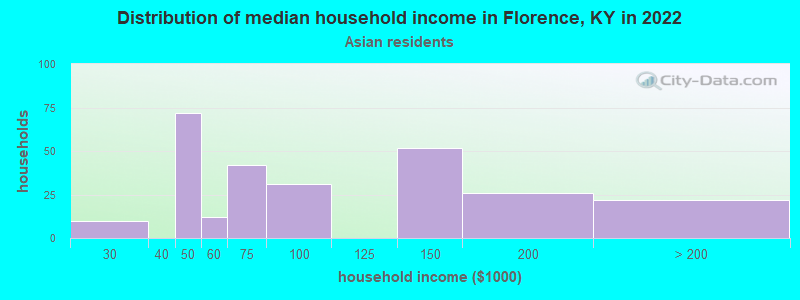
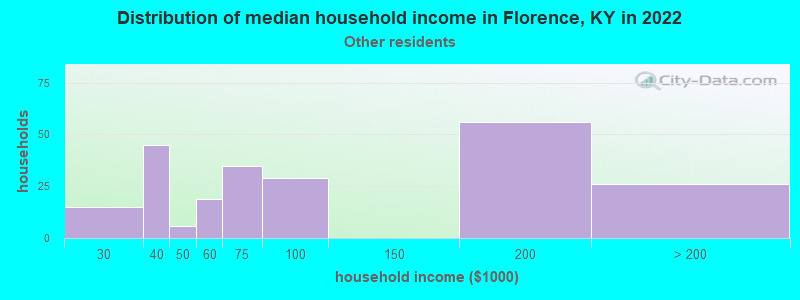
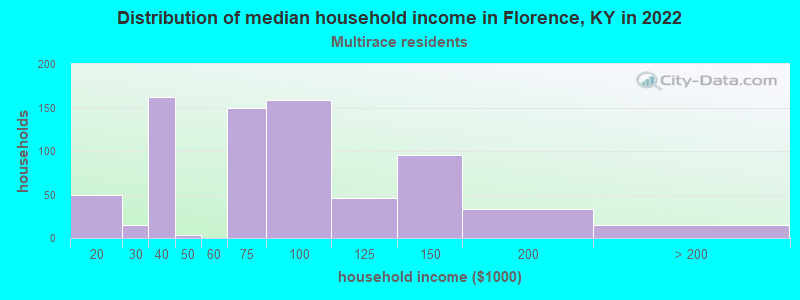
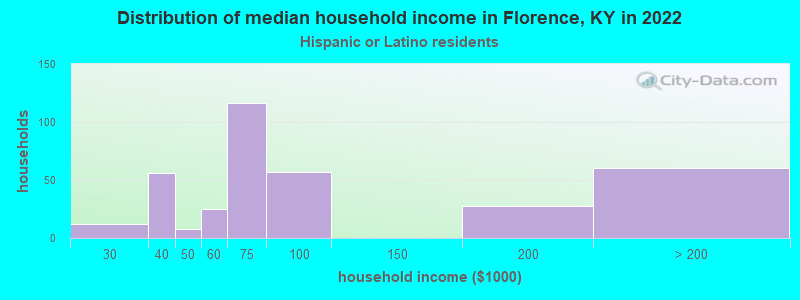
Income and house value in Florence Median household income in 2022 $65,032 White non-Hispanic householders$56,851 Black householders$63,898 Asian householders$92,321 Two or more races householders$62,787 Hispanic or Latino race householdersMedian 2022 house value $206,024 White Non-Hispanic householders$288,229 Black or African American householders$20,396 American Indian or Alaska Native householders $283,742 Asian householders$242,333 Two or more races householders$229,482 Hispanic or Latino householders
Median age by race in Florence
41.9 Median age for White residents41.4 42.4 36.2 Median age for Black or African American residents35.4 37.3 -521,556,256.1 Median age for American Indian / Alaska Native residents-607,449,856.1 -630,065,358.8 50.1 Median age for Asian residents40.2 48.0 -914,965,985.5 Median age for Native Hawaiian / Pacific Islander residents-1,069,860,278.4 -853,801,168.7 29.1 Median age for Other race residents24.1 31.5 36.6 Median age for Two or more races residents49.1 19.0 42.3 Median age for White alone residents41.5 42.5 30.9 Median age for Hispanic or Latino residents28.1 34.9
Owner/renter occupied households by race in Florence
House owners and renters - White residents 7,739 64.1% Owner occupied4,326 35.9% Renter occupiedHouse owners and renters - Black or African American residents 61 9.6% Owner occupied576 90.4% Renter occupiedHouse owners and renters - Asian residents 95 26.6% Owner occupied261 73.4% Renter occupiedHouse owners and renters - Other race residents 43 15.4% Owner occupied234 84.6% Renter occupiedHouse owners and renters - Two or more races residents 293 43.7% Owner occupied377 56.3% Renter occupiedHouse owners and renters - White alone residents 7,675 63.6% Owner occupied4,402 36.4% Renter occupiedHouse owners and renters - Hispanic or Latino residents 269 68.4% Owner occupied124 31.6% Renter occupied
Language usage in Florence
English speakers - Total 89.7% of residents of Florence speak English at home.
3.7% of residents speak Spanish at home 518 45.9% Speak English very well611 54.1% Speak English less than very well6.5% of residents speak other language at home 984 49.4% Speak English very well1,007 50.6% Speak English less than very well
English speakers - Born in the United States 98.2% of residents of Florence speak English at home.
0.9% of residents speak Spanish at home 121 100.0% Speak English very well0.5% of residents speak other language at home 68 100.0% Speak English very well
English speakers - Native, born elsewhere 95.9% of residents of Florence speak English at home.
12.4% of residents speak Spanish at home 36 100.0% Speak English less than very well
English speakers - Foreign-born 9.8% of residents of Florence speak English at home.
25.8% of residents speak Spanish at home 229 31.4% Speak English very well500 68.6% Speak English less than very well59.4% of residents speak other language at home 636 37.9% Speak English very well1,041 62.1% Speak English less than very well
White (Caucasian) - Speak only English Native:
99.2% (24,539)Foreign-born:
34.2% (150)
White (Caucasian) - Speak another language Native:
0.9% (213)Foreign-born:
62.9% (276)
Black or African American - Speak only English Native:
99.3% (822)Foreign-born:
10.0% (73)
Black or African American - Speak another language Native:
0.9% (7)Foreign-born:
88.2% (639)
Asian - Speak only English Native:
100.0% (87)Foreign-born:
5.6% (50)
Asian - Speak another language Native:
20.2% (18)Foreign-born:
95.5% (842)
Other race - Speak only English Native:
19.3% (79)Foreign-born:
2.1% (13)
Other race - Speak another language Native:
73.1% (299)Foreign-born:
96.8% (581)
Two or more races - Speak another language Native:
10.4% (205)Foreign-born:
98.8% (218)
White alone - Speak only English Native:
99.3% (24,356)Foreign-born:
34.1% (150)
White alone - Speak another language Native:
0.6% (149)Foreign-born:
60.5% (266)
Hispanic or Latino - Speak only English Native:
53.9% (352)Foreign-born:
1.9% (17)
Hispanic or Latino - Speak another language Native:
48.2% (315)Foreign-born:
97.4% (880)
Foreign-born residents in Florence 2,738 residents are foreign born (2.7% Asia , 2.4% Africa , 2.1% Latin America , 0.9% Europe ).
This city:
8.4%Kentucky:
4.1%
Marital status for residents in Florence Marital status - White (Caucasian) population 15 years and over
Males 31.5% Never married45.1% Now married0.7% Separated3.9% Widowed18.8% DivorcedFemales 26.2% Never married37.8% Now married0.5% Separated13.3% Widowed22.1% DivorcedWomen who gave birth in the past 12 months Now married:
53.0% (165)Unmarried:
47.0% (146)
Women who did not give birth in the past 12 months Now married:
31.6% (1,678)Unmarried:
68.4% (3,626)
Marital status - Black or African American population 15 years and over
Males 29.6% Never married59.9% Now married0.0% Separated0.0% Widowed10.4% DivorcedFemales 39.2% Never married37.0% Now married0.0% Separated1.7% Widowed22.1% DivorcedWomen who gave birth in the past 12 months Now married:
100.0% (27)Unmarried:
0.0% (0)
Women who did not give birth in the past 12 months Now married:
20.5% (107)Unmarried:
79.5% (416)
Marital status - Asian population 15 years and over
Males 26.3% Never married73.7% Now married0.0% Separated0.0% Widowed0.0% DivorcedFemales 25.6% Never married74.1% Now married0.0% Separated0.3% Widowed0.0% DivorcedWomen who gave birth in the past 12 months Now married:
100.0% (32)Unmarried:
0.0% (0)
Women who did not give birth in the past 12 months Now married:
64.3% (153)Unmarried:
35.7% (85)
Marital status - Other race population 15 years and over
Males 45.0% Never married43.3% Now married0.0% Separated0.0% Widowed11.7% DivorcedFemales 15.3% Never married45.8% Now married34.4% Separated4.5% Widowed0.0% DivorcedWomen who did not give birth in the past 12 months Now married:
68.1% (186)Unmarried:
31.9% (87)
Marital status - Two or more races population 15 years and over
Males 72.0% Never married20.6% Now married2.0% Separated0.0% Widowed5.4% DivorcedFemales 48.2% Never married30.6% Now married0.0% Separated2.3% Widowed18.9% DivorcedWomen who did not give birth in the past 12 months Now married:
16.0% (84)Unmarried:
84.0% (441)
Marital status - White alone, not Hispanic / Latino population 15 years and over
Males 31.7% Never married44.9% Now married0.7% Separated3.9% Widowed18.7% DivorcedFemales 25.8% Never married38.2% Now married0.5% Separated13.4% Widowed22.1% DivorcedWomen who gave birth in the past 12 months Now married:
53.0% (167)Unmarried:
47.0% (148)
Women who did not give birth in the past 12 months Now married:
32.2% (1,702)Unmarried:
67.8% (3,588)
Marital status - Hispanic or Latino population 15 years and over
Males 41.5% Never married45.0% Now married0.0% Separated0.0% Widowed13.5% DivorcedFemales 21.5% Never married37.2% Now married22.5% Separated2.9% Widowed15.9% DivorcedWomen who did not give birth in the past 12 months Now married:
44.0% (176)Unmarried:
56.0% (223)
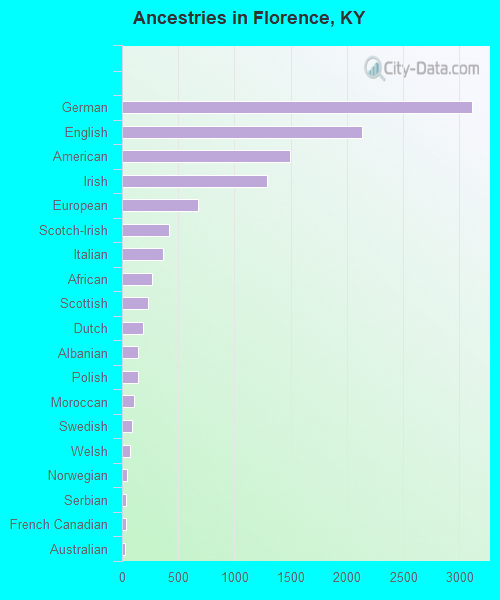
Ancestries in Florence
3,107 20.6% German2,129 14.1% English1,490 9.9% American1,288 8.5% Irish677 4.5% European420 2.8% Scotch-Irish361 2.4% Italian267 1.8% African228 1.5% Scottish185 1.2% Dutch140 0.9% Albanian138 0.9% Polish105 0.7% Moroccan85 0.6% Swedish70 0.5% Welsh46 0.3% Norwegian35 0.2% Serbian32 0.2% French Canadian31 0.2% Australian28 0.2% Yugoslavian26 0.2% Arab25 0.2% British23 0.2% Hungarian22 0.1% Jamaican19 0.1% French14 0.09% Canadian13 0.09% Northern European11 0.07% Portuguese9 0.06% Russian4 0.03% Scandinavian
Geographical mobility in Florence Same house 1 year ago 21,924 83.6% White (Caucasian)1,350 74.0% Black or African American544 58.6% Asian1 100.0% Native Hawaiian / Pacific Islander561 50.1% Other race1,472 74.6% Two or more races21,646 83.1% White alone, not Hispanic / Latino1,234 74.2% Hispanic or LatinoMoved within same county 1,270 4.8% White / Caucasian120 6.6% Black or African American57 6.2% Asian62 5.6% Other race74 3.7% Two or more races1,288 4.9% White alone, not Hispanic / Latino121 7.3% Hispanic or LatinoMoved within same state 2,057 7.8% White / Caucasian133 7.3% Black or African American52 5.6% Asian339 30.2% Other race277 14.0% Two or more races2,091 8.0% White alone, not Hispanic / Latino320 19.3% Hispanic or LatinoMoved from different state 1,107 4.2% White / Caucasian143 7.8% Black or African American36 3.9% Asian73 6.5% Other race74 3.8% Two or more races1,205 4.6% White alone, not Hispanic / Latino59 3.6% Hispanic or LatinoMoved from abroad 55 0.2% White60 3.3% Black or African American278 29.9% Asian38 3.4% Other race25 1.3% Two or more races55 0.2% White alone, not Hispanic / Latino25 1.5% Hispanic or Latino
Children Nativity (place of birth) in Florence
Children under 6 years - Living with two parents Both parents native 488 100.0% NativeBoth parents foreign-born 259 91.6% Native24 8.4% Foreign-bornOne native, one foreign-born parent 211 100.0% NativeChildren under 6 years - Living with one parent Native parent 1,507 100.0% NativeForeign-born parent 73 100.0% NativeChildren 6 to 17 years - Living with two parents Both parents native 1,340 100.0% NativeBoth parents foreign-born 193 73.0% Native72 27.0% Foreign-bornOne native, one foreign-born parent 340 100.0% NativeChildren 6 to 17 years - Living with one parent Native parent 2,023 100.0% NativeForeign-born parent 71 43.2% Native93 56.8% Foreign-born
Grandparents responsible for own grandchildren in Florence
Grandparents (30 to 59 years) White / Caucasian 94 73.9% Responsible for grandchildren33 26.1% Not responsible for grandchildrenOther race 61 100.0% Not responsible for grandchildrenWhite alone, not Hispanic / Latino 94 73.9% Responsible for grandchildren33 26.1% Not responsible for grandchildrenHispanic or Latino 33 100.0% Not responsible for grandchildrenGrandparents (60 years and over) White / Caucasian 135 27.6% Responsible for grandchildren355 72.4% Not responsible for grandchildrenWhite alone, not Hispanic / Latino 159 30.0% Responsible for grandchildren371 70.0% Not responsible for grandchildren