Races in Ferry Pass, Florida (FL) Detailed Stats
Data:
Races - White alone (%)
Races - White alone (% change since 2000)
Races - Black alone (%)
Races - Black alone (% change since 2000)
Races - American Indian alone (%)
Races - American Indian alone (% change since 2000)
Races - Asian alone (%)
Races - Asian alone (% change since 2000)
Races - Hispanic (%)
Races - Hispanic (% change since 2000)
Races - Native Hawaiian and Other Pacific Islander alone (%)
Races - Native Hawaiian and Other Pacific Islander alone (% change since 2000)
Races - Two or more races(%)
Races - Two or more races(% change since 2000)
Races - Other race alone (%)
Races - Other race alone (% change since 2000)
Racial diversity
Place of birth - Born in state of residence (%)
Place of birth - Born in state of residence (%) - White
Place of birth - Born in state of residence (%) - Black or African American
Place of birth - Born in state of residence (%) - Asian
Place of birth - Born in state of residence (%) - Hispanic or Latino
Place of birth - Born in state of residence (%) - American Indian and Alaska Native
Place of birth - Born in state of residence (%) - Multirace
Place of birth - Born in state of residence (%) - Other Race
Place of birth - Born in other state (%)
Place of birth - Born in other state (%) - White
Place of birth - Born in other state (%) - Black or African American
Place of birth - Born in other state (%) - Asian
Place of birth - Born in other state (%) - Hispanic or Latino
Place of birth - Born in other state (%) - American Indian and Alaska Native
Place of birth - Born in other state (%) - Multirace
Place of birth - Born in other state (%) - Other Race
Place of birth - Native, outside of US (%)
Place of birth - Native, outside of US (%) - White
Place of birth - Native, outside of US (%) - Black or African American
Place of birth - Native, outside of US (%) - Asian
Place of birth - Native, outside of US (%) - Hispanic or Latino
Place of birth - Native, outside of US (%) - American Indian and Alaska Native
Place of birth - Native, outside of US (%) - Multirace
Place of birth - Native, outside of US (%) - Other Race
Place of birth - Foreign born (%)
Place of birth - Foreign born (%) - White
Place of birth - Foreign born (%) - Black or African American
Place of birth - Foreign born (%) - Asian
Place of birth - Foreign born (%) - Hispanic or Latino
Place of birth - Foreign born (%) - American Indian and Alaska Native
Place of birth - Foreign born (%) - Multirace
Place of birth - Foreign born (%) - Other Race
Residents speaking English at home (%)
Residents speaking English at home - Born in the United States (%)
Residents speaking English at home - Native, born elsewhere (%)
Residents speaking English at home - Foreign born (%)
Residents speaking Spanish at home (%)
Residents speaking Spanish at home - Born in the United States (%)
Residents speaking Spanish at home - Native, born elsewhere (%)
Residents speaking Spanish at home - Foreign born (%)
Residents speaking other language at home (%)
Residents speaking other language at home - Born in the United States (%)
Residents speaking other language at home - Native, born elsewhere (%)
Residents speaking other language at home - Foreign born (%)
Marital status - Never married (%)
Marital status - Now married (%)
Marital status - Separated (%)
Marital status - Widowed (%)
Marital status - Divorced (%)
Ancestries Reported - Arab (%)
Ancestries Reported - Czech (%)
Ancestries Reported - Danish (%)
Ancestries Reported - Dutch (%)
Ancestries Reported - English (%)
Ancestries Reported - French (%)
Ancestries Reported - French Canadian (%)
Ancestries Reported - German (%)
Ancestries Reported - Greek (%)
Ancestries Reported - Hungarian (%)
Ancestries Reported - Irish (%)
Ancestries Reported - Italian (%)
Ancestries Reported - Lithuanian (%)
Ancestries Reported - Norwegian (%)
Ancestries Reported - Polish (%)
Ancestries Reported - Portuguese (%)
Ancestries Reported - Russian (%)
Ancestries Reported - Scotch-Irish (%)
Ancestries Reported - Scottish (%)
Ancestries Reported - Slovak (%)
Ancestries Reported - Subsaharan African (%)
Ancestries Reported - Swedish (%)
Ancestries Reported - Swiss (%)
Ancestries Reported - Ukrainian (%)
Ancestries Reported - United States (%)
Ancestries Reported - Welsh (%)
Ancestries Reported - West Indian (%)
Ancestries Reported - Other (%)
Geographical mobility - Same house 1 year ago (%)
Geographical mobility - Same house 1 year ago (%) - White
Geographical mobility - Same house 1 year ago (%) - Black or African American
Geographical mobility - Same house 1 year ago (%) - Asian
Geographical mobility - Same house 1 year ago (%) - Hispanic or Latino
Geographical mobility - Same house 1 year ago (%) - American Indian and Alaska Native
Geographical mobility - Same house 1 year ago (%) - Multirace
Geographical mobility - Same house 1 year ago (%) - Other Race
Geographical mobility - Moved within same county (%)
Geographical mobility - Moved within same county (%) - White
Geographical mobility - Moved within same county (%) - Black or African American
Geographical mobility - Moved within same county (%) - Asian
Geographical mobility - Moved within same county (%) - Hispanic or Latino
Geographical mobility - Moved within same county (%) - American Indian and Alaska Native
Geographical mobility - Moved within same county (%) - Multirace
Geographical mobility - Moved within same county (%) - Other Race
Geographical mobility - Moved from different county within same state (%)
Geographical mobility - Moved from different county within same state (%) - White
Geographical mobility - Moved from different county within same state (%) - Black or African American
Geographical mobility - Moved from different county within same state (%) - Asian
Geographical mobility - Moved from different county within same state (%) - Hispanic or Latino
Geographical mobility - Moved from different county within same state (%) - American Indian and Alaska Native
Geographical mobility - Moved from different county within same state (%) - Multirace
Geographical mobility - Moved from different county within same state (%) - Other Race
Geographical mobility - Moved from different state (%)
Geographical mobility - Moved from different state (%) - White
Geographical mobility - Moved from different state (%) - Black or African American
Geographical mobility - Moved from different state (%) - Asian
Geographical mobility - Moved from different state (%) - Hispanic or Latino
Geographical mobility - Moved from different state (%) - American Indian and Alaska Native
Geographical mobility - Moved from different state (%) - Multirace
Geographical mobility - Moved from different state (%) - Other Race
Geographical mobility - Moved from abroad (%)
Geographical mobility - Moved from abroad (%) - White
Geographical mobility - Moved from abroad (%) - Black or African American
Geographical mobility - Moved from abroad (%) - Asian
Geographical mobility - Moved from abroad (%) - Hispanic or Latino
Geographical mobility - Moved from abroad (%) - American Indian and Alaska Native
Geographical mobility - Moved from abroad (%) - Multirace
Geographical mobility - Moved from abroad (%) - Other Race
Place of birth for the foreign-born population - Ireland (%)
Place of birth for the foreign-born population - Denmark (%)
Place of birth for the foreign-born population - Norway (%)
Place of birth for the foreign-born population - Sweden (%)
Place of birth for the foreign-born population - United Kingdom (%)
Place of birth for the foreign-born population - England (%)
Place of birth for the foreign-born population - Scotland (%)
Place of birth for the foreign-born population - Other Northern Europe (%)
Place of birth for the foreign-born population - Austria (%)
Place of birth for the foreign-born population - Belgium (%)
Place of birth for the foreign-born population - France (%)
Place of birth for the foreign-born population - Germany (%)
Place of birth for the foreign-born population - Netherlands (%)
Place of birth for the foreign-born population - Switzerland (%)
Place of birth for the foreign-born population - Other Western Europe (%)
Place of birth for the foreign-born population - Greece (%)
Place of birth for the foreign-born population - Italy (%)
Place of birth for the foreign-born population - Portugal (%)
Place of birth for the foreign-born population - Spain (%)
Place of birth for the foreign-born population - Other Southern Europe (%)
Place of birth for the foreign-born population - Albania (%)
Place of birth for the foreign-born population - Belarus (%)
Place of birth for the foreign-born population - Bosnia and Herzegovina (%)
Place of birth for the foreign-born population - Bulgaria (%)
Place of birth for the foreign-born population - Croatia (%)
Place of birth for the foreign-born population - Czechoslovakia (%)
Place of birth for the foreign-born population - Hungary (%)
Place of birth for the foreign-born population - Latvia (%)
Place of birth for the foreign-born population - Lithuania (%)
Place of birth for the foreign-born population - North Macedonia (Macedonia) (%)
Place of birth for the foreign-born population - Moldova (%)
Place of birth for the foreign-born population - Poland (%)
Place of birth for the foreign-born population - Romania (%)
Place of birth for the foreign-born population - Russia (%)
Place of birth for the foreign-born population - Serbia (%)
Place of birth for the foreign-born population - Ukraine (%)
Place of birth for the foreign-born population - Other Eastern Europe (%)
Place of birth for the foreign-born population - China (%)
Place of birth for the foreign-born population - Hong Kong (%)
Place of birth for the foreign-born population - Taiwan (%)
Place of birth for the foreign-born population - Japan (%)
Place of birth for the foreign-born population - Korea (%)
Place of birth for the foreign-born population - Other Eastern Asia (%)
Place of birth for the foreign-born population - Afghanistan (%)
Place of birth for the foreign-born population - Bangladesh (%)
Place of birth for the foreign-born population - India (%)
Place of birth for the foreign-born population - Iran (%)
Place of birth for the foreign-born population - Kazakhstan (%)
Place of birth for the foreign-born population - Nepal (%)
Place of birth for the foreign-born population - Pakistan (%)
Place of birth for the foreign-born population - Sri Lanka (%)
Place of birth for the foreign-born population - Uzbekistan (%)
Place of birth for the foreign-born population - Other South Central Asia (%)
Place of birth for the foreign-born population - Burma (%)
Place of birth for the foreign-born population - Cambodia (%)
Place of birth for the foreign-born population - Indonesia (%)
Place of birth for the foreign-born population - Laos (%)
Place of birth for the foreign-born population - Malaysia (%)
Place of birth for the foreign-born population - Philippines (%)
Place of birth for the foreign-born population - Singapore (%)
Place of birth for the foreign-born population - Thailand (%)
Place of birth for the foreign-born population - Vietnam (%)
Place of birth for the foreign-born population - Other South Eastern Asia (%)
Place of birth for the foreign-born population - Armenia (%)
Place of birth for the foreign-born population - Iraq (%)
Place of birth for the foreign-born population - Israel (%)
Place of birth for the foreign-born population - Jordan (%)
Place of birth for the foreign-born population - Kuwait (%)
Place of birth for the foreign-born population - Lebanon (%)
Place of birth for the foreign-born population - Saudi Arabia (%)
Place of birth for the foreign-born population - Syria (%)
Place of birth for the foreign-born population - Turkey (%)
Place of birth for the foreign-born population - Yemen (%)
Place of birth for the foreign-born population - Other Western Asia (%)
Place of birth for the foreign-born population - Eritrea (%)
Place of birth for the foreign-born population - Ethiopia (%)
Place of birth for the foreign-born population - Kenya (%)
Place of birth for the foreign-born population - Somalia (%)
Place of birth for the foreign-born population - Uganda (%)
Place of birth for the foreign-born population - Zimbabwe (%)
Place of birth for the foreign-born population - Other Eastern Africa (%)
Place of birth for the foreign-born population - Cameroon (%)
Place of birth for the foreign-born population - Congo (%)
Place of birth for the foreign-born population - Democratic Republic of Congo (Zaire) (%)
Place of birth for the foreign-born population - Other Middle Africa (%)
Place of birth for the foreign-born population - Egypt (%)
Place of birth for the foreign-born population - Morocco (%)
Place of birth for the foreign-born population - Sudan (%)
Place of birth for the foreign-born population - Other Northern Africa (%)
Place of birth for the foreign-born population - South Africa (%)
Place of birth for the foreign-born population - Other Southern Africa (%)
Place of birth for the foreign-born population - Cabo Verde (%)
Place of birth for the foreign-born population - Ghana (%)
Place of birth for the foreign-born population - Liberia (%)
Place of birth for the foreign-born population - Nigeria (%)
Place of birth for the foreign-born population - Senegal (%)
Place of birth for the foreign-born population - Sierra Leone (%)
Place of birth for the foreign-born population - Other Western Africa (%)
Place of birth for the foreign-born population - Australia (%)
Place of birth for the foreign-born population - New Zealand (%)
Place of birth for the foreign-born population - Fiji (%)
Place of birth for the foreign-born population - Micronesia (%)
Place of birth for the foreign-born population - Bahamas (%)
Place of birth for the foreign-born population - Barbados (%)
Place of birth for the foreign-born population - Cuba (%)
Place of birth for the foreign-born population - Dominica (%)
Place of birth for the foreign-born population - Dominican Republic (%)
Place of birth for the foreign-born population - Grenada (%)
Place of birth for the foreign-born population - Haiti (%)
Place of birth for the foreign-born population - Jamaica (%)
Place of birth for the foreign-born population - St. Vincent and the Grenadines (%)
Place of birth for the foreign-born population - Trinidad and Tobago (%)
Place of birth for the foreign-born population - West Indies (%)
Place of birth for the foreign-born population - Other Caribbean (%)
Place of birth for the foreign-born population - Belize (%)
Place of birth for the foreign-born population - Costa Rica (%)
Place of birth for the foreign-born population - El Salvador (%)
Place of birth for the foreign-born population - Guatemala (%)
Place of birth for the foreign-born population - Honduras (%)
Place of birth for the foreign-born population - Mexico (%)
Place of birth for the foreign-born population - Nicaragua (%)
Place of birth for the foreign-born population - Panama (%)
Place of birth for the foreign-born population - Other Central America (%)
Place of birth for the foreign-born population - Argentina (%)
Place of birth for the foreign-born population - Bolivia (%)
Place of birth for the foreign-born population - Brazil (%)
Place of birth for the foreign-born population - Chile (%)
Place of birth for the foreign-born population - Colombia (%)
Place of birth for the foreign-born population - Ecuador (%)
Place of birth for the foreign-born population - Guyana (%)
Place of birth for the foreign-born population - Peru (%)
Place of birth for the foreign-born population - Uruguay (%)
Place of birth for the foreign-born population - Venezuela (%)
Place of birth for the foreign-born population - Other South America (%)
Place of birth for the foreign-born population - Canada (%)
Place of birth for the foreign-born population - Other Northern America (%)
Place of birth for the foreign-born population - Other (%)
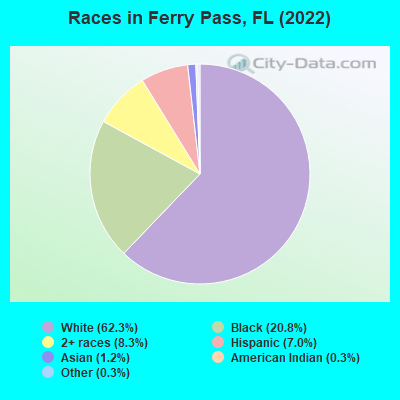
According to 2022 data, the most numerous races in Ferry Pass, FL are White alone (20,435 residents), Hispanic (2,291 residents), and Black alone (6,824 residents). 91.6% of Ferry Pass residents speak English at home. 5.2% of Ferry Pass, FL residents are foreign-born (2.6% born in Latin America, 1.5% born in Asia, 0.5% born in Europe), which is 307.2% less than the foreign-born rate of 21.0% across the entire state of Florida.
Race distribution in Ferry Pass
2000 2022
10,458,509 65.4% White alone 2,682,715 16.8% Hispanic 2,264,268 14.2% Black alone 261,693 1.6% Asian alone 236,954 1.5% Two or more races 42,358 0.3% American Indian alone 28,994 0.2% Other race alone 6,887 0.04% Native Hawaiian and Other
11,309,403 50.8% White alone 6,025,039 27.1% Hispanic 3,241,015 14.6% Black alone 861,630 3.9% Two or more races 623,692 2.8% Asian alone 152,054 0.7% Other race alone 22,504 0.1% American Indian alone 9,486 0.04% Native Hawaiian and Other
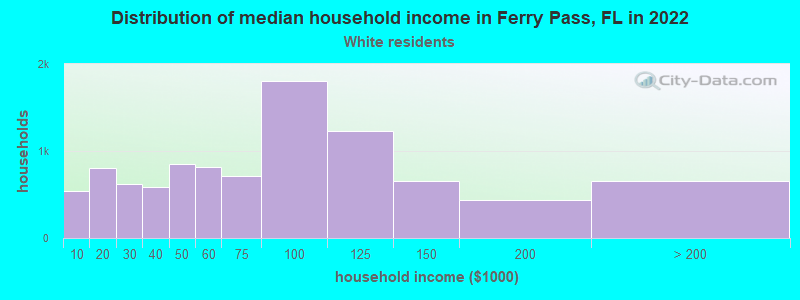
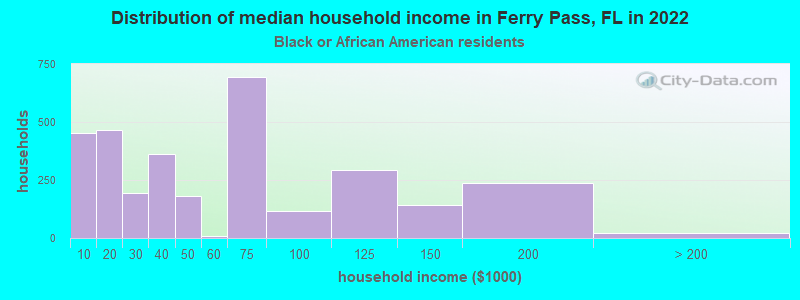
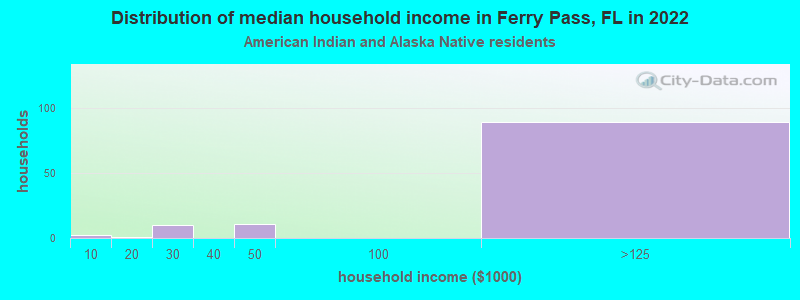
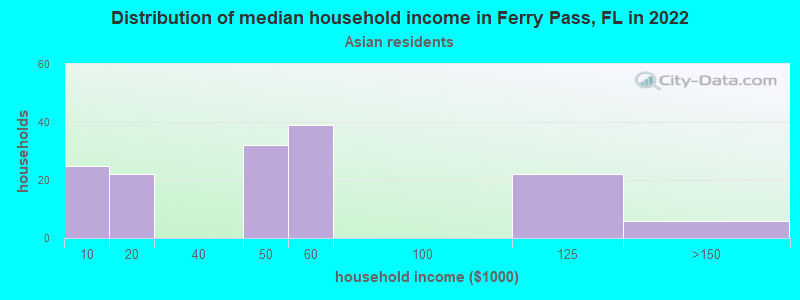
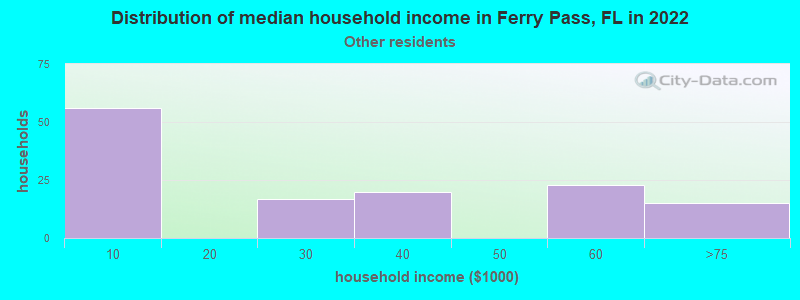
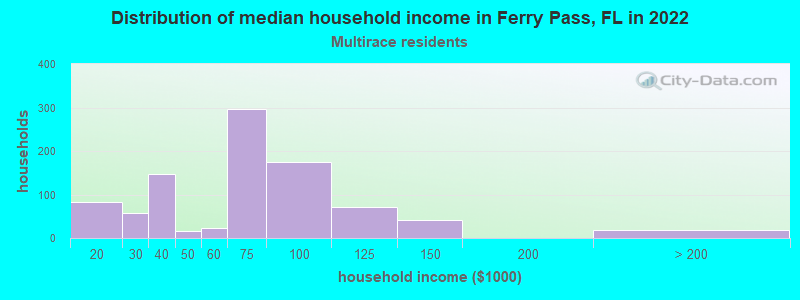
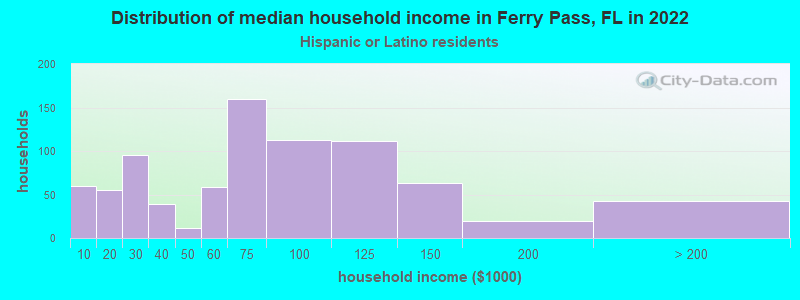
Income and house value in Ferry Pass Median household income in 2022 $70,828 White non-Hispanic householders$42,411 Black householders$135,943 American Indian and Alaska Native householders$52,409 Asian householders$56,048 Two or more races householders$72,052 Hispanic or Latino race householdersMedian 2022 house value $263,739 White Non-Hispanic householders$218,824 Black or African American householders$195,545 American Indian or Alaska Native householders $313,310 Asian householders$260,179 Some other race householders$166,514 Two or more races householders$238,817 Hispanic or Latino householders
Median age by race in Ferry Pass
40.0 Median age for White residents37.4 41.2 33.7 Median age for Black or African American residents36.5 30.6 20.3 Median age for American Indian / Alaska Native residents24.5 72.0 39.7 Median age for Asian residents67.5 41.1 -679,849,340.2 Median age for Native Hawaiian / Pacific Islander residents-858,307,848.3 -443,298,968.6 45.9 Median age for Other race residents47.8 53.2 23.0 Median age for Two or more races residents26.9 20.0 41.2 Median age for White alone residents40.1 42.7 32.8 Median age for Hispanic or Latino residents34.5 27.7
Owner/renter occupied households by race in Ferry Pass
House owners and renters - White residents 5,327 55.8% Owner occupied4,214 44.2% Renter occupiedHouse owners and renters - Black or African American residents 466 15.7% Owner occupied2,502 84.3% Renter occupiedHouse owners and renters - American Indian / Alaska Native residents 60 71.2% Owner occupied24 28.8% Renter occupiedHouse owners and renters - Asian residents 70 44.8% Owner occupied87 55.2% Renter occupiedHouse owners and renters - Other race residents 45 32.1% Owner occupied94 67.9% Renter occupiedHouse owners and renters - Two or more races residents 261 26.5% Owner occupied723 73.5% Renter occupiedHouse owners and renters - White alone residents 5,204 56.2% Owner occupied4,050 43.8% Renter occupiedHouse owners and renters - Hispanic or Latino residents 347 44.2% Owner occupied438 55.8% Renter occupied
Language usage in Ferry Pass
English speakers - Total 91.6% of residents of Ferry Pass speak English at home.
4.6% of residents speak Spanish at home 499 34.2% Speak English very well958 65.8% Speak English less than very well4.1% of residents speak other language at home 1,151 90.5% Speak English very well121 9.5% Speak English less than very well
English speakers - Born in the United States 95.6% of residents of Ferry Pass speak English at home.
3.2% of residents speak Spanish at home 409 78.1% Speak English very well115 21.9% Speak English less than very well1.5% of residents speak other language at home 229 92.0% Speak English very well20 8.0% Speak English less than very well
English speakers - Native, born elsewhere 73.4% of residents of Ferry Pass speak English at home.
20.7% of residents speak Spanish at home 96 77.4% Speak English very well28 22.6% Speak English less than very well5.7% of residents speak other language at home 28 82.4% Speak English very well6 17.6% Speak English less than very well
English speakers - Foreign-born 15.0% of residents of Ferry Pass speak English at home.
38.4% of residents speak Spanish at home 62 9.9% Speak English very well562 90.1% Speak English less than very well50.2% of residents speak other language at home 702 86.1% Speak English very well113 13.9% Speak English less than very well
White (Caucasian) - Speak only English Native:
97.0% (19,551)Foreign-born:
14.9% (88)
White (Caucasian) - Speak another language Native:
3.0% (609)Foreign-born:
83.0% (492)
Black or African American - Speak only English Native:
94.8% (5,773)Foreign-born:
13.3% (66)
Black or African American - Speak another language Native:
6.8% (411)Foreign-born:
92.1% (459)
Asian - Speak only English Native:
50.6% (82)Foreign-born:
21.8% (54)
Asian - Speak another language Native:
49.9% (81)Foreign-born:
78.2% (195)
Other race - Speak only English Native:
100.0% (298)Foreign-born:
4.4% (12)
Other race - Speak another language Native:
17.2% (51)Foreign-born:
99.2% (284)
Two or more races - Speak only English Native:
95.6% (2,662)Foreign-born:
28.1% (29)
Two or more races - Speak another language Native:
4.6% (129)Foreign-born:
71.7% (73)
White alone - Speak only English Native:
97.9% (19,132)Foreign-born:
28.7% (90)
White alone - Speak another language Native:
2.1% (412)Foreign-born:
75.8% (237)
Hispanic or Latino - Speak only English Native:
71.6% (1,176)Foreign-born:
2.6% (14)
Hispanic or Latino - Speak another language Native:
28.8% (473)Foreign-born:
97.9% (535)
Foreign-born residents in Ferry Pass 1,692 residents are foreign born (2.6% Latin America , 1.5% Asia , 0.5% Europe ).
This city:
5.2%Florida:
21.1%
Marital status for residents in Ferry Pass Marital status - White (Caucasian) population 15 years and over
Males 38.3% Never married45.2% Now married0.7% Separated4.0% Widowed11.8% DivorcedFemales 33.5% Never married36.6% Now married1.2% Separated12.7% Widowed16.0% DivorcedWomen who gave birth in the past 12 months Now married:
55.9% (102)Unmarried:
44.1% (81)
Women who did not give birth in the past 12 months Now married:
32.7% (1,666)Unmarried:
67.3% (3,435)
Marital status - Black or African American population 15 years and over
Males 41.6% Never married37.6% Now married5.9% Separated0.8% Widowed14.0% DivorcedFemales 53.0% Never married24.3% Now married1.5% Separated3.3% Widowed17.9% DivorcedWomen who gave birth in the past 12 months Now married:
0.0% (0)Unmarried:
100.0% (196)
Women who did not give birth in the past 12 months Now married:
18.2% (317)Unmarried:
81.8% (1,425)
Marital status - American Indian / Alaska Native population 15 years and over
Males 97.7% Never married2.3% Now married0.0% Separated0.0% Widowed0.0% DivorcedFemales 0.0% Never married0.0% Now married36.8% Separated36.8% Widowed26.3% DivorcedWomen who did not give birth in the past 12 months Now married:
100.0% (11)Unmarried:
0.0% (0)
Marital status - Asian population 15 years and over
Males 47.2% Never married16.0% Now married0.0% Separated28.0% Widowed8.8% DivorcedFemales 57.1% Never married42.9% Now married0.0% Separated0.0% Widowed0.0% DivorcedWomen who gave birth in the past 12 months Now married:
100.0% (9)Unmarried:
0.0% (0)
Women who did not give birth in the past 12 months Now married:
22.7% (51)Unmarried:
77.3% (173)
Marital status - Other race population 15 years and over
Males 57.9% Never married42.1% Now married0.0% Separated0.0% Widowed0.0% DivorcedFemales 39.2% Never married32.0% Now married0.0% Separated4.8% Widowed24.0% DivorcedWomen who did not give birth in the past 12 months Now married:
44.9% (64)Unmarried:
55.1% (79)
Marital status - Two or more races population 15 years and over
Males 48.6% Never married24.2% Now married0.0% Separated0.0% Widowed27.1% DivorcedFemales 66.1% Never married16.3% Now married0.0% Separated0.7% Widowed16.9% DivorcedWomen who gave birth in the past 12 months Now married:
100.0% (17)Unmarried:
0.0% (0)
Women who did not give birth in the past 12 months Now married:
6.8% (80)Unmarried:
93.2% (1,087)
Marital status - White alone, not Hispanic / Latino population 15 years and over
Males 37.2% Never married46.1% Now married0.8% Separated3.9% Widowed12.0% DivorcedFemales 33.2% Never married35.9% Now married1.3% Separated13.2% Widowed16.4% DivorcedWomen who gave birth in the past 12 months Now married:
55.9% (105)Unmarried:
44.1% (83)
Women who did not give birth in the past 12 months Now married:
31.5% (1,539)Unmarried:
68.5% (3,344)
Marital status - Hispanic or Latino population 15 years and over
Males 56.7% Never married33.8% Now married0.0% Separated3.2% Widowed6.3% DivorcedFemales 43.7% Never married41.0% Now married0.0% Separated1.8% Widowed13.5% DivorcedWomen who did not give birth in the past 12 months Now married:
39.4% (228)Unmarried:
60.6% (351)
Ancestries in Ferry Pass
1,879 11.3% English1,757 10.6% Irish1,150 6.9% German1,109 6.7% American722 4.3% European361 2.2% Scotch-Irish299 1.8% Scottish236 1.4% Italian223 1.3% African169 1.0% French142 0.9% Polish138 0.8% Haitian135 0.8% Scandinavian96 0.6% Russian83 0.5% Hungarian80 0.5% French Canadian78 0.5% Brazilian72 0.4% Norwegian64 0.4% Swedish62 0.4% Belgian62 0.4% Jamaican50 0.3% Ghanaian50 0.3% Czech48 0.3% Lithuanian41 0.2% Romanian37 0.2% Croatian35 0.2% Danish32 0.2% British24 0.1% Eastern European21 0.1% Dutch17 0.1% Iranian17 0.1% Greek12 0.07% Moroccan11 0.07% Egyptian11 0.07% Austrian11 0.07% Cajun11 0.07% Maltese9 0.05% Portuguese9 0.05% West Indian7 0.04% Northern European7 0.04% Barbadian7 0.04% Welsh5 0.03% Bahamian2 0.01% Kenyan
Geographical mobility in Ferry Pass Same house 1 year ago 17,199 80.8% White (Caucasian)5,385 81.5% Black or African American77 33.5% American Indian / Alaska Native242 58.8% Asian15 100.0% Native Hawaiian / Pacific Islander589 98.1% Other race2,429 73.9% Two or more races16,483 81.0% White alone, not Hispanic / Latino1,938 85.3% Hispanic or LatinoMoved within same county 1,654 7.8% White / Caucasian691 10.5% Black or African American88 37.9% American Indian / Alaska Native107 25.9% Asian23 3.8% Other race352 10.7% Two or more races1,627 8.0% White alone, not Hispanic / Latino152 6.7% Hispanic or LatinoMoved within same state 541 2.5% White / Caucasian332 5.0% Black or African American8 2.0% Asian21 3.5% Other race247 7.5% Two or more races491 2.4% White alone, not Hispanic / Latino173 7.6% Hispanic or LatinoMoved from different state 1,574 7.4% White / Caucasian119 1.8% Black or African American34 14.5% American Indian / Alaska Native13 3.2% Asian5 0.9% Other race111 3.4% Two or more races1,500 7.4% White alone, not Hispanic / Latino158 6.9% Hispanic or LatinoMoved from abroad 51 0.2% White54 0.8% Black or African American33 8.0% Asian101 3.1% Two or more races54 0.3% White alone, not Hispanic / Latino44 1.9% Hispanic or Latino
Children Nativity (place of birth) in Ferry Pass
Children under 6 years - Living with two parents Both parents native 761 100.0% NativeBoth parents foreign-born 14 100.0% Foreign-bornOne native, one foreign-born parent 70 100.0% NativeChildren under 6 years - Living with one parent Native parent 830 100.0% NativeChildren 6 to 17 years - Living with two parents Both parents native 1,382 100.0% NativeBoth parents foreign-born 9 40.6% Native13 59.4% Foreign-bornOne native, one foreign-born parent 179 100.0% NativeChildren 6 to 17 years - Living with one parent Native parent 1,796 100.0% NativeForeign-born parent 13 50.6% Native13 49.4% Foreign-born
Grandparents responsible for own grandchildren in Ferry Pass
Grandparents (30 to 59 years) White / Caucasian 75 84.3% Responsible for grandchildren14 15.7% Not responsible for grandchildrenBlack or African American 113 100.0% Not responsible for grandchildrenWhite alone, not Hispanic / Latino 76 84.5% Responsible for grandchildren14 15.5% Not responsible for grandchildrenGrandparents (60 years and over) White / Caucasian 30 27.8% Responsible for grandchildren78 72.2% Not responsible for grandchildrenBlack or African American 31 100.0% Responsible for grandchildrenWhite alone, not Hispanic / Latino 31 28.4% Responsible for grandchildren79 71.6% Not responsible for grandchildren