Races in Fernley, Nevada (NV) Detailed Stats
Data:
Races - White alone (%)
Races - White alone (% change since 2000)
Races - Black alone (%)
Races - Black alone (% change since 2000)
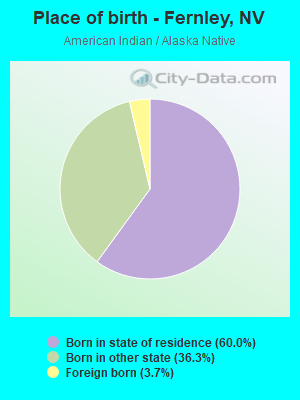
Races - American Indian alone (%)
Races - American Indian alone (% change since 2000)
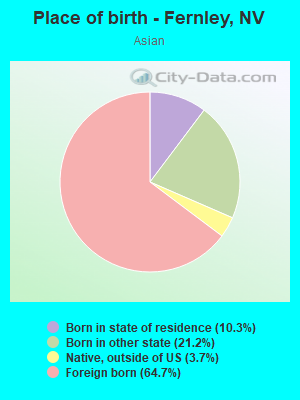
Races - Asian alone (%)
Races - Asian alone (% change since 2000)
Races - Hispanic (%)
Races - Hispanic (% change since 2000)
Races - Native Hawaiian and Other Pacific Islander alone (%)
Races - Native Hawaiian and Other Pacific Islander alone (% change since 2000)
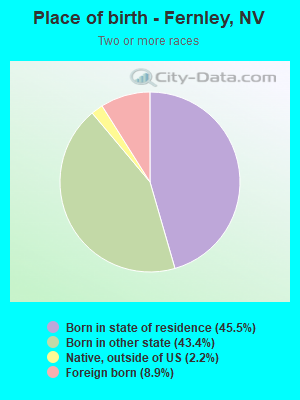
Races - Two or more races(%)
Races - Two or more races(% change since 2000)
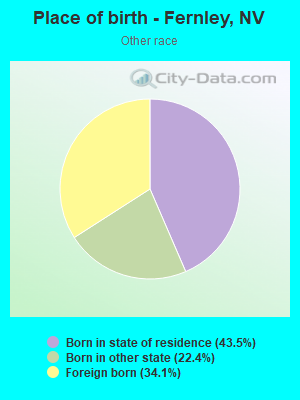
Races - Other race alone (%)
Races - Other race alone (% change since 2000)
Racial diversity
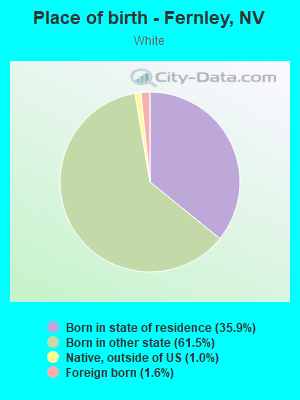
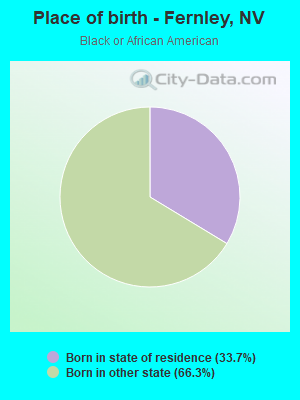
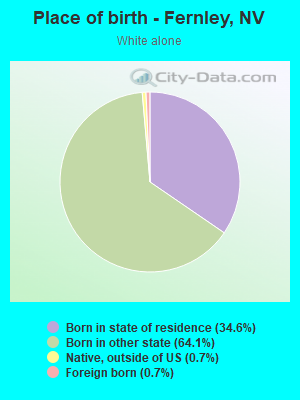
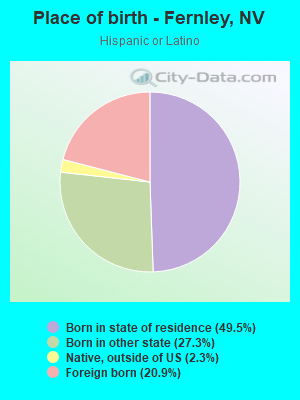
Place of birth - Born in state of residence (%)
Place of birth - Born in state of residence (%) - White
Place of birth - Born in state of residence (%) - Black or African American
Place of birth - Born in state of residence (%) - Asian
Place of birth - Born in state of residence (%) - Hispanic or Latino
Place of birth - Born in state of residence (%) - American Indian and Alaska Native
Place of birth - Born in state of residence (%) - Multirace
Place of birth - Born in state of residence (%) - Other Race
Place of birth - Born in other state (%)
Place of birth - Born in other state (%) - White
Place of birth - Born in other state (%) - Black or African American
Place of birth - Born in other state (%) - Asian
Place of birth - Born in other state (%) - Hispanic or Latino
Place of birth - Born in other state (%) - American Indian and Alaska Native
Place of birth - Born in other state (%) - Multirace
Place of birth - Born in other state (%) - Other Race
Place of birth - Native, outside of US (%)
Place of birth - Native, outside of US (%) - White
Place of birth - Native, outside of US (%) - Black or African American
Place of birth - Native, outside of US (%) - Asian
Place of birth - Native, outside of US (%) - Hispanic or Latino
Place of birth - Native, outside of US (%) - American Indian and Alaska Native
Place of birth - Native, outside of US (%) - Multirace
Place of birth - Native, outside of US (%) - Other Race
Place of birth - Foreign born (%)
Place of birth - Foreign born (%) - White
Place of birth - Foreign born (%) - Black or African American
Place of birth - Foreign born (%) - Asian
Place of birth - Foreign born (%) - Hispanic or Latino
Place of birth - Foreign born (%) - American Indian and Alaska Native
Place of birth - Foreign born (%) - Multirace
Place of birth - Foreign born (%) - Other Race
Residents speaking English at home (%)
Residents speaking English at home - Born in the United States (%)
Residents speaking English at home - Native, born elsewhere (%)
Residents speaking English at home - Foreign born (%)
Residents speaking Spanish at home (%)
Residents speaking Spanish at home - Born in the United States (%)
Residents speaking Spanish at home - Native, born elsewhere (%)
Residents speaking Spanish at home - Foreign born (%)
Residents speaking other language at home (%)
Residents speaking other language at home - Born in the United States (%)
Residents speaking other language at home - Native, born elsewhere (%)
Residents speaking other language at home - Foreign born (%)
Marital status - Never married (%)
Marital status - Now married (%)
Marital status - Separated (%)
Marital status - Widowed (%)
Marital status - Divorced (%)
Ancestries Reported - Arab (%)
Ancestries Reported - Czech (%)
Ancestries Reported - Danish (%)
Ancestries Reported - Dutch (%)
Ancestries Reported - English (%)
Ancestries Reported - French (%)
Ancestries Reported - French Canadian (%)
Ancestries Reported - German (%)
Ancestries Reported - Greek (%)
Ancestries Reported - Hungarian (%)
Ancestries Reported - Irish (%)
Ancestries Reported - Italian (%)
Ancestries Reported - Lithuanian (%)
Ancestries Reported - Norwegian (%)
Ancestries Reported - Polish (%)
Ancestries Reported - Portuguese (%)
Ancestries Reported - Russian (%)
Ancestries Reported - Scotch-Irish (%)
Ancestries Reported - Scottish (%)
Ancestries Reported - Slovak (%)
Ancestries Reported - Subsaharan African (%)
Ancestries Reported - Swedish (%)
Ancestries Reported - Swiss (%)
Ancestries Reported - Ukrainian (%)
Ancestries Reported - United States (%)
Ancestries Reported - Welsh (%)
Ancestries Reported - West Indian (%)
Ancestries Reported - Other (%)
Geographical mobility - Same house 1 year ago (%)
Geographical mobility - Same house 1 year ago (%) - White
Geographical mobility - Same house 1 year ago (%) - Black or African American
Geographical mobility - Same house 1 year ago (%) - Asian
Geographical mobility - Same house 1 year ago (%) - Hispanic or Latino
Geographical mobility - Same house 1 year ago (%) - American Indian and Alaska Native
Geographical mobility - Same house 1 year ago (%) - Multirace
Geographical mobility - Same house 1 year ago (%) - Other Race
Geographical mobility - Moved within same county (%)
Geographical mobility - Moved within same county (%) - White
Geographical mobility - Moved within same county (%) - Black or African American
Geographical mobility - Moved within same county (%) - Asian
Geographical mobility - Moved within same county (%) - Hispanic or Latino
Geographical mobility - Moved within same county (%) - American Indian and Alaska Native
Geographical mobility - Moved within same county (%) - Multirace
Geographical mobility - Moved within same county (%) - Other Race
Geographical mobility - Moved from different county within same state (%)
Geographical mobility - Moved from different county within same state (%) - White
Geographical mobility - Moved from different county within same state (%) - Black or African American
Geographical mobility - Moved from different county within same state (%) - Asian
Geographical mobility - Moved from different county within same state (%) - Hispanic or Latino
Geographical mobility - Moved from different county within same state (%) - American Indian and Alaska Native
Geographical mobility - Moved from different county within same state (%) - Multirace
Geographical mobility - Moved from different county within same state (%) - Other Race
Geographical mobility - Moved from different state (%)
Geographical mobility - Moved from different state (%) - White
Geographical mobility - Moved from different state (%) - Black or African American
Geographical mobility - Moved from different state (%) - Asian
Geographical mobility - Moved from different state (%) - Hispanic or Latino
Geographical mobility - Moved from different state (%) - American Indian and Alaska Native
Geographical mobility - Moved from different state (%) - Multirace
Geographical mobility - Moved from different state (%) - Other Race
Geographical mobility - Moved from abroad (%)
Geographical mobility - Moved from abroad (%) - White
Geographical mobility - Moved from abroad (%) - Black or African American
Geographical mobility - Moved from abroad (%) - Asian
Geographical mobility - Moved from abroad (%) - Hispanic or Latino
Geographical mobility - Moved from abroad (%) - American Indian and Alaska Native
Geographical mobility - Moved from abroad (%) - Multirace
Geographical mobility - Moved from abroad (%) - Other Race
Place of birth for the foreign-born population - Ireland (%)
Place of birth for the foreign-born population - Denmark (%)
Place of birth for the foreign-born population - Norway (%)
Place of birth for the foreign-born population - Sweden (%)
Place of birth for the foreign-born population - United Kingdom (%)
Place of birth for the foreign-born population - England (%)
Place of birth for the foreign-born population - Scotland (%)
Place of birth for the foreign-born population - Other Northern Europe (%)
Place of birth for the foreign-born population - Austria (%)
Place of birth for the foreign-born population - Belgium (%)
Place of birth for the foreign-born population - France (%)
Place of birth for the foreign-born population - Germany (%)
Place of birth for the foreign-born population - Netherlands (%)
Place of birth for the foreign-born population - Switzerland (%)
Place of birth for the foreign-born population - Other Western Europe (%)
Place of birth for the foreign-born population - Greece (%)
Place of birth for the foreign-born population - Italy (%)
Place of birth for the foreign-born population - Portugal (%)
Place of birth for the foreign-born population - Spain (%)
Place of birth for the foreign-born population - Other Southern Europe (%)
Place of birth for the foreign-born population - Albania (%)
Place of birth for the foreign-born population - Belarus (%)
Place of birth for the foreign-born population - Bosnia and Herzegovina (%)
Place of birth for the foreign-born population - Bulgaria (%)
Place of birth for the foreign-born population - Croatia (%)
Place of birth for the foreign-born population - Czechoslovakia (%)
Place of birth for the foreign-born population - Hungary (%)
Place of birth for the foreign-born population - Latvia (%)
Place of birth for the foreign-born population - Lithuania (%)
Place of birth for the foreign-born population - North Macedonia (Macedonia) (%)
Place of birth for the foreign-born population - Moldova (%)
Place of birth for the foreign-born population - Poland (%)
Place of birth for the foreign-born population - Romania (%)
Place of birth for the foreign-born population - Russia (%)
Place of birth for the foreign-born population - Serbia (%)
Place of birth for the foreign-born population - Ukraine (%)
Place of birth for the foreign-born population - Other Eastern Europe (%)
Place of birth for the foreign-born population - China (%)
Place of birth for the foreign-born population - Hong Kong (%)
Place of birth for the foreign-born population - Taiwan (%)
Place of birth for the foreign-born population - Japan (%)
Place of birth for the foreign-born population - Korea (%)
Place of birth for the foreign-born population - Other Eastern Asia (%)
Place of birth for the foreign-born population - Afghanistan (%)
Place of birth for the foreign-born population - Bangladesh (%)
Place of birth for the foreign-born population - India (%)
Place of birth for the foreign-born population - Iran (%)
Place of birth for the foreign-born population - Kazakhstan (%)
Place of birth for the foreign-born population - Nepal (%)
Place of birth for the foreign-born population - Pakistan (%)
Place of birth for the foreign-born population - Sri Lanka (%)
Place of birth for the foreign-born population - Uzbekistan (%)
Place of birth for the foreign-born population - Other South Central Asia (%)
Place of birth for the foreign-born population - Burma (%)
Place of birth for the foreign-born population - Cambodia (%)
Place of birth for the foreign-born population - Indonesia (%)
Place of birth for the foreign-born population - Laos (%)
Place of birth for the foreign-born population - Malaysia (%)
Place of birth for the foreign-born population - Philippines (%)
Place of birth for the foreign-born population - Singapore (%)
Place of birth for the foreign-born population - Thailand (%)
Place of birth for the foreign-born population - Vietnam (%)
Place of birth for the foreign-born population - Other South Eastern Asia (%)
Place of birth for the foreign-born population - Armenia (%)
Place of birth for the foreign-born population - Iraq (%)
Place of birth for the foreign-born population - Israel (%)
Place of birth for the foreign-born population - Jordan (%)
Place of birth for the foreign-born population - Kuwait (%)
Place of birth for the foreign-born population - Lebanon (%)
Place of birth for the foreign-born population - Saudi Arabia (%)
Place of birth for the foreign-born population - Syria (%)
Place of birth for the foreign-born population - Turkey (%)
Place of birth for the foreign-born population - Yemen (%)
Place of birth for the foreign-born population - Other Western Asia (%)
Place of birth for the foreign-born population - Eritrea (%)
Place of birth for the foreign-born population - Ethiopia (%)
Place of birth for the foreign-born population - Kenya (%)
Place of birth for the foreign-born population - Somalia (%)
Place of birth for the foreign-born population - Uganda (%)
Place of birth for the foreign-born population - Zimbabwe (%)
Place of birth for the foreign-born population - Other Eastern Africa (%)
Place of birth for the foreign-born population - Cameroon (%)
Place of birth for the foreign-born population - Congo (%)
Place of birth for the foreign-born population - Democratic Republic of Congo (Zaire) (%)
Place of birth for the foreign-born population - Other Middle Africa (%)
Place of birth for the foreign-born population - Egypt (%)
Place of birth for the foreign-born population - Morocco (%)
Place of birth for the foreign-born population - Sudan (%)
Place of birth for the foreign-born population - Other Northern Africa (%)
Place of birth for the foreign-born population - South Africa (%)
Place of birth for the foreign-born population - Other Southern Africa (%)
Place of birth for the foreign-born population - Cabo Verde (%)
Place of birth for the foreign-born population - Ghana (%)
Place of birth for the foreign-born population - Liberia (%)
Place of birth for the foreign-born population - Nigeria (%)
Place of birth for the foreign-born population - Senegal (%)
Place of birth for the foreign-born population - Sierra Leone (%)
Place of birth for the foreign-born population - Other Western Africa (%)
Place of birth for the foreign-born population - Australia (%)
Place of birth for the foreign-born population - New Zealand (%)
Place of birth for the foreign-born population - Fiji (%)
Place of birth for the foreign-born population - Micronesia (%)
Place of birth for the foreign-born population - Bahamas (%)
Place of birth for the foreign-born population - Barbados (%)
Place of birth for the foreign-born population - Cuba (%)
Place of birth for the foreign-born population - Dominica (%)
Place of birth for the foreign-born population - Dominican Republic (%)
Place of birth for the foreign-born population - Grenada (%)
Place of birth for the foreign-born population - Haiti (%)
Place of birth for the foreign-born population - Jamaica (%)
Place of birth for the foreign-born population - St. Vincent and the Grenadines (%)
Place of birth for the foreign-born population - Trinidad and Tobago (%)
Place of birth for the foreign-born population - West Indies (%)
Place of birth for the foreign-born population - Other Caribbean (%)
Place of birth for the foreign-born population - Belize (%)
Place of birth for the foreign-born population - Costa Rica (%)
Place of birth for the foreign-born population - El Salvador (%)
Place of birth for the foreign-born population - Guatemala (%)
Place of birth for the foreign-born population - Honduras (%)
Place of birth for the foreign-born population - Mexico (%)
Place of birth for the foreign-born population - Nicaragua (%)
Place of birth for the foreign-born population - Panama (%)
Place of birth for the foreign-born population - Other Central America (%)
Place of birth for the foreign-born population - Argentina (%)
Place of birth for the foreign-born population - Bolivia (%)
Place of birth for the foreign-born population - Brazil (%)
Place of birth for the foreign-born population - Chile (%)
Place of birth for the foreign-born population - Colombia (%)
Place of birth for the foreign-born population - Ecuador (%)
Place of birth for the foreign-born population - Guyana (%)
Place of birth for the foreign-born population - Peru (%)
Place of birth for the foreign-born population - Uruguay (%)
Place of birth for the foreign-born population - Venezuela (%)
Place of birth for the foreign-born population - Other South America (%)
Place of birth for the foreign-born population - Canada (%)
Place of birth for the foreign-born population - Other Northern America (%)
Place of birth for the foreign-born population - Other (%)
Latest news about races in Fernley, NV collected exclusively by city-data.com from local newspapers, TV, and radio stations
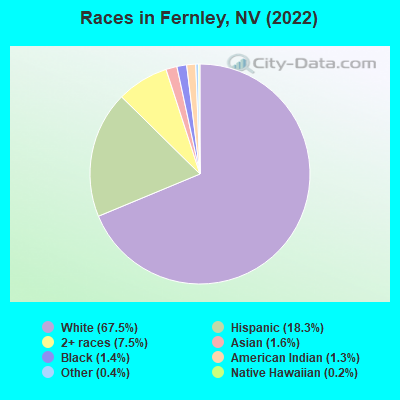
According to 2022 data, the most numerous races in Fernley, NV are White alone (15,909 residents), Hispanic (4,324 residents), and Black alone (327 residents). 87.2% of Fernley residents speak English at home. 5.4% of Fernley, NV residents are foreign-born (3.8% born in Latin America, 1.1% born in Asia), which is 234.9% less than the foreign-born rate of 18.0% across the entire state of Nevada.
Race distribution in Fernley
2000 2022
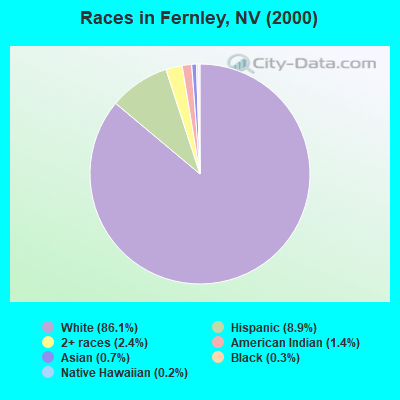
1,303,001 65.2% White alone 393,970 19.7% Hispanic 131,509 6.6% Black alone 88,593 4.4% Asian alone 49,231 2.5% Two or more races 21,397 1.1% American Indian alone 7,769 0.4% Native Hawaiian and Other 2,787 0.1% Other race alone
1,410,145 44.4% White alone 961,357 30.3% Hispanic 286,471 9.0% Black alone 281,149 8.8% Asian alone 182,151 5.7% Two or more races 20,102 0.6% Native Hawaiian and Other 18,781 0.6% Other race alone 17,616 0.6% American Indian alone
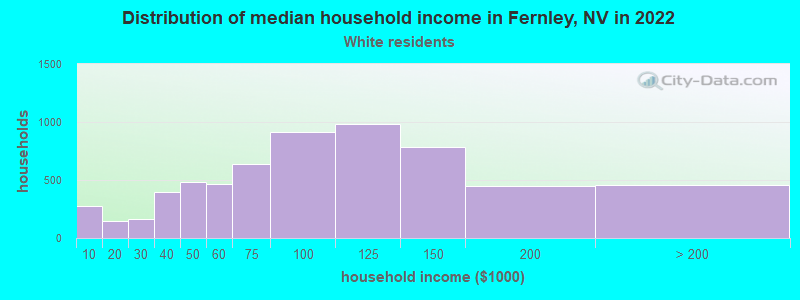
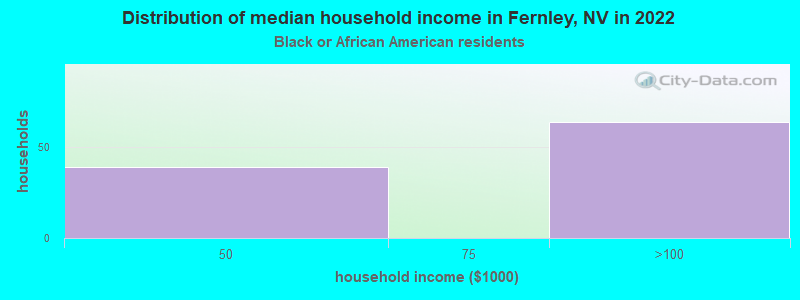
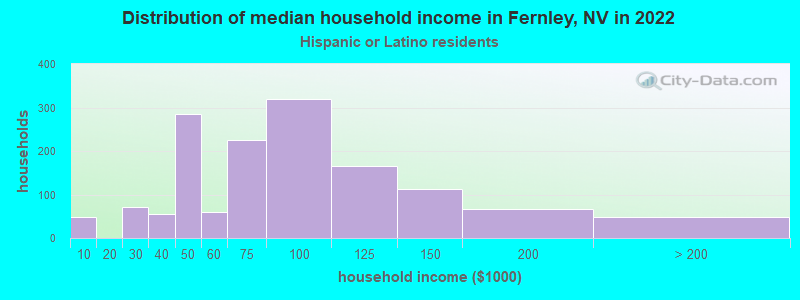
Income and house value in Fernley Median household income in 2022 $89,132 White non-Hispanic householders$93,299 Black householders$56,954 Asian householders$69,745 Some other race householders$86,271 Two or more races householders$73,277 Hispanic or Latino race householdersMedian 2022 house value $427,584 White Non-Hispanic householders$327,057 American Indian or Alaska Native householders$367,681 Some other race householders$533,619 Two or more races householders$394,190 Hispanic or Latino householders
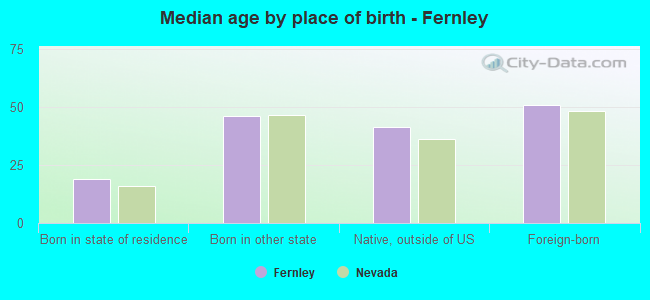
Median age by race in Fernley
39.6 Median age for White residents41.0 39.1 31.7 Median age for Black or African American residents50.2 20.2 42.4 Median age for American Indian / Alaska Native residents35.2 56.6 44.7 Median age for Asian residents42.9 44.6 -690,618,761.8 Median age for Native Hawaiian / Pacific Islander residents-648,090,814.6 -725,146,198.1 35.8 Median age for Other race residents37.7 35.7 29.5 Median age for Two or more races residents28.6 29.0 40.4 Median age for White alone residents41.9 39.8 28.4 Median age for Hispanic or Latino residents30.0 24.2
Owner/renter occupied households by race in Fernley
House owners and renters - White residents 4,966 79.3% Owner occupied1,298 20.7% Renter occupiedHouse owners and renters - Black or African American residents 61 61.4% Owner occupied38 38.6% Renter occupiedHouse owners and renters - American Indian / Alaska Native residents 134 49.7% Owner occupied136 50.3% Renter occupiedHouse owners and renters - Asian residents 172 90.8% Owner occupied17 9.2% Renter occupiedHouse owners and renters - Native Hawaiian / Pacific Islander residents 54 100.0% Owner occupiedHouse owners and renters - Other race residents 222 47.3% Owner occupied247 52.7% Renter occupiedHouse owners and renters - Two or more races residents 785 62.3% Owner occupied476 37.7% Renter occupiedHouse owners and renters - White alone residents 4,786 81.1% Owner occupied1,115 18.9% Renter occupiedHouse owners and renters - Hispanic or Latino residents 812 55.3% Owner occupied657 44.7% Renter occupied
Language usage in Fernley
English speakers - Total 87.2% of residents of Fernley speak English at home.
10.6% of residents speak Spanish at home 1,595 67.6% Speak English very well763 32.4% Speak English less than very well2.1% of residents speak other language at home 418 87.4% Speak English very well60 12.6% Speak English less than very well
English speakers - Born in the United States 93.5% of residents of Fernley speak English at home.
4.7% of residents speak Spanish at home 580 96.3% Speak English very well22 3.7% Speak English less than very well1.7% of residents speak other language at home 209 95.9% Speak English very well9 4.1% Speak English less than very well
English speakers - Native, born elsewhere 61.2% of residents of Fernley speak English at home.
38.8% of residents speak Spanish at home 82 77.4% Speak English very well24 22.6% Speak English less than very well0.4% of residents speak other language at home 1 100.0% Speak English very well
English speakers - Foreign-born 27.9% of residents of Fernley speak English at home.
63.7% of residents speak Spanish at home 151 18.9% Speak English very well646 81.1% Speak English less than very well7.8% of residents speak other language at home 75 76.5% Speak English very well23 23.5% Speak English less than very well
White (Caucasian) - Speak only English Native:
98.0% (15,299)Foreign-born:
33.3% (87)
White (Caucasian) - Speak another language Native:
3.4% (525)Foreign-born:
66.1% (173)
American Indian / Alaska Native - Speak another language Native:
19.1% (81)Foreign-born:
100.0% (16)
Asian - Speak only English Native:
87.5% (109)Foreign-born:
72.8% (180)
Asian - Speak another language Native:
14.2% (18)Foreign-born:
29.5% (73)
Other race - Speak only English Native:
28.5% (223)Foreign-born:
22.9% (91)
Other race - Speak another language Native:
71.8% (562)Foreign-born:
77.0% (307)
Two or more races - Speak another language Native:
17.9% (540)Foreign-born:
100.0% (303)
White alone - Speak only English Native:
98.4% (14,766)Foreign-born:
85.7% (96)
White alone - Speak another language Native:
1.6% (246)Foreign-born:
12.9% (14)
Hispanic or Latino - Speak only English Native:
52.5% (1,596)Foreign-born:
9.3% (83)
Hispanic or Latino - Speak another language Native:
47.7% (1,451)Foreign-born:
90.6% (805)
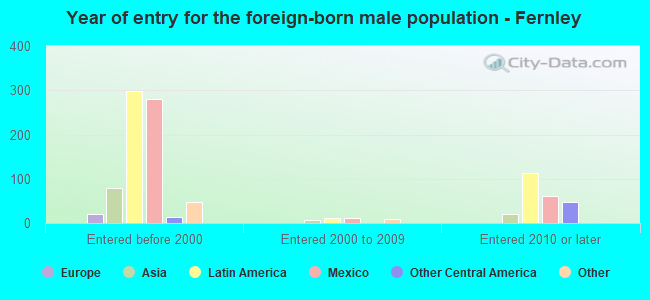
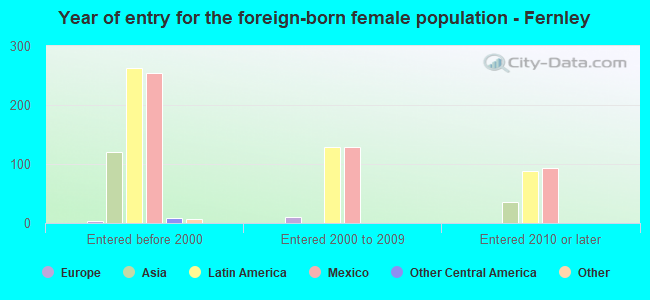
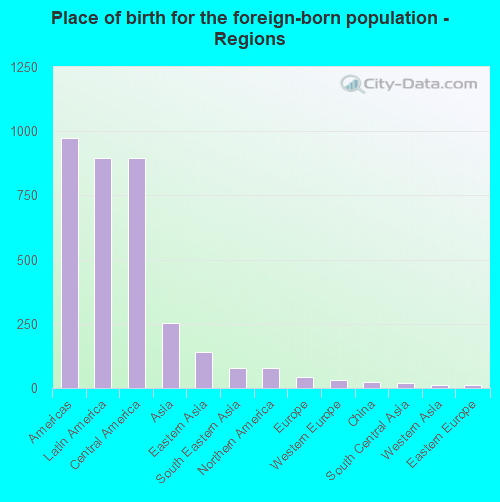
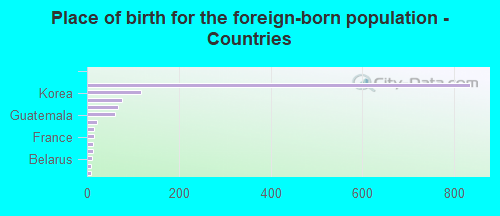
Foreign-born residents in Fernley 1,267 residents are foreign born (3.8% Latin America , 1.1% Asia ).
This city:
5.4%Nevada:
19.1%
Marital status for residents in Fernley Marital status - White (Caucasian) population 15 years and over
Males 28.0% Never married53.4% Now married1.4% Separated2.2% Widowed14.9% DivorcedFemales 21.8% Never married54.9% Now married0.9% Separated5.7% Widowed16.7% DivorcedWomen who gave birth in the past 12 months Now married:
84.0% (365)Unmarried:
16.0% (69)
Women who did not give birth in the past 12 months Now married:
47.2% (1,515)Unmarried:
52.8% (1,693)
Marital status - Black or African American population 15 years and over
Males 48.9% Never married36.3% Now married0.0% Separated0.0% Widowed14.8% DivorcedFemales 71.1% Never married28.9% Now married0.0% Separated0.0% Widowed0.0% DivorcedWomen who did not give birth in the past 12 months Now married:
24.3% (46)Unmarried:
75.7% (144)
Marital status - American Indian / Alaska Native population 15 years and over
Males 55.4% Never married25.0% Now married0.0% Separated0.0% Widowed19.6% DivorcedFemales 10.4% Never married73.6% Now married10.4% Separated0.0% Widowed5.7% DivorcedWomen who did not give birth in the past 12 months Now married:
46.9% (18)Unmarried:
53.1% (20)
Marital status - Asian population 15 years and over
Males 28.8% Never married71.2% Now married0.0% Separated0.0% Widowed0.0% DivorcedFemales 16.4% Never married83.6% Now married0.0% Separated0.0% Widowed0.0% DivorcedWomen who gave birth in the past 12 months Now married:
100.0% (7)Unmarried:
0.0% (0)
Women who did not give birth in the past 12 months Now married:
75.4% (117)Unmarried:
24.6% (38)
Marital status - Other race population 15 years and over
Males 20.3% Never married76.6% Now married0.0% Separated0.0% Widowed3.1% DivorcedFemales 33.5% Never married49.5% Now married13.4% Separated0.0% Widowed3.7% DivorcedWomen who gave birth in the past 12 months Now married:
0.0% (0)Unmarried:
100.0% (22)
Women who did not give birth in the past 12 months Now married:
54.6% (212)Unmarried:
45.4% (176)
Marital status - Two or more races population 15 years and over
Males 32.5% Never married48.3% Now married0.0% Separated3.1% Widowed16.1% DivorcedFemales 32.7% Never married35.3% Now married0.0% Separated5.4% Widowed26.7% DivorcedWomen who gave birth in the past 12 months Now married:
56.5% (73)Unmarried:
43.5% (56)
Women who did not give birth in the past 12 months Now married:
33.8% (219)Unmarried:
66.2% (427)
Marital status - White alone, not Hispanic / Latino population 15 years and over
Males 27.3% Never married56.0% Now married1.6% Separated1.4% Widowed13.6% DivorcedFemales 20.4% Never married55.7% Now married1.0% Separated5.8% Widowed17.1% DivorcedWomen who gave birth in the past 12 months Now married:
83.4% (383)Unmarried:
16.6% (76)
Women who did not give birth in the past 12 months Now married:
47.1% (1,476)Unmarried:
52.9% (1,656)
Marital status - Hispanic or Latino population 15 years and over
Males 32.6% Never married48.0% Now married0.0% Separated4.2% Widowed15.2% DivorcedFemales 35.7% Never married47.6% Now married6.0% Separated1.4% Widowed9.2% DivorcedWomen who gave birth in the past 12 months Now married:
79.1% (76)Unmarried:
20.9% (20)
Women who did not give birth in the past 12 months Now married:
48.3% (481)Unmarried:
51.7% (515)
Ancestries in Fernley
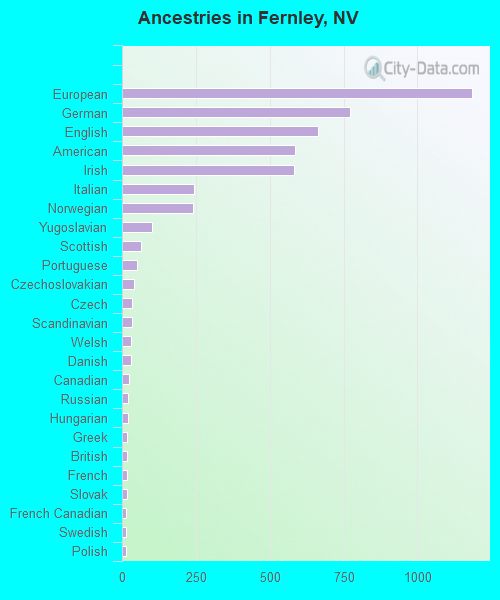
1,183 12.5% European773 8.1% German663 7.0% English587 6.2% American582 6.1% Irish243 2.6% Italian240 2.5% Norwegian103 1.1% Yugoslavian63 0.7% Scottish50 0.5% Portuguese41 0.4% Czechoslovakian34 0.4% Czech33 0.3% Scandinavian30 0.3% Welsh29 0.3% Danish25 0.3% Canadian21 0.2% Russian20 0.2% Hungarian18 0.2% Greek17 0.2% British17 0.2% French16 0.2% Slovak15 0.2% French Canadian15 0.2% Swedish14 0.1% Polish12 0.1% Dutch7 0.07% Scotch-Irish6 0.06% Alsatian
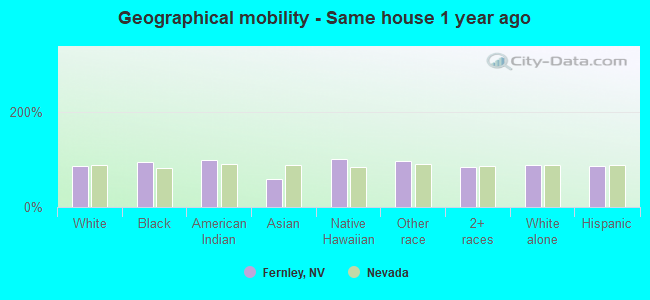
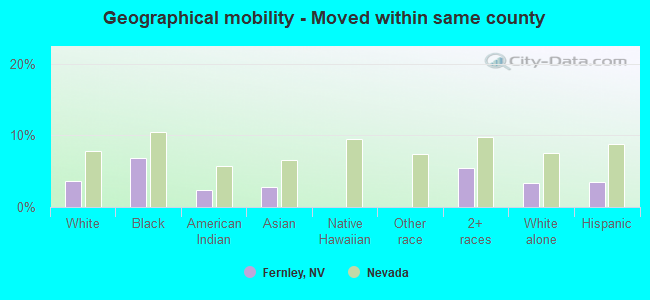
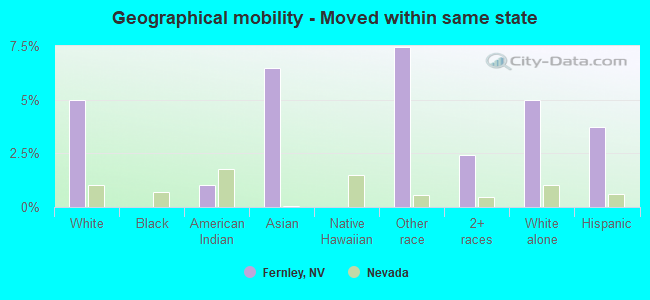
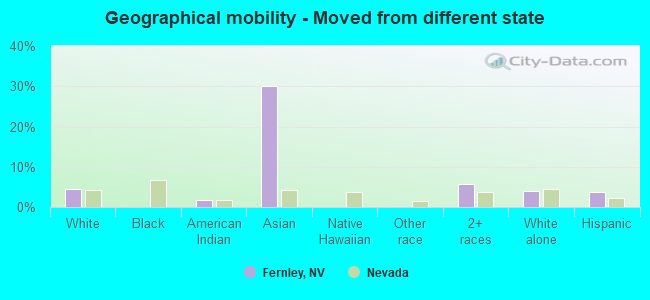
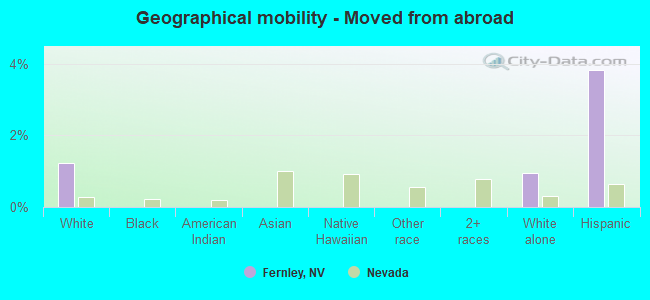
Geographical mobility in Fernley Same house 1 year ago 13,991 86.4% White (Caucasian)402 94.6% Black or African American456 98.5% American Indian / Alaska Native220 58.9% Asian42 100.0% Native Hawaiian / Pacific Islander1,139 96.6% Other race2,909 84.4% Two or more races13,734 87.6% White alone, not Hispanic / Latino3,563 85.6% Hispanic or LatinoMoved within same county 598 3.7% White / Caucasian29 6.9% Black or African American11 2.3% American Indian / Alaska Native11 2.8% Asian188 5.4% Two or more races517 3.3% White alone, not Hispanic / Latino144 3.5% Hispanic or LatinoMoved within same state 808 5.0% White / Caucasian5 1.0% American Indian / Alaska Native24 6.5% Asian88 7.4% Other race83 2.4% Two or more races783 5.0% White alone, not Hispanic / Latino156 3.7% Hispanic or LatinoMoved from different state 714 4.4% White / Caucasian8 1.6% American Indian / Alaska Native113 30.2% Asian194 5.6% Two or more races611 3.9% White alone, not Hispanic / Latino160 3.8% Hispanic or LatinoMoved from abroad 200 1.2% White150 1.0% White alone, not Hispanic / Latino159 3.8% Hispanic or Latino
Children Nativity (place of birth) in Fernley
Children under 6 years - Living with two parents Both parents native 923 100.0% NativeBoth parents foreign-born 30 67.0% Native15 33.0% Foreign-bornOne native, one foreign-born parent 134 100.0% NativeChildren under 6 years - Living with one parent Native parent 523 100.0% NativeChildren 6 to 17 years - Living with two parents Both parents native 2,299 99.9% Native1 0.1% Foreign-bornOne native, one foreign-born parent 150 95.0% Native8 5.0% Foreign-bornChildren 6 to 17 years - Living with one parent Native parent 940 100.0% NativeForeign-born parent 72 50.0% Native72 50.0% Foreign-born
Grandparents responsible for own grandchildren in Fernley
Grandparents (30 to 59 years) White / Caucasian 138 47.9% Responsible for grandchildren150 52.1% Not responsible for grandchildrenWhite alone, not Hispanic / Latino 164 73.5% Responsible for grandchildren59 26.5% Not responsible for grandchildrenHispanic or Latino 23 12.1% Responsible for grandchildren169 87.9% Not responsible for grandchildrenGrandparents (60 years and over) White / Caucasian 39 15.8% Responsible for grandchildren206 84.2% Not responsible for grandchildrenWhite alone, not Hispanic / Latino 44 20.9% Responsible for grandchildren167 79.1% Not responsible for grandchildrenHispanic or Latino 82 100.0% Not responsible for grandchildren