Races in Fearrington, North Carolina (NC) Detailed Stats
Ancestries, Foreign-born residents, place of birth

Recent posts about races in Fearrington, North Carolina on our local forum with over 2,400,000 registered users:
 | Relocating from Ithaca (188 replies) |
| Restaurant recommendations (Wife's 50th birthday) (18 replies) |
| Couple questions before a visit next week (71 replies) |
| Wealthiest or most prosperous rural areas of NC? (47 replies) |
| Where are the East Coast transplants (60 replies) |
| Retire to Raleigh Durham chapel hill (15 replies) |
3.3% of Fearrington, NC residents are foreign-born (1.8% born in North America, 1.6% born in Europe), which is 140.8% less than the foreign-born rate of 8.0% across the entire state of North Carolina.
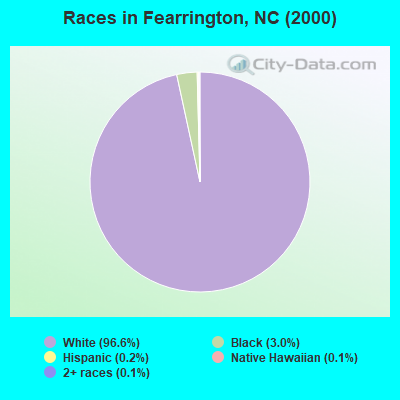
Race distribution in Fearrington

- 87296.6%White alone
- 273.0%Black alone
- 20.2%Hispanic
- 10.1%Two or more races
- 10.1%Native Hawaiian and Other
Pacific Islander alone
2000
2022
-
- 5,647,15570.2%White alone
- 1,723,30121.4%Black alone
- 378,9634.7%Hispanic
- 112,4161.4%Asian alone
- 95,3331.2%American Indian alone
- 79,9651.0%Two or more races
- 9,0150.1%Other race alone
- 3,1650.04%Native Hawaiian and Other
Pacific Islander alone

-
- 6,497,51960.7%White alone
- 2,155,65020.1%Black alone
- 1,114,79910.4%Hispanic
- 438,0614.1%Two or more races
- 341,0523.2%Asian alone
- 91,7580.9%American Indian alone
- 50,1800.5%Other race alone
- 9,9540.09%Native Hawaiian and Other
Pacific Islander alone

Income and house value in Fearrington
- Median household income in 2022
- $133,311White non-Hispanic householders
- $70,556Black householders
- Median 2022 house value
- $722,323White Non-Hispanic householders
- $656,498Black or African American householders
Household income for White non-Hispanic householders

Household income for Black householders

Foreign-born residents in Fearrington
30 residents are foreign born (1.8% North America, 1.6% Europe).
| This city: | 3.3% |
| North Carolina: | 5.3% |
Ancestries in Fearrington

- 22720.2%English
- 17215.3%German
- 13211.7%Other
- 1089.6%Irish
- 897.9%Scotch-Irish
- 786.9%Polish
- 393.5%Norwegian
- 373.3%Swedish
- 343.0%French
- 343.0%Italian
- 322.8%Russian
- 282.5%Scottish
- 211.9%Dutch
- 171.5%Hungarian
- 161.4%Danish
- 161.4%Lithuanian
- 161.4%United States
- 80.7%Swiss
- 80.7%Ukrainian
- 80.7%Welsh
- 60.5%French Canadian

Zip codes: 27312.