Races in Fayetteville, Tennessee (TN) Detailed Stats
Data:
Races - White alone (%)
Races - White alone (% change since 2000)
Races - Black alone (%)
Races - Black alone (% change since 2000)
Races - American Indian alone (%)
Races - American Indian alone (% change since 2000)
Races - Asian alone (%)
Races - Asian alone (% change since 2000)
Races - Hispanic (%)
Races - Hispanic (% change since 2000)
Races - Native Hawaiian and Other Pacific Islander alone (%)
Races - Native Hawaiian and Other Pacific Islander alone (% change since 2000)
Races - Two or more races(%)
Races - Two or more races(% change since 2000)
Races - Other race alone (%)
Races - Other race alone (% change since 2000)
Racial diversity
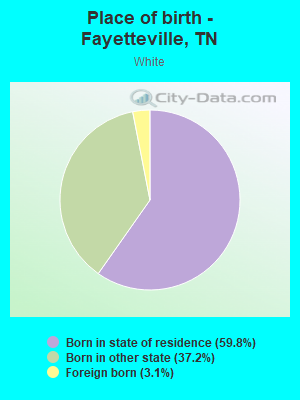
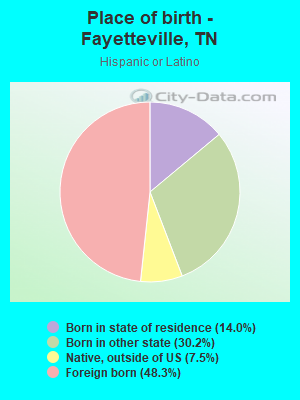
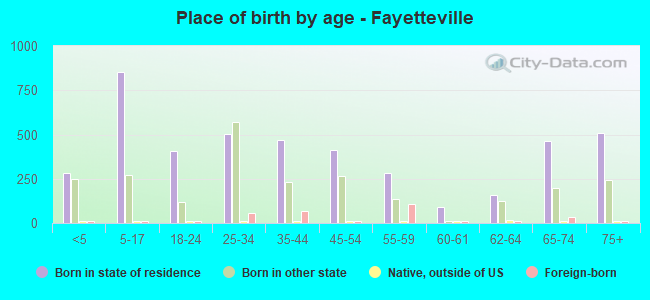
Place of birth - Born in state of residence (%)
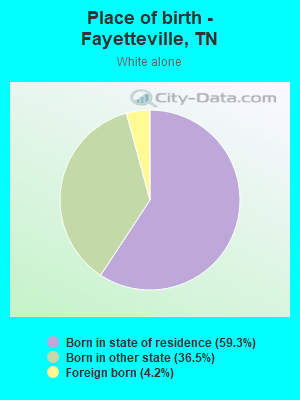
Place of birth - Born in state of residence (%) - White
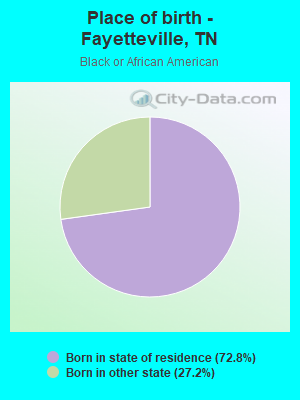
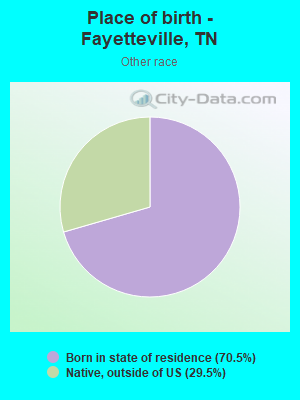
Place of birth - Born in state of residence (%) - Black or African American
Place of birth - Born in state of residence (%) - Asian
Place of birth - Born in state of residence (%) - Hispanic or Latino
Place of birth - Born in state of residence (%) - American Indian and Alaska Native
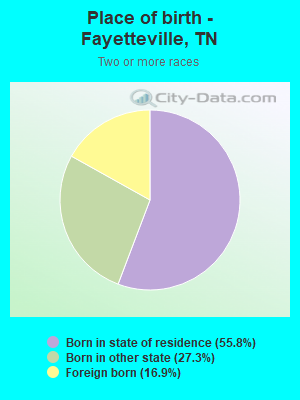
Place of birth - Born in state of residence (%) - Multirace
Place of birth - Born in state of residence (%) - Other Race
Place of birth - Born in other state (%)
Place of birth - Born in other state (%) - White
Place of birth - Born in other state (%) - Black or African American
Place of birth - Born in other state (%) - Asian
Place of birth - Born in other state (%) - Hispanic or Latino
Place of birth - Born in other state (%) - American Indian and Alaska Native
Place of birth - Born in other state (%) - Multirace
Place of birth - Born in other state (%) - Other Race
Place of birth - Native, outside of US (%)
Place of birth - Native, outside of US (%) - White
Place of birth - Native, outside of US (%) - Black or African American
Place of birth - Native, outside of US (%) - Asian
Place of birth - Native, outside of US (%) - Hispanic or Latino
Place of birth - Native, outside of US (%) - American Indian and Alaska Native
Place of birth - Native, outside of US (%) - Multirace
Place of birth - Native, outside of US (%) - Other Race
Place of birth - Foreign born (%)
Place of birth - Foreign born (%) - White
Place of birth - Foreign born (%) - Black or African American
Place of birth - Foreign born (%) - Asian
Place of birth - Foreign born (%) - Hispanic or Latino
Place of birth - Foreign born (%) - American Indian and Alaska Native
Place of birth - Foreign born (%) - Multirace
Place of birth - Foreign born (%) - Other Race
Residents speaking English at home (%)
Residents speaking English at home - Born in the United States (%)
Residents speaking English at home - Native, born elsewhere (%)
Residents speaking English at home - Foreign born (%)
Residents speaking Spanish at home (%)
Residents speaking Spanish at home - Born in the United States (%)
Residents speaking Spanish at home - Native, born elsewhere (%)
Residents speaking Spanish at home - Foreign born (%)
Residents speaking other language at home (%)
Residents speaking other language at home - Born in the United States (%)
Residents speaking other language at home - Native, born elsewhere (%)
Residents speaking other language at home - Foreign born (%)
Marital status - Never married (%)
Marital status - Now married (%)
Marital status - Separated (%)
Marital status - Widowed (%)
Marital status - Divorced (%)
Ancestries Reported - Arab (%)
Ancestries Reported - Czech (%)
Ancestries Reported - Danish (%)
Ancestries Reported - Dutch (%)
Ancestries Reported - English (%)
Ancestries Reported - French (%)
Ancestries Reported - French Canadian (%)
Ancestries Reported - German (%)
Ancestries Reported - Greek (%)
Ancestries Reported - Hungarian (%)
Ancestries Reported - Irish (%)
Ancestries Reported - Italian (%)
Ancestries Reported - Lithuanian (%)
Ancestries Reported - Norwegian (%)
Ancestries Reported - Polish (%)
Ancestries Reported - Portuguese (%)
Ancestries Reported - Russian (%)
Ancestries Reported - Scotch-Irish (%)
Ancestries Reported - Scottish (%)
Ancestries Reported - Slovak (%)
Ancestries Reported - Subsaharan African (%)
Ancestries Reported - Swedish (%)
Ancestries Reported - Swiss (%)
Ancestries Reported - Ukrainian (%)
Ancestries Reported - United States (%)
Ancestries Reported - Welsh (%)
Ancestries Reported - West Indian (%)
Ancestries Reported - Other (%)
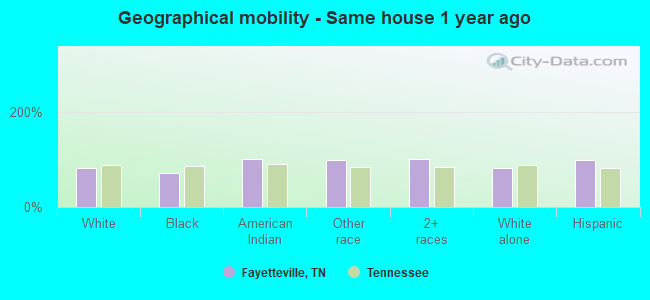
Geographical mobility - Same house 1 year ago (%)
Geographical mobility - Same house 1 year ago (%) - White
Geographical mobility - Same house 1 year ago (%) - Black or African American
Geographical mobility - Same house 1 year ago (%) - Asian
Geographical mobility - Same house 1 year ago (%) - Hispanic or Latino
Geographical mobility - Same house 1 year ago (%) - American Indian and Alaska Native
Geographical mobility - Same house 1 year ago (%) - Multirace
Geographical mobility - Same house 1 year ago (%) - Other Race
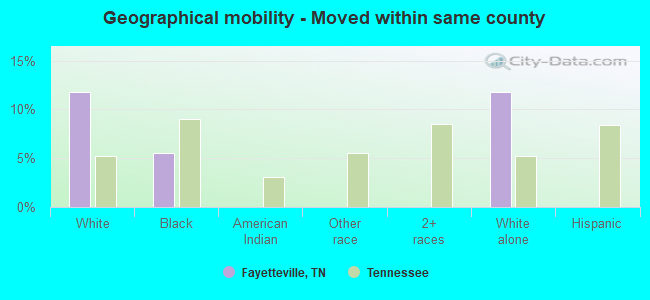
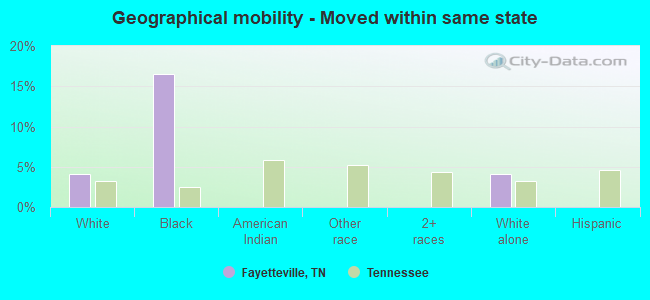
Geographical mobility - Moved within same county (%)
Geographical mobility - Moved within same county (%) - White
Geographical mobility - Moved within same county (%) - Black or African American
Geographical mobility - Moved within same county (%) - Asian
Geographical mobility - Moved within same county (%) - Hispanic or Latino
Geographical mobility - Moved within same county (%) - American Indian and Alaska Native
Geographical mobility - Moved within same county (%) - Multirace
Geographical mobility - Moved within same county (%) - Other Race
Geographical mobility - Moved from different county within same state (%)
Geographical mobility - Moved from different county within same state (%) - White
Geographical mobility - Moved from different county within same state (%) - Black or African American
Geographical mobility - Moved from different county within same state (%) - Asian
Geographical mobility - Moved from different county within same state (%) - Hispanic or Latino
Geographical mobility - Moved from different county within same state (%) - American Indian and Alaska Native
Geographical mobility - Moved from different county within same state (%) - Multirace
Geographical mobility - Moved from different county within same state (%) - Other Race
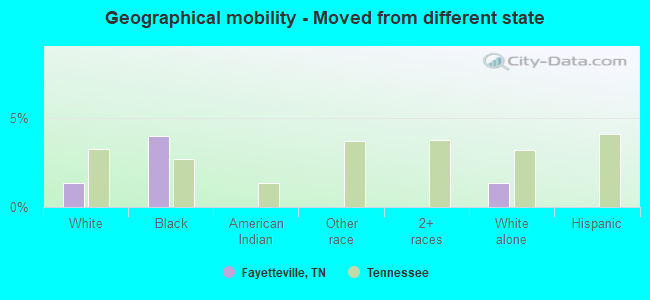
Geographical mobility - Moved from different state (%)
Geographical mobility - Moved from different state (%) - White
Geographical mobility - Moved from different state (%) - Black or African American
Geographical mobility - Moved from different state (%) - Asian
Geographical mobility - Moved from different state (%) - Hispanic or Latino
Geographical mobility - Moved from different state (%) - American Indian and Alaska Native
Geographical mobility - Moved from different state (%) - Multirace
Geographical mobility - Moved from different state (%) - Other Race
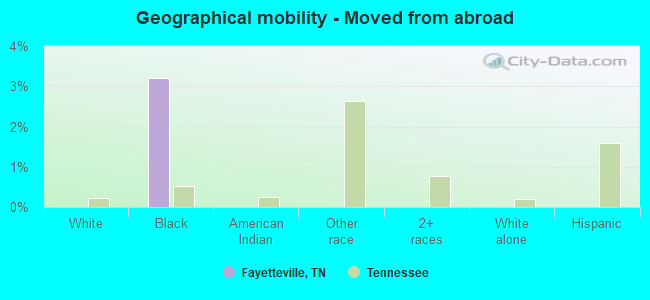
Geographical mobility - Moved from abroad (%)
Geographical mobility - Moved from abroad (%) - White
Geographical mobility - Moved from abroad (%) - Black or African American
Geographical mobility - Moved from abroad (%) - Asian
Geographical mobility - Moved from abroad (%) - Hispanic or Latino
Geographical mobility - Moved from abroad (%) - American Indian and Alaska Native
Geographical mobility - Moved from abroad (%) - Multirace
Geographical mobility - Moved from abroad (%) - Other Race
Place of birth for the foreign-born population - Ireland (%)
Place of birth for the foreign-born population - Denmark (%)
Place of birth for the foreign-born population - Norway (%)
Place of birth for the foreign-born population - Sweden (%)
Place of birth for the foreign-born population - United Kingdom (%)
Place of birth for the foreign-born population - England (%)
Place of birth for the foreign-born population - Scotland (%)
Place of birth for the foreign-born population - Other Northern Europe (%)
Place of birth for the foreign-born population - Austria (%)
Place of birth for the foreign-born population - Belgium (%)
Place of birth for the foreign-born population - France (%)
Place of birth for the foreign-born population - Germany (%)
Place of birth for the foreign-born population - Netherlands (%)
Place of birth for the foreign-born population - Switzerland (%)
Place of birth for the foreign-born population - Other Western Europe (%)
Place of birth for the foreign-born population - Greece (%)
Place of birth for the foreign-born population - Italy (%)
Place of birth for the foreign-born population - Portugal (%)
Place of birth for the foreign-born population - Spain (%)
Place of birth for the foreign-born population - Other Southern Europe (%)
Place of birth for the foreign-born population - Albania (%)
Place of birth for the foreign-born population - Belarus (%)
Place of birth for the foreign-born population - Bosnia and Herzegovina (%)
Place of birth for the foreign-born population - Bulgaria (%)
Place of birth for the foreign-born population - Croatia (%)
Place of birth for the foreign-born population - Czechoslovakia (%)
Place of birth for the foreign-born population - Hungary (%)
Place of birth for the foreign-born population - Latvia (%)
Place of birth for the foreign-born population - Lithuania (%)
Place of birth for the foreign-born population - North Macedonia (Macedonia) (%)
Place of birth for the foreign-born population - Moldova (%)
Place of birth for the foreign-born population - Poland (%)
Place of birth for the foreign-born population - Romania (%)
Place of birth for the foreign-born population - Russia (%)
Place of birth for the foreign-born population - Serbia (%)
Place of birth for the foreign-born population - Ukraine (%)
Place of birth for the foreign-born population - Other Eastern Europe (%)
Place of birth for the foreign-born population - China (%)
Place of birth for the foreign-born population - Hong Kong (%)
Place of birth for the foreign-born population - Taiwan (%)
Place of birth for the foreign-born population - Japan (%)
Place of birth for the foreign-born population - Korea (%)
Place of birth for the foreign-born population - Other Eastern Asia (%)
Place of birth for the foreign-born population - Afghanistan (%)
Place of birth for the foreign-born population - Bangladesh (%)
Place of birth for the foreign-born population - India (%)
Place of birth for the foreign-born population - Iran (%)
Place of birth for the foreign-born population - Kazakhstan (%)
Place of birth for the foreign-born population - Nepal (%)
Place of birth for the foreign-born population - Pakistan (%)
Place of birth for the foreign-born population - Sri Lanka (%)
Place of birth for the foreign-born population - Uzbekistan (%)
Place of birth for the foreign-born population - Other South Central Asia (%)
Place of birth for the foreign-born population - Burma (%)
Place of birth for the foreign-born population - Cambodia (%)
Place of birth for the foreign-born population - Indonesia (%)
Place of birth for the foreign-born population - Laos (%)
Place of birth for the foreign-born population - Malaysia (%)
Place of birth for the foreign-born population - Philippines (%)
Place of birth for the foreign-born population - Singapore (%)
Place of birth for the foreign-born population - Thailand (%)
Place of birth for the foreign-born population - Vietnam (%)
Place of birth for the foreign-born population - Other South Eastern Asia (%)
Place of birth for the foreign-born population - Armenia (%)
Place of birth for the foreign-born population - Iraq (%)
Place of birth for the foreign-born population - Israel (%)
Place of birth for the foreign-born population - Jordan (%)
Place of birth for the foreign-born population - Kuwait (%)
Place of birth for the foreign-born population - Lebanon (%)
Place of birth for the foreign-born population - Saudi Arabia (%)
Place of birth for the foreign-born population - Syria (%)
Place of birth for the foreign-born population - Turkey (%)
Place of birth for the foreign-born population - Yemen (%)
Place of birth for the foreign-born population - Other Western Asia (%)
Place of birth for the foreign-born population - Eritrea (%)
Place of birth for the foreign-born population - Ethiopia (%)
Place of birth for the foreign-born population - Kenya (%)
Place of birth for the foreign-born population - Somalia (%)
Place of birth for the foreign-born population - Uganda (%)
Place of birth for the foreign-born population - Zimbabwe (%)
Place of birth for the foreign-born population - Other Eastern Africa (%)
Place of birth for the foreign-born population - Cameroon (%)
Place of birth for the foreign-born population - Congo (%)
Place of birth for the foreign-born population - Democratic Republic of Congo (Zaire) (%)
Place of birth for the foreign-born population - Other Middle Africa (%)
Place of birth for the foreign-born population - Egypt (%)
Place of birth for the foreign-born population - Morocco (%)
Place of birth for the foreign-born population - Sudan (%)
Place of birth for the foreign-born population - Other Northern Africa (%)
Place of birth for the foreign-born population - South Africa (%)
Place of birth for the foreign-born population - Other Southern Africa (%)
Place of birth for the foreign-born population - Cabo Verde (%)
Place of birth for the foreign-born population - Ghana (%)
Place of birth for the foreign-born population - Liberia (%)
Place of birth for the foreign-born population - Nigeria (%)
Place of birth for the foreign-born population - Senegal (%)
Place of birth for the foreign-born population - Sierra Leone (%)
Place of birth for the foreign-born population - Other Western Africa (%)
Place of birth for the foreign-born population - Australia (%)
Place of birth for the foreign-born population - New Zealand (%)
Place of birth for the foreign-born population - Fiji (%)
Place of birth for the foreign-born population - Micronesia (%)
Place of birth for the foreign-born population - Bahamas (%)
Place of birth for the foreign-born population - Barbados (%)
Place of birth for the foreign-born population - Cuba (%)
Place of birth for the foreign-born population - Dominica (%)
Place of birth for the foreign-born population - Dominican Republic (%)
Place of birth for the foreign-born population - Grenada (%)
Place of birth for the foreign-born population - Haiti (%)
Place of birth for the foreign-born population - Jamaica (%)
Place of birth for the foreign-born population - St. Vincent and the Grenadines (%)
Place of birth for the foreign-born population - Trinidad and Tobago (%)
Place of birth for the foreign-born population - West Indies (%)
Place of birth for the foreign-born population - Other Caribbean (%)
Place of birth for the foreign-born population - Belize (%)
Place of birth for the foreign-born population - Costa Rica (%)
Place of birth for the foreign-born population - El Salvador (%)
Place of birth for the foreign-born population - Guatemala (%)
Place of birth for the foreign-born population - Honduras (%)
Place of birth for the foreign-born population - Mexico (%)
Place of birth for the foreign-born population - Nicaragua (%)
Place of birth for the foreign-born population - Panama (%)
Place of birth for the foreign-born population - Other Central America (%)
Place of birth for the foreign-born population - Argentina (%)
Place of birth for the foreign-born population - Bolivia (%)
Place of birth for the foreign-born population - Brazil (%)
Place of birth for the foreign-born population - Chile (%)
Place of birth for the foreign-born population - Colombia (%)
Place of birth for the foreign-born population - Ecuador (%)
Place of birth for the foreign-born population - Guyana (%)
Place of birth for the foreign-born population - Peru (%)
Place of birth for the foreign-born population - Uruguay (%)
Place of birth for the foreign-born population - Venezuela (%)
Place of birth for the foreign-born population - Other South America (%)
Place of birth for the foreign-born population - Canada (%)
Place of birth for the foreign-born population - Other Northern America (%)
Place of birth for the foreign-born population - Other (%)
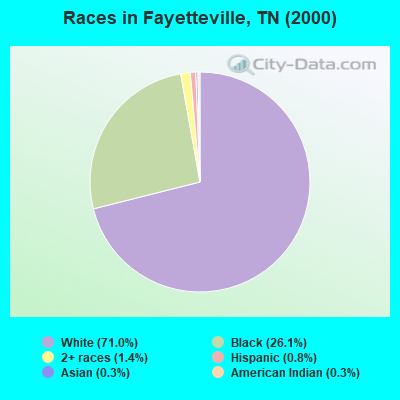
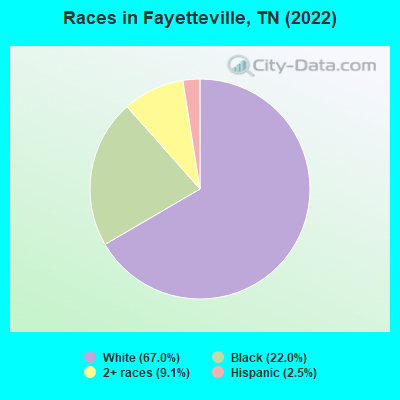
According to 2022 data, the most numerous races in Fayetteville, TN are White alone (4,795 residents), Black alone (1,573 residents), and Hispanic (176 residents). 98.9% of Fayetteville residents speak English at home. 4.1% of Fayetteville, TN residents are foreign-born (2.0% born in Europe, 1.1% born in Latin America, 0.9% born in Oceania), which is 22.9% less than the foreign-born rate of 5.0% across the entire state of Tennessee.
Race distribution in Fayetteville
2000 2022
4,505,930 79.2% White alone 928,204 16.3% Black alone 123,838 2.2% Hispanic 54,824 1.0% Two or more races 56,077 1.0% Asian alone 13,820 0.2% American Indian alone 4,780 0.08% Other race alone 1,810 0.03% Native Hawaiian and Other
5,070,026 71.9% White alone 1,089,738 15.5% Black alone 442,629 6.3% Hispanic 279,381 4.0% Two or more races 131,817 1.9% Asian alone 26,972 0.4% Other race alone 6,387 0.09% American Indian alone 4,389 0.06% Native Hawaiian and Other
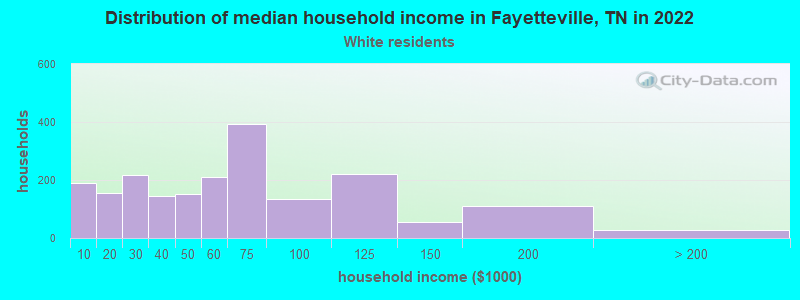
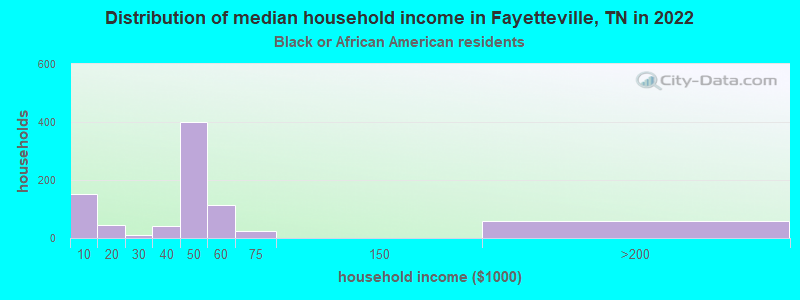
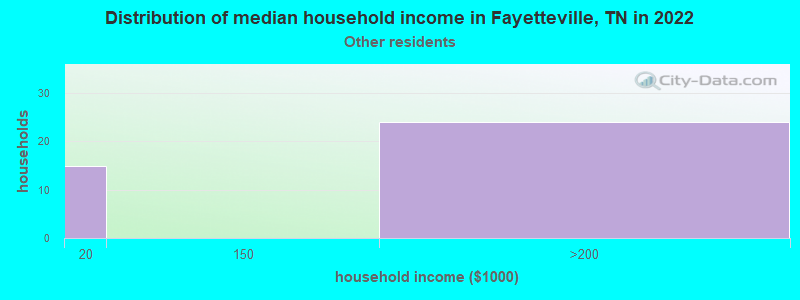
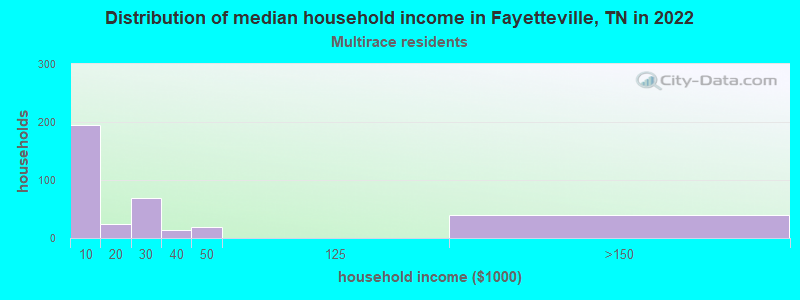
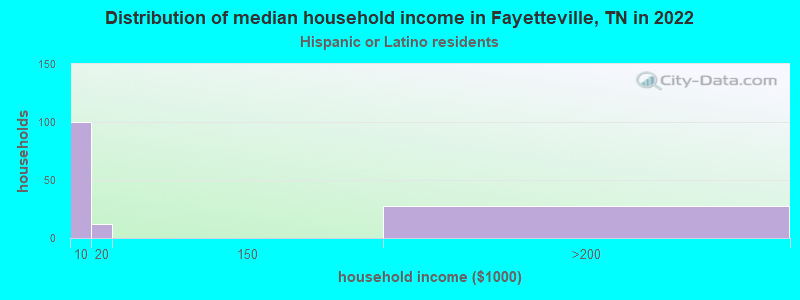
Income and house value in Fayetteville Median household income in 2022 $57,814 White non-Hispanic householders$44,174 Black householders$2,596 Hispanic or Latino race householdersMedian 2022 house value $231,747 White Non-Hispanic householders$150,468 Black or African American householders$251,899 Two or more races householders
Median age by race in Fayetteville
39.9 Median age for White residents41.1 38.1 35.5 Median age for Black or African American residents50.8 32.5 -681,948,423.4 Median age for American Indian / Alaska Native residents-633,911,367.4 -801,477,376.9 -685,288,639.9 Median age for Asian residents-662,846,226.7 -686,648,500.7 -885,813,147.9 Median age for Native Hawaiian / Pacific Islander residents-951,707,890.7 -735,930,735.2 -690,288,713.2 Median age for Other race residents-651,685,392.6 -745,428,972.5 32.0 Median age for Two or more races residents13.5 55.5 39.4 Median age for White alone residents40.4 37.9 55.3 Median age for Hispanic or Latino residents43.4 -677,824,267.1
Owner/renter occupied households by race in Fayetteville
House owners and renters - White residents 1,244 62.3% Owner occupied754 37.7% Renter occupiedHouse owners and renters - Black or African American residents 173 21.2% Owner occupied643 78.8% Renter occupiedHouse owners and renters - Other race residents 32 70.8% Owner occupied13 29.2% Renter occupiedHouse owners and renters - Two or more races residents 202 55.6% Owner occupied162 44.4% Renter occupiedHouse owners and renters - White alone residents 1,250 61.8% Owner occupied772 38.2% Renter occupiedHouse owners and renters - Hispanic or Latino residents 117 89.9% Owner occupied13 10.1% Renter occupied
Language usage in Fayetteville
English speakers - Total 98.9% of residents of Fayetteville speak English at home.
0.7% of residents speak Spanish at home 33 71.7% Speak English very well13 28.3% Speak English less than very well0.1% of residents speak other language at home 5 100.0% Speak English very well
English speakers - Born in the United States 99.7% of residents of Fayetteville speak English at home.
0.3% of residents speak other language at home 6 100.0% Speak English very well
English speakers - Native, born elsewhere 0.0% of residents of Fayetteville speak English at home.
107.7% of residents speak Spanish at home 14 100.0% Speak English less than very well
English speakers - Foreign-born 96.6% of residents of Fayetteville speak English at home.
White (Caucasian) - Speak only English Native:
100.0% (4,258)Foreign-born:
100.0% (146)
Two or more races - Speak only English Native:
98.3% (529)Foreign-born:
100.0% (147)
White alone - Speak only English Native:
99.5% (4,249)Foreign-born:
96.7% (195)
Hispanic or Latino - Speak only English Native:
61.5% (57)Foreign-born:
91.2% (78)
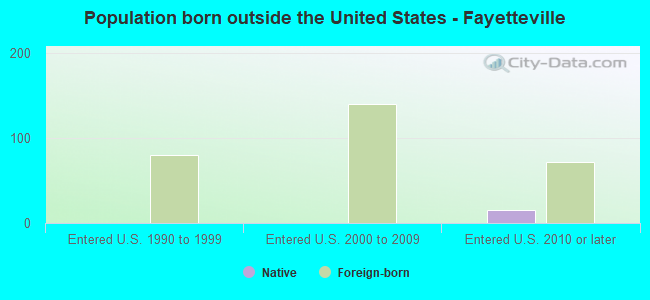
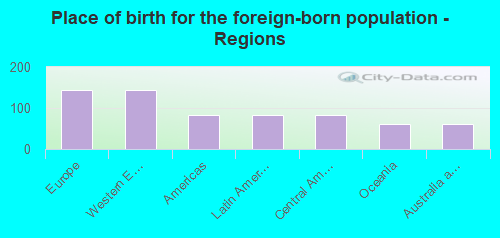
Foreign-born residents in Fayetteville 291 residents are foreign born (2.0% Europe , 1.1% Latin America , 0.9% Oceania ).
This city:
4.1%Tennessee:
5.4%
Marital status for residents in Fayetteville Marital status - White (Caucasian) population 15 years and over
Males 29.6% Never married44.3% Now married2.5% Separated5.7% Widowed17.8% DivorcedFemales 19.3% Never married36.3% Now married1.1% Separated19.2% Widowed24.2% DivorcedWomen who gave birth in the past 12 months Now married:
18.0% (29)Unmarried:
82.0% (131)
Women who did not give birth in the past 12 months Now married:
48.5% (469)Unmarried:
51.5% (499)
Marital status - Black or African American population 15 years and over
Males 59.6% Never married13.0% Now married6.4% Separated1.3% Widowed19.6% DivorcedFemales 45.9% Never married7.6% Now married1.8% Separated14.9% Widowed29.8% DivorcedWomen who gave birth in the past 12 months Now married:
0.0% (0)Unmarried:
100.0% (54)
Women who did not give birth in the past 12 months Now married:
9.0% (25)Unmarried:
91.0% (256)
Marital status - Two or more races population 15 years and over
Males 60.9% Never married0.0% Now married0.0% Separated0.0% Widowed39.1% DivorcedFemales 60.6% Never married10.8% Now married0.0% Separated0.0% Widowed28.7% DivorcedWomen who did not give birth in the past 12 months Now married:
16.7% (24)Unmarried:
83.3% (119)
Marital status - White alone, not Hispanic / Latino population 15 years and over
Males 29.9% Never married43.7% Now married2.6% Separated5.8% Widowed18.0% DivorcedFemales 19.3% Never married36.3% Now married1.1% Separated19.2% Widowed24.2% DivorcedWomen who gave birth in the past 12 months Now married:
18.0% (29)Unmarried:
82.0% (133)
Women who did not give birth in the past 12 months Now married:
48.5% (477)Unmarried:
51.5% (507)
Marital status - Hispanic or Latino population 15 years and over
Males 0.0% Never married76.9% Now married23.1% Separated0.0% Widowed0.0% DivorcedFemales 100.0% Never married0.0% Now married0.0% Separated0.0% Widowed0.0% Divorced
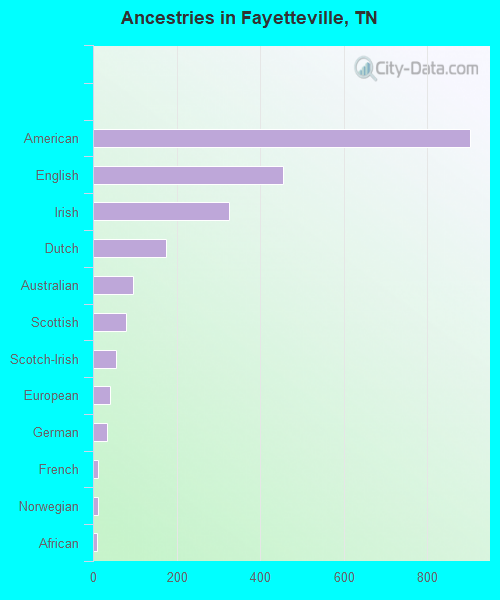
Ancestries in Fayetteville
903 23.7% American454 11.9% English326 8.5% Irish175 4.6% Dutch95 2.5% Australian79 2.1% Scottish56 1.5% Scotch-Irish40 1.0% European33 0.9% German11 0.3% French11 0.3% Norwegian9 0.2% African4 0.1% British
Children Nativity (place of birth) in Fayetteville
Children under 6 years - Living with two parents Both parents native 90 100.0% NativeChildren under 6 years - Living with one parent Native parent 305 100.0% NativeForeign-born parent 113 100.0% NativeChildren 6 to 17 years - Living with two parents Both parents native 238 100.0% NativeChildren 6 to 17 years - Living with one parent Native parent 666 100.0% NativeForeign-born parent 84 51.1% Native80 48.9% Foreign-born
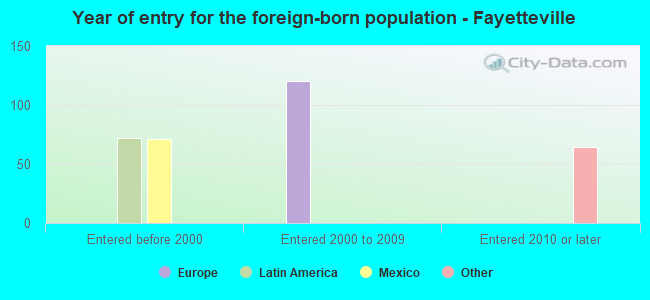
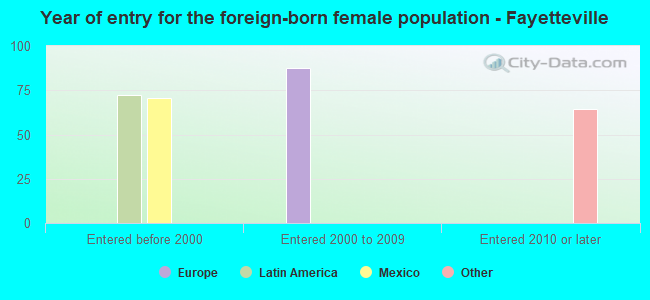
Place of birth for residents in Fayetteville 145 Europe145 Western Europe83 Americas83 Latin America83 Central America62 Oceania62 Australia and New Zealand Subregion
Grandparents responsible for own grandchildren in Fayetteville
Grandparents (30 to 59 years) White / Caucasian 37 100.0% Not responsible for grandchildrenBlack or African American 15 53.3% Responsible for grandchildren13 46.7% Not responsible for grandchildrenTwo or more races 53 100.0% Not responsible for grandchildrenWhite alone, not Hispanic / Latino 38 100.0% Not responsible for grandchildren
Grandparents (60 years and over) White / Caucasian 58 100.0% Not responsible for grandchildrenWhite alone, not Hispanic / Latino 59 100.0% Not responsible for grandchildren