Races in Fayetteville, North Carolina (NC) Detailed Stats
Data:
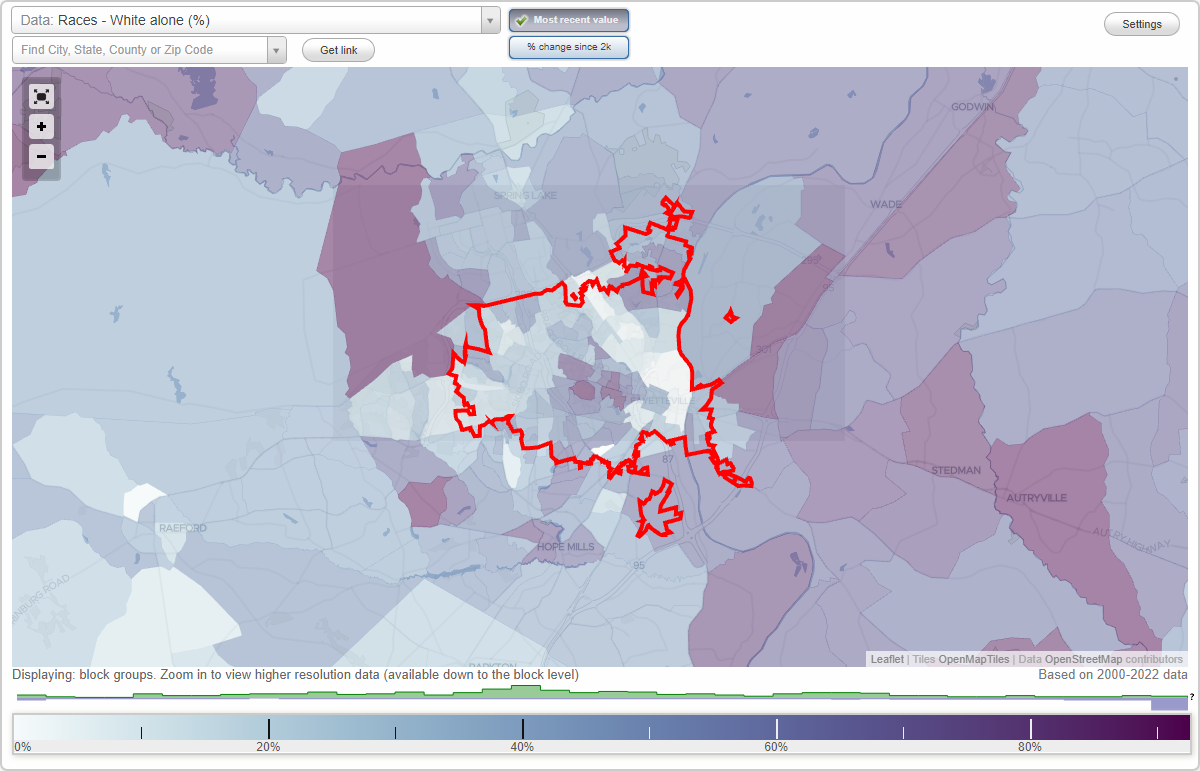
Races - White alone (%)
Races - White alone (% change since 2000)
Races - Black alone (%)
Races - Black alone (% change since 2000)
Races - American Indian alone (%)
Races - American Indian alone (% change since 2000)
Races - Asian alone (%)
Races - Asian alone (% change since 2000)
Races - Hispanic (%)
Races - Hispanic (% change since 2000)
Races - Native Hawaiian and Other Pacific Islander alone (%)
Races - Native Hawaiian and Other Pacific Islander alone (% change since 2000)
Races - Two or more races(%)
Races - Two or more races(% change since 2000)
Races - Other race alone (%)
Races - Other race alone (% change since 2000)
Racial diversity
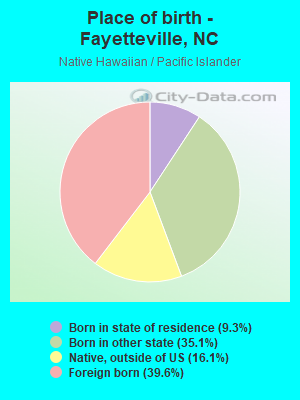
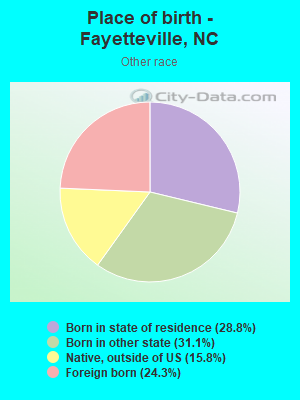
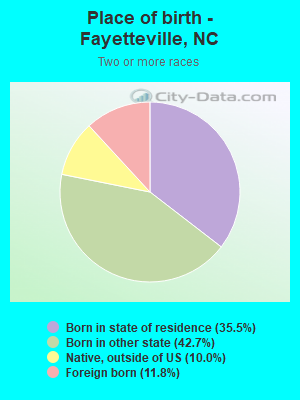
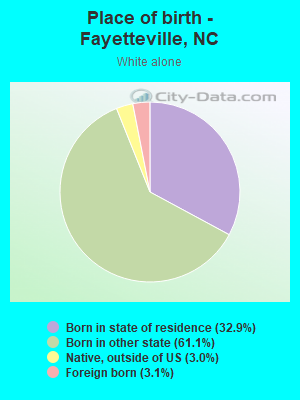
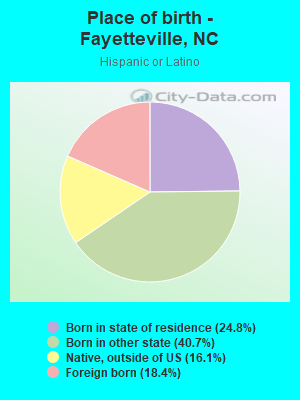
Place of birth - Born in state of residence (%)
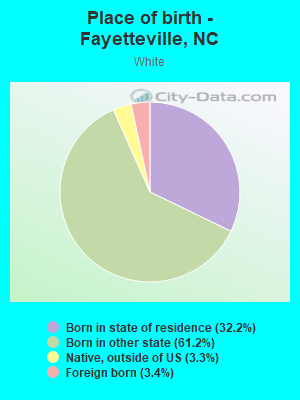
Place of birth - Born in state of residence (%) - White
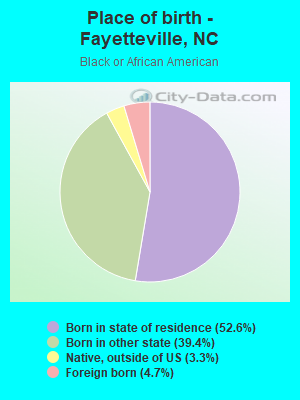
Place of birth - Born in state of residence (%) - Black or African American
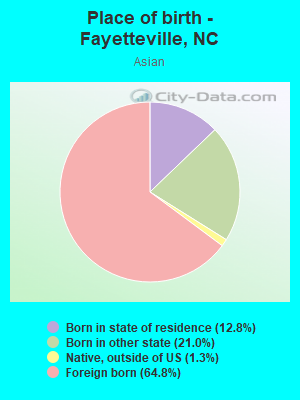
Place of birth - Born in state of residence (%) - Asian
Place of birth - Born in state of residence (%) - Hispanic or Latino
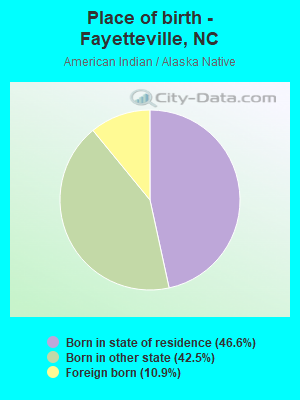
Place of birth - Born in state of residence (%) - American Indian and Alaska Native
Place of birth - Born in state of residence (%) - Multirace
Place of birth - Born in state of residence (%) - Other Race
Place of birth - Born in other state (%)
Place of birth - Born in other state (%) - White
Place of birth - Born in other state (%) - Black or African American
Place of birth - Born in other state (%) - Asian
Place of birth - Born in other state (%) - Hispanic or Latino
Place of birth - Born in other state (%) - American Indian and Alaska Native
Place of birth - Born in other state (%) - Multirace
Place of birth - Born in other state (%) - Other Race
Place of birth - Native, outside of US (%)
Place of birth - Native, outside of US (%) - White
Place of birth - Native, outside of US (%) - Black or African American
Place of birth - Native, outside of US (%) - Asian
Place of birth - Native, outside of US (%) - Hispanic or Latino
Place of birth - Native, outside of US (%) - American Indian and Alaska Native
Place of birth - Native, outside of US (%) - Multirace
Place of birth - Native, outside of US (%) - Other Race
Place of birth - Foreign born (%)
Place of birth - Foreign born (%) - White
Place of birth - Foreign born (%) - Black or African American
Place of birth - Foreign born (%) - Asian
Place of birth - Foreign born (%) - Hispanic or Latino
Place of birth - Foreign born (%) - American Indian and Alaska Native
Place of birth - Foreign born (%) - Multirace
Place of birth - Foreign born (%) - Other Race
Residents speaking English at home (%)
Residents speaking English at home - Born in the United States (%)
Residents speaking English at home - Native, born elsewhere (%)
Residents speaking English at home - Foreign born (%)
Residents speaking Spanish at home (%)
Residents speaking Spanish at home - Born in the United States (%)
Residents speaking Spanish at home - Native, born elsewhere (%)
Residents speaking Spanish at home - Foreign born (%)
Residents speaking other language at home (%)
Residents speaking other language at home - Born in the United States (%)
Residents speaking other language at home - Native, born elsewhere (%)
Residents speaking other language at home - Foreign born (%)
Marital status - Never married (%)
Marital status - Now married (%)
Marital status - Separated (%)
Marital status - Widowed (%)
Marital status - Divorced (%)
Ancestries Reported - Arab (%)
Ancestries Reported - Czech (%)
Ancestries Reported - Danish (%)
Ancestries Reported - Dutch (%)
Ancestries Reported - English (%)
Ancestries Reported - French (%)
Ancestries Reported - French Canadian (%)
Ancestries Reported - German (%)
Ancestries Reported - Greek (%)
Ancestries Reported - Hungarian (%)
Ancestries Reported - Irish (%)
Ancestries Reported - Italian (%)
Ancestries Reported - Lithuanian (%)
Ancestries Reported - Norwegian (%)
Ancestries Reported - Polish (%)
Ancestries Reported - Portuguese (%)
Ancestries Reported - Russian (%)
Ancestries Reported - Scotch-Irish (%)
Ancestries Reported - Scottish (%)
Ancestries Reported - Slovak (%)
Ancestries Reported - Subsaharan African (%)
Ancestries Reported - Swedish (%)
Ancestries Reported - Swiss (%)
Ancestries Reported - Ukrainian (%)
Ancestries Reported - United States (%)
Ancestries Reported - Welsh (%)
Ancestries Reported - West Indian (%)
Ancestries Reported - Other (%)
Geographical mobility - Same house 1 year ago (%)
Geographical mobility - Same house 1 year ago (%) - White
Geographical mobility - Same house 1 year ago (%) - Black or African American
Geographical mobility - Same house 1 year ago (%) - Asian
Geographical mobility - Same house 1 year ago (%) - Hispanic or Latino
Geographical mobility - Same house 1 year ago (%) - American Indian and Alaska Native
Geographical mobility - Same house 1 year ago (%) - Multirace
Geographical mobility - Same house 1 year ago (%) - Other Race
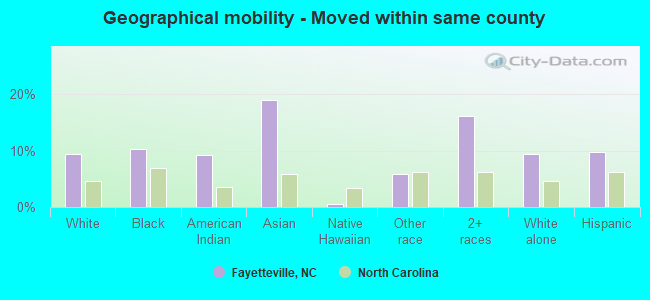
Geographical mobility - Moved within same county (%)
Geographical mobility - Moved within same county (%) - White
Geographical mobility - Moved within same county (%) - Black or African American
Geographical mobility - Moved within same county (%) - Asian
Geographical mobility - Moved within same county (%) - Hispanic or Latino
Geographical mobility - Moved within same county (%) - American Indian and Alaska Native
Geographical mobility - Moved within same county (%) - Multirace
Geographical mobility - Moved within same county (%) - Other Race
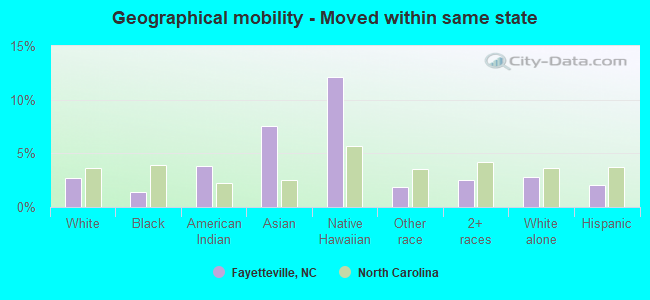
Geographical mobility - Moved from different county within same state (%)
Geographical mobility - Moved from different county within same state (%) - White
Geographical mobility - Moved from different county within same state (%) - Black or African American
Geographical mobility - Moved from different county within same state (%) - Asian
Geographical mobility - Moved from different county within same state (%) - Hispanic or Latino
Geographical mobility - Moved from different county within same state (%) - American Indian and Alaska Native
Geographical mobility - Moved from different county within same state (%) - Multirace
Geographical mobility - Moved from different county within same state (%) - Other Race
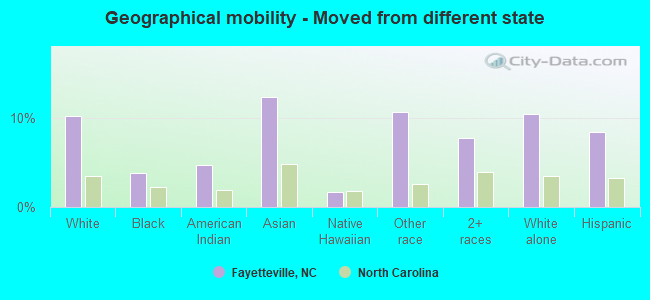
Geographical mobility - Moved from different state (%)
Geographical mobility - Moved from different state (%) - White
Geographical mobility - Moved from different state (%) - Black or African American
Geographical mobility - Moved from different state (%) - Asian
Geographical mobility - Moved from different state (%) - Hispanic or Latino
Geographical mobility - Moved from different state (%) - American Indian and Alaska Native
Geographical mobility - Moved from different state (%) - Multirace
Geographical mobility - Moved from different state (%) - Other Race
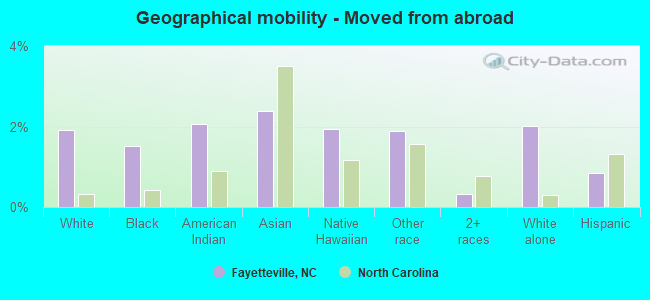
Geographical mobility - Moved from abroad (%)
Geographical mobility - Moved from abroad (%) - White
Geographical mobility - Moved from abroad (%) - Black or African American
Geographical mobility - Moved from abroad (%) - Asian
Geographical mobility - Moved from abroad (%) - Hispanic or Latino
Geographical mobility - Moved from abroad (%) - American Indian and Alaska Native
Geographical mobility - Moved from abroad (%) - Multirace
Geographical mobility - Moved from abroad (%) - Other Race
Place of birth for the foreign-born population - Ireland (%)
Place of birth for the foreign-born population - Denmark (%)
Place of birth for the foreign-born population - Norway (%)
Place of birth for the foreign-born population - Sweden (%)
Place of birth for the foreign-born population - United Kingdom (%)
Place of birth for the foreign-born population - England (%)
Place of birth for the foreign-born population - Scotland (%)
Place of birth for the foreign-born population - Other Northern Europe (%)
Place of birth for the foreign-born population - Austria (%)
Place of birth for the foreign-born population - Belgium (%)
Place of birth for the foreign-born population - France (%)
Place of birth for the foreign-born population - Germany (%)
Place of birth for the foreign-born population - Netherlands (%)
Place of birth for the foreign-born population - Switzerland (%)
Place of birth for the foreign-born population - Other Western Europe (%)
Place of birth for the foreign-born population - Greece (%)
Place of birth for the foreign-born population - Italy (%)
Place of birth for the foreign-born population - Portugal (%)
Place of birth for the foreign-born population - Spain (%)
Place of birth for the foreign-born population - Other Southern Europe (%)
Place of birth for the foreign-born population - Albania (%)
Place of birth for the foreign-born population - Belarus (%)
Place of birth for the foreign-born population - Bosnia and Herzegovina (%)
Place of birth for the foreign-born population - Bulgaria (%)
Place of birth for the foreign-born population - Croatia (%)
Place of birth for the foreign-born population - Czechoslovakia (%)
Place of birth for the foreign-born population - Hungary (%)
Place of birth for the foreign-born population - Latvia (%)
Place of birth for the foreign-born population - Lithuania (%)
Place of birth for the foreign-born population - North Macedonia (Macedonia) (%)
Place of birth for the foreign-born population - Moldova (%)
Place of birth for the foreign-born population - Poland (%)
Place of birth for the foreign-born population - Romania (%)
Place of birth for the foreign-born population - Russia (%)
Place of birth for the foreign-born population - Serbia (%)
Place of birth for the foreign-born population - Ukraine (%)
Place of birth for the foreign-born population - Other Eastern Europe (%)
Place of birth for the foreign-born population - China (%)
Place of birth for the foreign-born population - Hong Kong (%)
Place of birth for the foreign-born population - Taiwan (%)
Place of birth for the foreign-born population - Japan (%)
Place of birth for the foreign-born population - Korea (%)
Place of birth for the foreign-born population - Other Eastern Asia (%)
Place of birth for the foreign-born population - Afghanistan (%)
Place of birth for the foreign-born population - Bangladesh (%)
Place of birth for the foreign-born population - India (%)
Place of birth for the foreign-born population - Iran (%)
Place of birth for the foreign-born population - Kazakhstan (%)
Place of birth for the foreign-born population - Nepal (%)
Place of birth for the foreign-born population - Pakistan (%)
Place of birth for the foreign-born population - Sri Lanka (%)
Place of birth for the foreign-born population - Uzbekistan (%)
Place of birth for the foreign-born population - Other South Central Asia (%)
Place of birth for the foreign-born population - Burma (%)
Place of birth for the foreign-born population - Cambodia (%)
Place of birth for the foreign-born population - Indonesia (%)
Place of birth for the foreign-born population - Laos (%)
Place of birth for the foreign-born population - Malaysia (%)
Place of birth for the foreign-born population - Philippines (%)
Place of birth for the foreign-born population - Singapore (%)
Place of birth for the foreign-born population - Thailand (%)
Place of birth for the foreign-born population - Vietnam (%)
Place of birth for the foreign-born population - Other South Eastern Asia (%)
Place of birth for the foreign-born population - Armenia (%)
Place of birth for the foreign-born population - Iraq (%)
Place of birth for the foreign-born population - Israel (%)
Place of birth for the foreign-born population - Jordan (%)
Place of birth for the foreign-born population - Kuwait (%)
Place of birth for the foreign-born population - Lebanon (%)
Place of birth for the foreign-born population - Saudi Arabia (%)
Place of birth for the foreign-born population - Syria (%)
Place of birth for the foreign-born population - Turkey (%)
Place of birth for the foreign-born population - Yemen (%)
Place of birth for the foreign-born population - Other Western Asia (%)
Place of birth for the foreign-born population - Eritrea (%)
Place of birth for the foreign-born population - Ethiopia (%)
Place of birth for the foreign-born population - Kenya (%)
Place of birth for the foreign-born population - Somalia (%)
Place of birth for the foreign-born population - Uganda (%)
Place of birth for the foreign-born population - Zimbabwe (%)
Place of birth for the foreign-born population - Other Eastern Africa (%)
Place of birth for the foreign-born population - Cameroon (%)
Place of birth for the foreign-born population - Congo (%)
Place of birth for the foreign-born population - Democratic Republic of Congo (Zaire) (%)
Place of birth for the foreign-born population - Other Middle Africa (%)
Place of birth for the foreign-born population - Egypt (%)
Place of birth for the foreign-born population - Morocco (%)
Place of birth for the foreign-born population - Sudan (%)
Place of birth for the foreign-born population - Other Northern Africa (%)
Place of birth for the foreign-born population - South Africa (%)
Place of birth for the foreign-born population - Other Southern Africa (%)
Place of birth for the foreign-born population - Cabo Verde (%)
Place of birth for the foreign-born population - Ghana (%)
Place of birth for the foreign-born population - Liberia (%)
Place of birth for the foreign-born population - Nigeria (%)
Place of birth for the foreign-born population - Senegal (%)
Place of birth for the foreign-born population - Sierra Leone (%)
Place of birth for the foreign-born population - Other Western Africa (%)
Place of birth for the foreign-born population - Australia (%)
Place of birth for the foreign-born population - New Zealand (%)
Place of birth for the foreign-born population - Fiji (%)
Place of birth for the foreign-born population - Micronesia (%)
Place of birth for the foreign-born population - Bahamas (%)
Place of birth for the foreign-born population - Barbados (%)
Place of birth for the foreign-born population - Cuba (%)
Place of birth for the foreign-born population - Dominica (%)
Place of birth for the foreign-born population - Dominican Republic (%)
Place of birth for the foreign-born population - Grenada (%)
Place of birth for the foreign-born population - Haiti (%)
Place of birth for the foreign-born population - Jamaica (%)
Place of birth for the foreign-born population - St. Vincent and the Grenadines (%)
Place of birth for the foreign-born population - Trinidad and Tobago (%)
Place of birth for the foreign-born population - West Indies (%)
Place of birth for the foreign-born population - Other Caribbean (%)
Place of birth for the foreign-born population - Belize (%)
Place of birth for the foreign-born population - Costa Rica (%)
Place of birth for the foreign-born population - El Salvador (%)
Place of birth for the foreign-born population - Guatemala (%)
Place of birth for the foreign-born population - Honduras (%)
Place of birth for the foreign-born population - Mexico (%)
Place of birth for the foreign-born population - Nicaragua (%)
Place of birth for the foreign-born population - Panama (%)
Place of birth for the foreign-born population - Other Central America (%)
Place of birth for the foreign-born population - Argentina (%)
Place of birth for the foreign-born population - Bolivia (%)
Place of birth for the foreign-born population - Brazil (%)
Place of birth for the foreign-born population - Chile (%)
Place of birth for the foreign-born population - Colombia (%)
Place of birth for the foreign-born population - Ecuador (%)
Place of birth for the foreign-born population - Guyana (%)
Place of birth for the foreign-born population - Peru (%)
Place of birth for the foreign-born population - Uruguay (%)
Place of birth for the foreign-born population - Venezuela (%)
Place of birth for the foreign-born population - Other South America (%)
Place of birth for the foreign-born population - Canada (%)
Place of birth for the foreign-born population - Other Northern America (%)
Place of birth for the foreign-born population - Other (%)
Latest news about races in Fayetteville, NC collected exclusively by city-data.com from local newspapers, TV, and radio stations
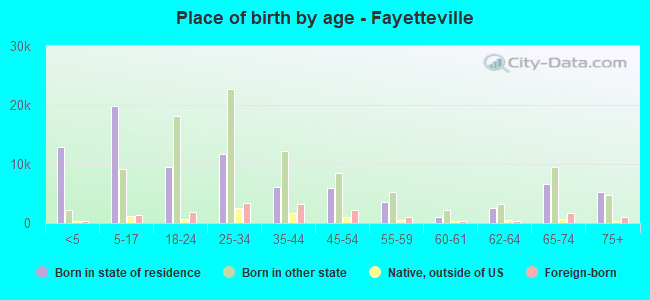
According to 2022 data, the most numerous races in Fayetteville, NC are White alone (73,001 residents), Black alone (85,243 residents), and Hispanic (27,353 residents). 86.2% of Fayetteville residents speak English at home. 8.3% of Fayetteville, NC residents are foreign-born (3.4% born in Latin America, 2.4% born in Asia, 1.0% born in Europe, 0.9% born in Africa), which is 3.3% greater than the foreign-born rate of 8.0% across the entire state of North Carolina.
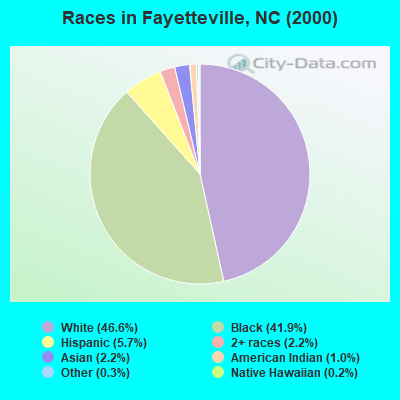
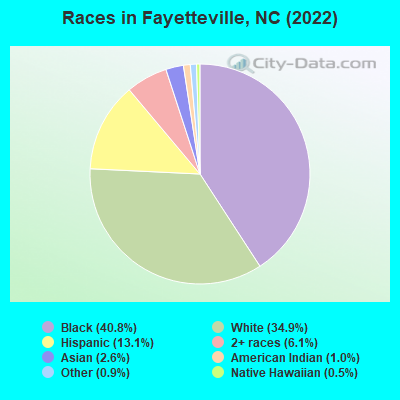
Race distribution in Fayetteville
2000 2022
56,419 46.6% White alone 50,656 41.9% Black alone 6,862 5.7% Hispanic 2,670 2.2% Two or more races 2,606 2.2% Asian alone 1,234 1.0% American Indian alone 334 0.3% Other race alone 234 0.2% Native Hawaiian and Other
85,243 40.8% Black alone 73,001 34.9% White alone 27,353 13.1% Hispanic 12,811 6.1% Two or more races 5,505 2.6% Asian alone 2,130 1.0% American Indian alone 1,812 0.9% Other race alone 1,033 0.5% Native Hawaiian and Other
2000 2022
5,647,155 70.2% White alone 1,723,301 21.4% Black alone 378,963 4.7% Hispanic 112,416 1.4% Asian alone 95,333 1.2% American Indian alone 79,965 1.0% Two or more races 9,015 0.1% Other race alone 3,165 0.04% Native Hawaiian and Other
6,497,519 60.7% White alone 2,155,650 20.1% Black alone 1,114,799 10.4% Hispanic 438,061 4.1% Two or more races 341,052 3.2% Asian alone 91,758 0.9% American Indian alone 50,180 0.5% Other race alone 9,954 0.09% Native Hawaiian and Other
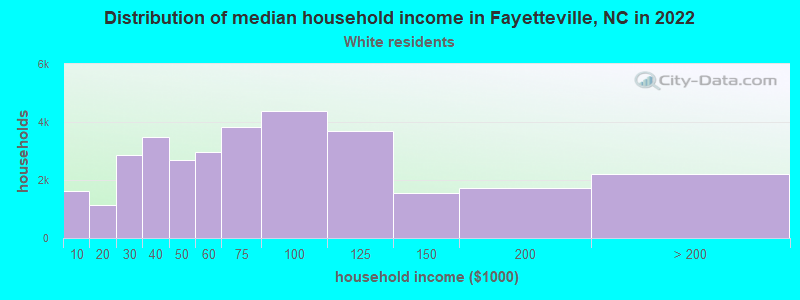
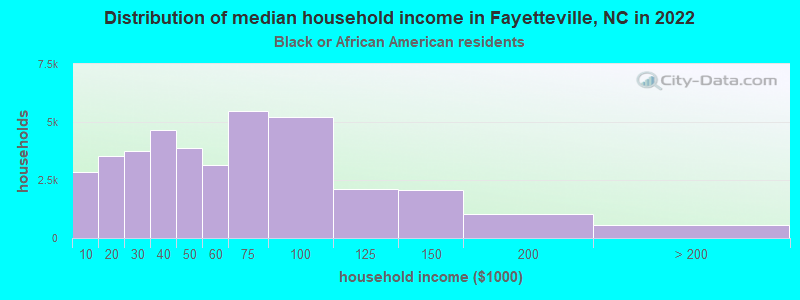
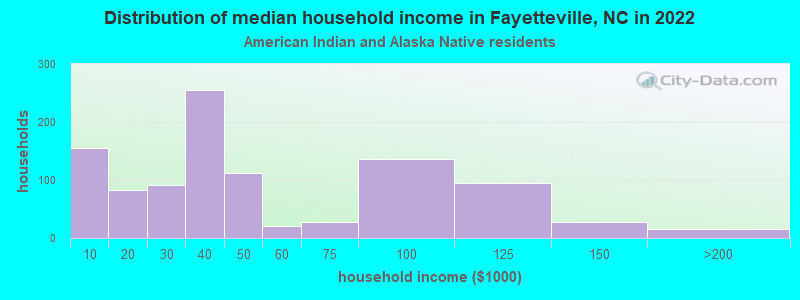
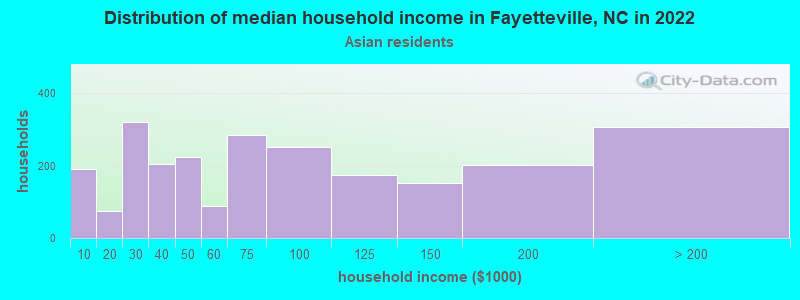
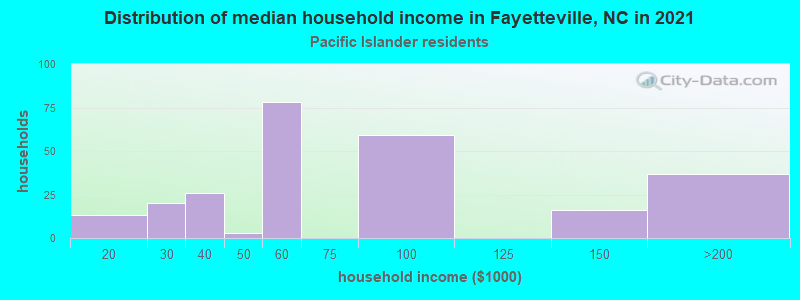
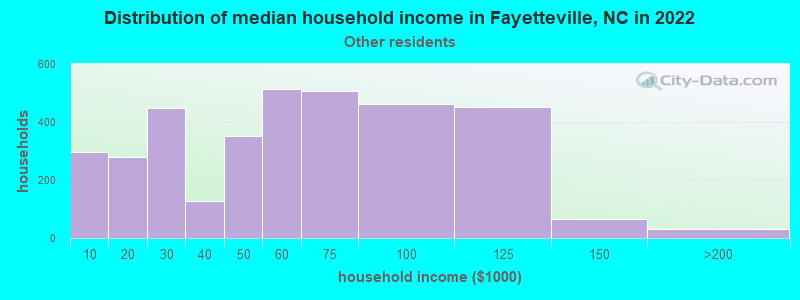
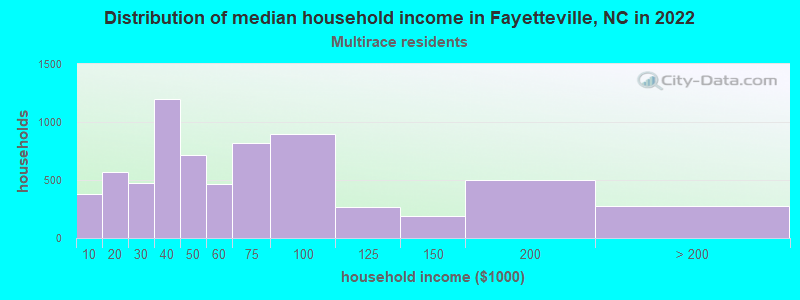
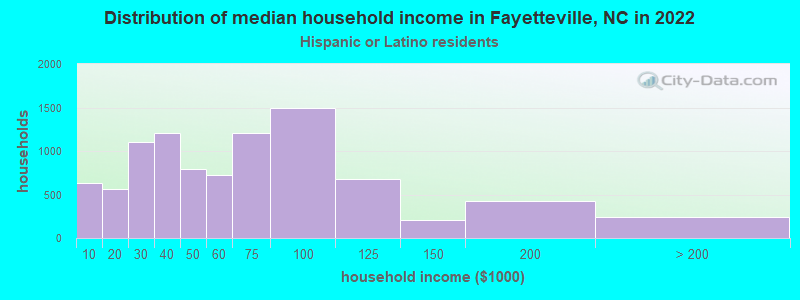
Income and house value in Fayetteville Median household income in 2022 $65,842 White non-Hispanic householders$51,383 Black householders$38,716 American Indian and Alaska Native householders$67,083 Asian householders$102,655 Native Hawaiian and other Pacific Islander householders$55,300 Some other race householders$50,391 Two or more races householders$55,657 Hispanic or Latino race householdersMedian 2022 house value $197,408 White Non-Hispanic householders$168,795 Black or African American householders$146,975 American Indian or Alaska Native householders $203,995 Asian householders$196,791 Native Hawaiian and other Pacific Islander householders$168,590 Some other race householders$178,676 Two or more races householders$181,146 Hispanic or Latino householders
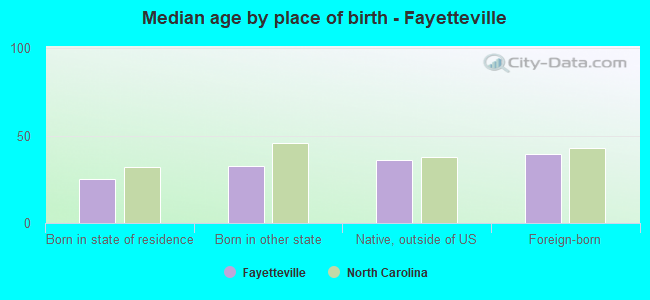
Median age by race in Fayetteville
31.0 Median age for White residents29.1 35.2 33.3 Median age for Black or African American residents31.8 35.1 38.5 Median age for American Indian / Alaska Native residents36.8 38.6 34.7 Median age for Asian residents28.9 41.0 31.9 Median age for Native Hawaiian / Pacific Islander residents34.9 25.0 27.8 Median age for Other race residents28.7 27.6 25.0 Median age for Two or more races residents24.4 25.8 31.4 Median age for White alone residents29.4 36.0 26.0 Median age for Hispanic or Latino residents26.0 26.0
Owner/renter occupied households by race in Fayetteville
House owners and renters - White residents 18,259 56.8% Owner occupied13,905 43.2% Renter occupiedHouse owners and renters - Black or African American residents 16,967 44.4% Owner occupied21,266 55.6% Renter occupiedHouse owners and renters - American Indian / Alaska Native residents 548 44.1% Owner occupied694 55.9% Renter occupiedHouse owners and renters - Asian residents 1,410 60.3% Owner occupied927 39.7% Renter occupiedHouse owners and renters - Native Hawaiian / Pacific Islander residents 228 47.5% Owner occupied252 52.5% Renter occupiedHouse owners and renters - Other race residents 1,934 54.7% Owner occupied1,602 45.3% Renter occupiedHouse owners and renters - Two or more races residents 2,609 38.6% Owner occupied4,154 61.4% Renter occupiedHouse owners and renters - White alone residents 17,892 57.7% Owner occupied13,091 42.3% Renter occupiedHouse owners and renters - Hispanic or Latino residents 4,025 43.4% Owner occupied5,242 56.6% Renter occupied
Language usage in Fayetteville
English speakers - Total 86.2% of residents of Fayetteville speak English at home.
8.1% of residents speak Spanish at home 10,904 69.4% Speak English very well4,801 30.6% Speak English less than very well5.7% of residents speak other language at home 7,691 69.9% Speak English very well3,305 30.1% Speak English less than very well
English speakers - Born in the United States 92.5% of residents of Fayetteville speak English at home.
5.5% of residents speak Spanish at home 4,643 88.4% Speak English very well608 11.6% Speak English less than very well2.0% of residents speak other language at home 1,874 95.9% Speak English very well80 4.1% Speak English less than very well
English speakers - Native, born elsewhere 54.5% of residents of Fayetteville speak English at home.
33.9% of residents speak Spanish at home 2,054 64.2% Speak English very well1,146 35.8% Speak English less than very well11.6% of residents speak other language at home 876 80.1% Speak English very well217 19.9% Speak English less than very well
English speakers - Foreign-born 24.8% of residents of Fayetteville speak English at home.
29.9% of residents speak Spanish at home 2,063 42.3% Speak English very well2,809 57.7% Speak English less than very well45.3% of residents speak other language at home 4,491 60.9% Speak English very well2,888 39.1% Speak English less than very well
White (Caucasian) - Speak only English Native:
95.4% (65,867)Foreign-born:
20.6% (509)
White (Caucasian) - Speak another language Native:
4.6% (3,180)Foreign-born:
79.4% (1,960)
Black or African American - Speak only English Native:
97.8% (76,644)Foreign-born:
54.6% (2,274)
Black or African American - Speak another language Native:
2.2% (1,738)Foreign-born:
45.4% (1,888)
American Indian / Alaska Native - Speak only English Native:
91.0% (1,603)Foreign-born:
11.5% (15)
American Indian / Alaska Native - Speak another language Native:
8.5% (150)Foreign-born:
83.3% (105)
Asian - Speak only English Native:
59.1% (974)Foreign-born:
13.6% (510)
Asian - Speak another language Native:
40.9% (673)Foreign-born:
86.4% (3,244)
Native Hawaiian / Pacific Islander - Speak another language Native:
31.2% (213)Foreign-born:
100.0% (472)
Other race - Speak only English Native:
44.2% (2,826)Foreign-born:
11.5% (268)
Other race - Speak another language Native:
55.8% (3,573)Foreign-born:
88.5% (2,055)
Two or more races - Speak only English Native:
73.7% (13,715)Foreign-born:
17.2% (488)
Two or more races - Speak another language Native:
26.3% (4,906)Foreign-born:
82.8% (2,355)
White alone - Speak only English Native:
96.5% (64,057)Foreign-born:
24.0% (509)
White alone - Speak another language Native:
3.5% (2,307)Foreign-born:
76.0% (1,609)
Hispanic or Latino - Speak only English Native:
48.7% (9,281)Foreign-born:
7.4% (371)
Hispanic or Latino - Speak another language Native:
51.3% (9,790)Foreign-born:
92.6% (4,672)
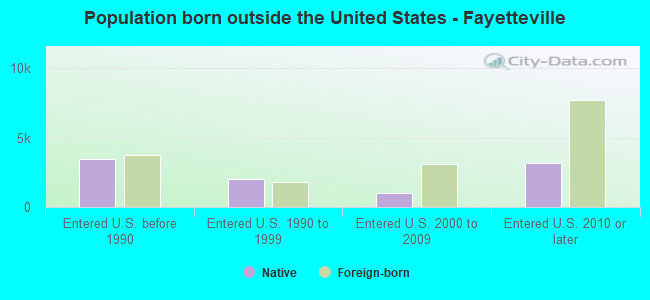
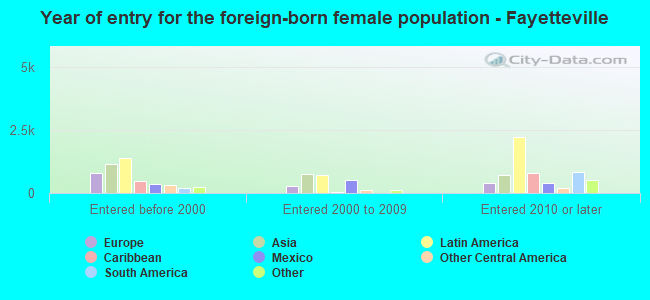
Foreign-born residents in Fayetteville 17,341 residents are foreign born (3.4% Latin America , 2.4% Asia , 1.0% Europe , 0.9% Africa ).
This city:
8.3%North Carolina:
8.3%
Marital status for residents in Fayetteville Marital status - White (Caucasian) population 15 years and over
Males 39.0% Never married45.5% Now married2.0% Separated2.8% Widowed10.7% DivorcedFemales 22.5% Never married51.6% Now married3.0% Separated9.5% Widowed13.4% DivorcedWomen who gave birth in the past 12 months Now married:
87.9% (1,277)Unmarried:
12.1% (175)
Women who did not give birth in the past 12 months Now married:
51.8% (8,564)Unmarried:
48.2% (7,970)
Marital status - Black or African American population 15 years and over
Males 41.0% Never married41.2% Now married3.5% Separated3.2% Widowed11.2% DivorcedFemales 37.7% Never married33.2% Now married5.7% Separated8.0% Widowed15.4% DivorcedWomen who gave birth in the past 12 months Now married:
43.7% (568)Unmarried:
56.3% (733)
Women who did not give birth in the past 12 months Now married:
30.3% (6,061)Unmarried:
69.7% (13,975)
Marital status - American Indian / Alaska Native population 15 years and over
Males 26.3% Never married60.3% Now married8.1% Separated0.0% Widowed5.4% DivorcedFemales 29.0% Never married37.0% Now married4.6% Separated19.7% Widowed9.7% DivorcedWomen who gave birth in the past 12 months Now married:
100.0% (15)Unmarried:
0.0% (0)
Women who did not give birth in the past 12 months Now married:
35.1% (207)Unmarried:
64.9% (382)
Marital status - Asian population 15 years and over
Males 43.2% Never married50.7% Now married2.1% Separated0.0% Widowed4.0% DivorcedFemales 8.2% Never married72.3% Now married0.0% Separated11.1% Widowed8.3% DivorcedWomen who gave birth in the past 12 months Now married:
100.0% (82)Unmarried:
0.0% (0)
Women who did not give birth in the past 12 months Now married:
59.9% (911)Unmarried:
40.1% (609)
Marital status - Native Hawaiian / Pacific Islander population 15 years and over
Males 40.4% Never married54.2% Now married0.0% Separated5.4% Widowed0.0% DivorcedFemales 25.4% Never married50.8% Now married3.0% Separated8.6% Widowed12.2% DivorcedWomen who gave birth in the past 12 months Now married:
100.0% (9)Unmarried:
0.0% (0)
Women who did not give birth in the past 12 months Now married:
51.7% (128)Unmarried:
48.3% (120)
Marital status - Other race population 15 years and over
Males 37.8% Never married54.5% Now married1.9% Separated0.0% Widowed5.8% DivorcedFemales 29.2% Never married51.1% Now married5.8% Separated4.6% Widowed9.4% DivorcedWomen who gave birth in the past 12 months Now married:
100.0% (301)Unmarried:
0.0% (0)
Women who did not give birth in the past 12 months Now married:
54.6% (1,485)Unmarried:
45.4% (1,235)
Marital status - Two or more races population 15 years and over
Males 54.9% Never married39.5% Now married1.4% Separated0.9% Widowed3.3% DivorcedFemales 36.9% Never married46.1% Now married1.5% Separated2.2% Widowed13.3% DivorcedWomen who gave birth in the past 12 months Now married:
43.8% (113)Unmarried:
56.2% (145)
Women who did not give birth in the past 12 months Now married:
43.7% (2,474)Unmarried:
56.3% (3,181)
Marital status - White alone, not Hispanic / Latino population 15 years and over
Males 38.9% Never married45.1% Now married2.1% Separated2.9% Widowed10.9% DivorcedFemales 22.2% Never married52.6% Now married2.9% Separated9.9% Widowed12.4% DivorcedWomen who gave birth in the past 12 months Now married:
94.9% (1,277)Unmarried:
5.1% (68)
Women who did not give birth in the past 12 months Now married:
53.3% (8,324)Unmarried:
46.7% (7,294)
Marital status - Hispanic or Latino population 15 years and over
Males 41.9% Never married51.9% Now married1.4% Separated0.8% Widowed4.0% DivorcedFemales 30.1% Never married50.6% Now married4.0% Separated3.0% Widowed12.3% DivorcedWomen who gave birth in the past 12 months Now married:
61.0% (346)Unmarried:
39.0% (221)
Women who did not give birth in the past 12 months Now married:
50.5% (3,407)Unmarried:
49.5% (3,345)
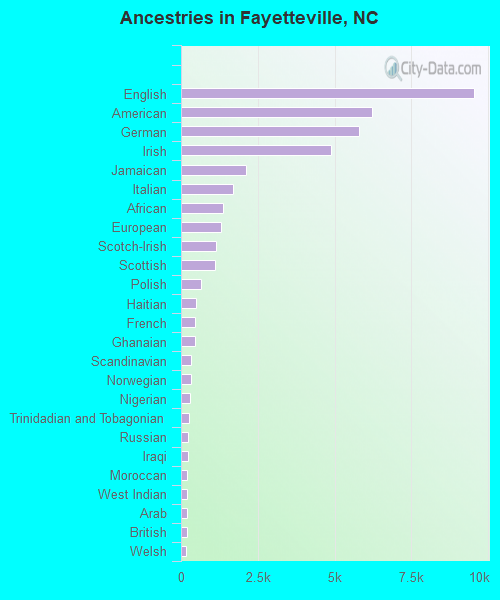
Ancestries in Fayetteville
9,551 7.0% English6,206 4.6% American5,804 4.3% German4,885 3.6% Irish2,123 1.6% Jamaican1,698 1.2% Italian1,354 1.0% African1,287 0.9% European1,148 0.8% Scotch-Irish1,115 0.8% Scottish643 0.5% Polish497 0.4% Haitian469 0.3% French464 0.3% Ghanaian318 0.2% Scandinavian316 0.2% Norwegian279 0.2% Nigerian269 0.2% Trinidadian and Tobagonian241 0.2% Russian213 0.2% Iraqi205 0.2% Moroccan194 0.1% West Indian193 0.1% Arab184 0.1% British155 0.1% Welsh145 0.1% French Canadian138 0.1% Barbadian137 0.1% Dutch132 0.10% Turkish128 0.09% Eastern European126 0.09% Greek123 0.09% Swedish117 0.09% Danish107 0.08% Guyanese90 0.07% Ethiopian90 0.07% Swiss81 0.06% Ukrainian80 0.06% Lebanese80 0.06% Northern European79 0.06% Hungarian75 0.06% Dutch West Indian69 0.05% Portuguese69 0.05% British West Indian66 0.05% Slovak62 0.05% Czech61 0.04% Austrian60 0.04% Czechoslovakian59 0.04% Croatian57 0.04% Canadian55 0.04% Egyptian53 0.04% Slavic49 0.04% Albanian44 0.03% Armenian44 0.03% Kenyan43 0.03% Romanian41 0.03% Yugoslavian40 0.03% New Zealander37 0.03% Bulgarian36 0.03% Belgian35 0.03% Sierra Leonean34 0.03% Pennsylvania German33 0.02% Afghan33 0.02% Celtic31 0.02% Finnish25 0.02% Brazilian25 0.02% Latvian25 0.02% Cajun24 0.02% Israeli23 0.02% Zimbabwean22 0.02% German Russian22 0.02% Liberian20 0.01% Sudanese18 0.01% Bahamian16 0.01% Syrian13 0.01% U.S. Virgin Islander11 0.01% Iranian9 0.01% Australian8 0.01% Somali7 0.01% Icelander7 0.01% Serbian
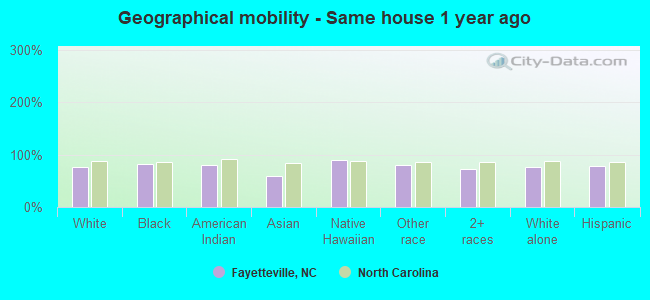
Geographical mobility in Fayetteville Same house 1 year ago 57,017 75.8% White (Caucasian)72,910 83.0% Black or African American2,229 80.2% American Indian / Alaska Native3,349 58.8% Asian1,329 88.8% Native Hawaiian / Pacific Islander7,510 79.8% Other race17,431 73.3% Two or more races54,047 75.5% White alone, not Hispanic / Latino21,215 79.0% Hispanic or LatinoMoved within same county 7,080 9.4% White / Caucasian9,062 10.3% Black or African American258 9.3% American Indian / Alaska Native1,082 19.0% Asian8 0.5% Native Hawaiian / Pacific Islander548 5.8% Other race3,827 16.1% Two or more races6,684 9.3% White alone, not Hispanic / Latino2,591 9.7% Hispanic or LatinoMoved within same state 2,021 2.7% White / Caucasian1,264 1.4% Black or African American106 3.8% American Indian / Alaska Native428 7.5% Asian182 12.1% Native Hawaiian / Pacific Islander172 1.8% Other race589 2.5% Two or more races2,021 2.8% White alone, not Hispanic / Latino547 2.0% Hispanic or LatinoMoved from different state 7,637 10.2% White / Caucasian3,313 3.8% Black or African American131 4.7% American Indian / Alaska Native699 12.3% Asian25 1.7% Native Hawaiian / Pacific Islander1,003 10.7% Other race1,845 7.8% Two or more races7,427 10.4% White alone, not Hispanic / Latino2,264 8.4% Hispanic or LatinoMoved from abroad 1,448 1.9% White1,341 1.5% Black or African American57 2.0% American Indian / Alaska Native136 2.4% Asian29 1.9% Native Hawaiian / Pacific Islander177 1.9% Other race75 0.3% Two or more races1,448 2.0% White alone, not Hispanic / Latino229 0.9% Hispanic or Latino
Children Nativity (place of birth) in Fayetteville
Children under 6 years - Living with two parents Both parents native 9,485 100.0% NativeBoth parents foreign-born 956 75.3% Native314 24.7% Foreign-bornOne native, one foreign-born parent 612 100.0% NativeChildren under 6 years - Living with one parent Native parent 5,973 100.0% NativeForeign-born parent 271 100.0% NativeChildren 6 to 17 years - Living with two parents Both parents native 11,044 100.0% NativeBoth parents foreign-born 867 72.7% Native326 27.3% Foreign-bornOne native, one foreign-born parent 1,195 90.9% Native119 9.1% Foreign-bornChildren 6 to 17 years - Living with one parent Native parent 11,350 98.9% Native131 1.1% Foreign-bornForeign-born parent 1,241 69.1% Native555 30.9% Foreign-born
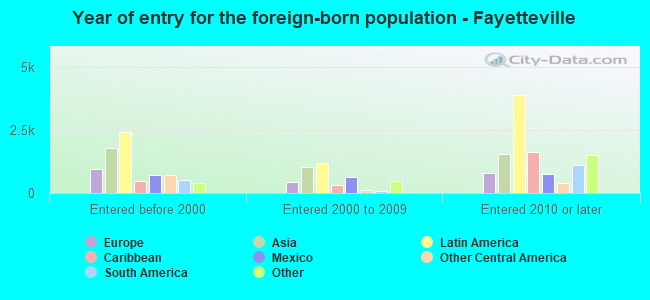
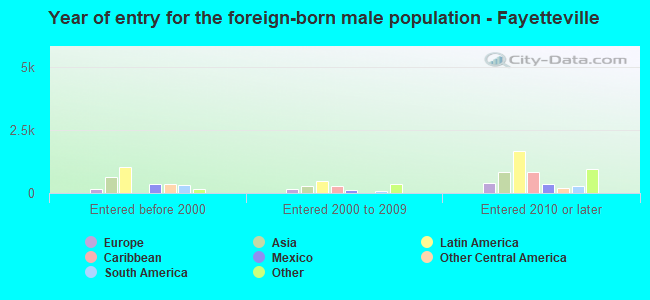
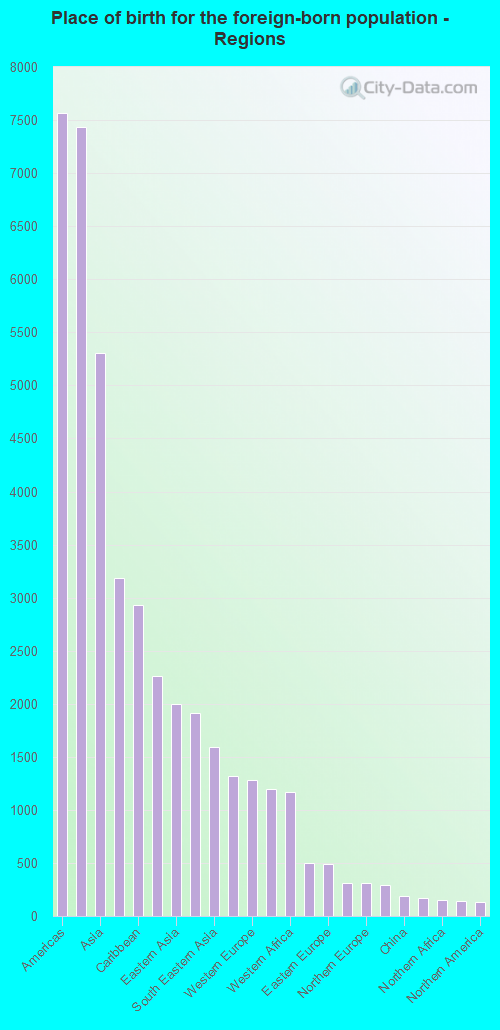
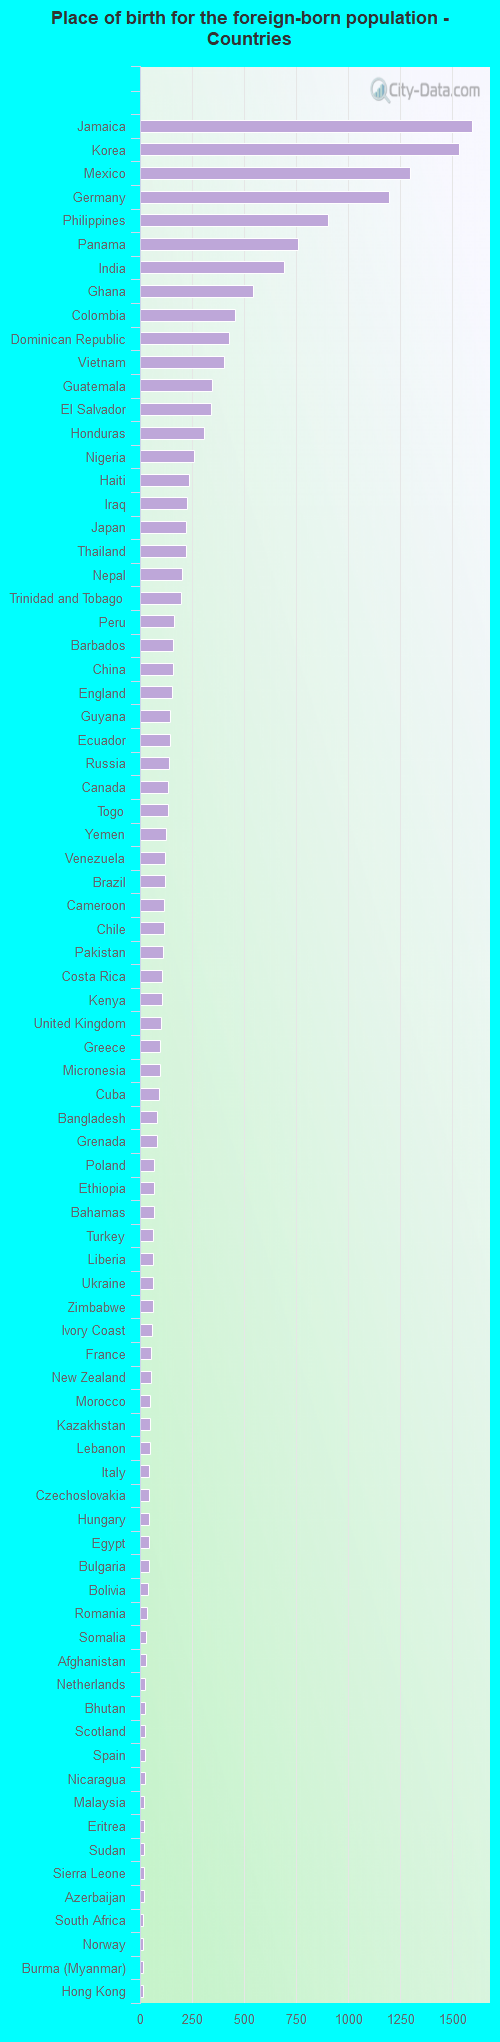
Place of birth for residents in Fayetteville 7,569 Americas7,432 Latin America5,308 Asia3,186 Central America2,931 Caribbean2,258 Europe1,995 Eastern Asia1,917 Africa1,592 South Eastern Asia1,315 South America1,286 Western Europe1,194 South Central Asia1,169 Western Africa500 Western Asia493 Eastern Europe313 Eastern Africa311 Northern Europe288 Oceania184 China166 Southern Europe153 Northern Africa144 Middle Africa136 Northern America57 Southern Africa51 Australia and New Zealand Subregion1,596 Jamaica1,534 Korea1,298 Mexico1,196 Germany903 Philippines760 Panama690 India543 Ghana454 Colombia427 Dominican Republic401 Vietnam348 Guatemala341 El Salvador309 Honduras259 Nigeria235 Haiti227 Iraq219 Japan219 Thailand200 Nepal199 Trinidad and Tobago163 Peru159 Barbados159 China154 England146 Guyana142 Ecuador137 Russia136 Canada135 Togo127 Yemen119 Venezuela118 Brazil115 Cameroon115 Chile111 Pakistan105 Costa Rica104 Kenya100 United Kingdom98 Greece94 Micronesia91 Cuba82 Bangladesh81 Grenada69 Poland68 Ethiopia67 Bahamas64 Turkey64 Liberia64 Ukraine63 Zimbabwe57 Ivory Coast51 France51 New Zealand49 Morocco48 Kazakhstan47 Lebanon45 Italy44 Czechoslovakia43 Hungary43 Egypt41 Bulgaria40 Bolivia35 Romania28 Somalia28 Afghanistan26 Netherlands25 Bhutan24 Scotland23 Spain23 Nicaragua21 Malaysia21 Eritrea21 Sudan20 Sierra Leone20 Azerbaijan16 South Africa16 Norway16 Burma (Myanmar)15 Hong Kong14 Argentina13 Saudi Arabia11 Albania11 Austria11 Cambodia11 Algeria10 Dominica9 Indonesia9 Taiwan9 Fiji8 St. Lucia8 Serbia7 Cabo Verde6 Uzbekistan6 Ireland3 Laos
Grandparents responsible for own grandchildren in Fayetteville
Grandparents (30 to 59 years) White / Caucasian 221 75.2% Responsible for grandchildren73 24.8% Not responsible for grandchildrenBlack or African American 773 57.9% Responsible for grandchildren561 42.1% Not responsible for grandchildrenAmerican Indian / Alaska Native 50 64.9% Responsible for grandchildren27 35.1% Not responsible for grandchildrenAsian 21 70.8% Responsible for grandchildren9 29.2% Not responsible for grandchildrenOther race 18 20.0% Responsible for grandchildren71 80.0% Not responsible for grandchildrenTwo or more races 107 69.0% Responsible for grandchildren48 31.0% Not responsible for grandchildrenWhite alone, not Hispanic / Latino 221 75.2% Responsible for grandchildren73 24.8% Not responsible for grandchildrenHispanic or Latino 66 35.6% Responsible for grandchildren119 64.4% Not responsible for grandchildrenGrandparents (60 years and over) White / Caucasian 410 40.8% Responsible for grandchildren595 59.2% Not responsible for grandchildrenBlack or African American 561 49.3% Responsible for grandchildren577 50.7% Not responsible for grandchildrenAmerican Indian / Alaska Native 38 100.0% Responsible for grandchildrenAsian 90 31.4% Responsible for grandchildren196 68.6% Not responsible for grandchildrenOther race 19 21.3% Responsible for grandchildren71 78.7% Not responsible for grandchildrenTwo or more races 50 35.6% Responsible for grandchildren90 64.4% Not responsible for grandchildrenWhite alone, not Hispanic / Latino 410 40.8% Responsible for grandchildren595 59.2% Not responsible for grandchildrenHispanic or Latino 13 8.3% Responsible for grandchildren146 91.7% Not responsible for grandchildren
Zip codes: 28301 , 28303 , 28304 , 28305 , 28306 , 28307 , 28308 , 28310 , 28311 , 28314 , 28390 .