Races in Fate, Texas (TX) Detailed Stats
Data:
Races - White alone (%)
Races - White alone (% change since 2000)
Races - Black alone (%)
Races - Black alone (% change since 2000)
Races - American Indian alone (%)
Races - American Indian alone (% change since 2000)
Races - Asian alone (%)
Races - Asian alone (% change since 2000)
Races - Hispanic (%)
Races - Hispanic (% change since 2000)
Races - Native Hawaiian and Other Pacific Islander alone (%)
Races - Native Hawaiian and Other Pacific Islander alone (% change since 2000)
Races - Two or more races(%)
Races - Two or more races(% change since 2000)
Races - Other race alone (%)
Races - Other race alone (% change since 2000)
Racial diversity
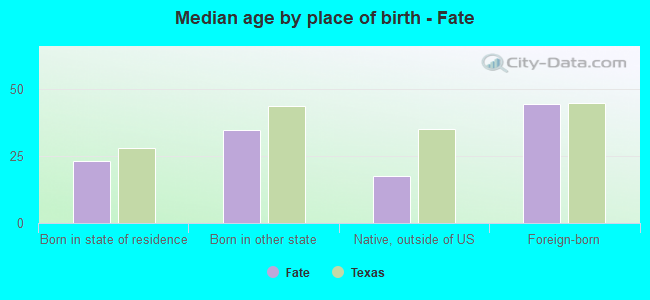
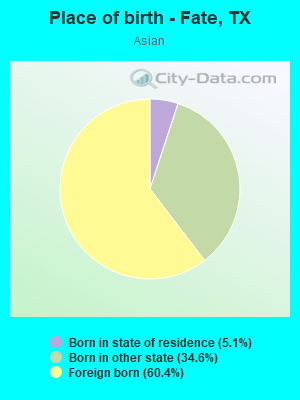
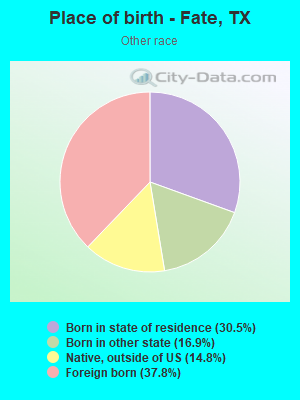
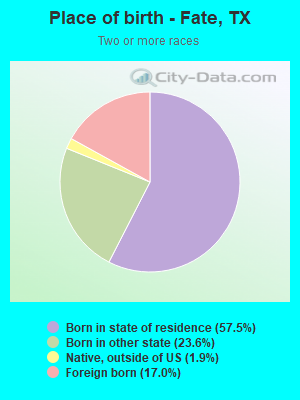
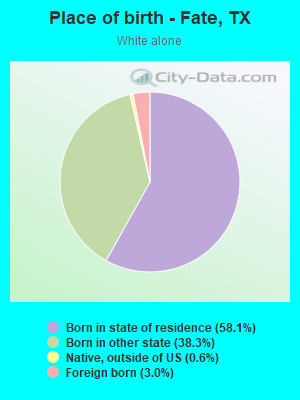
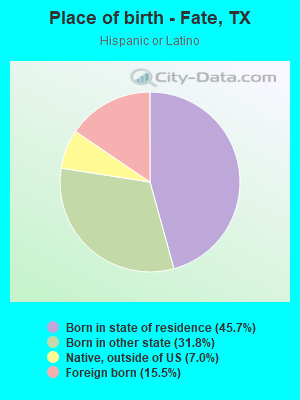
Place of birth - Born in state of residence (%)
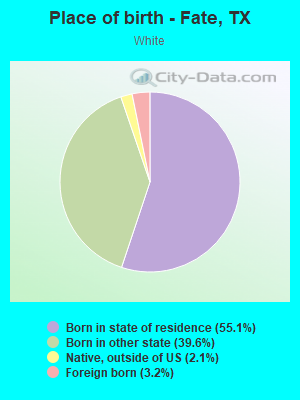
Place of birth - Born in state of residence (%) - White
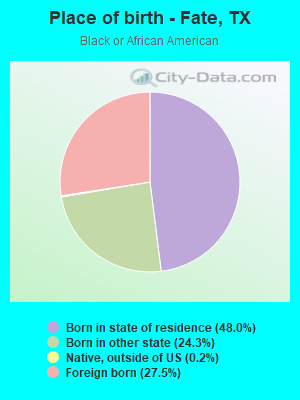
Place of birth - Born in state of residence (%) - Black or African American
Place of birth - Born in state of residence (%) - Asian
Place of birth - Born in state of residence (%) - Hispanic or Latino
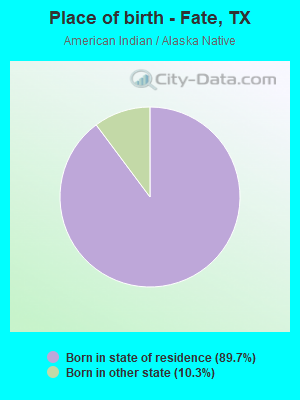
Place of birth - Born in state of residence (%) - American Indian and Alaska Native
Place of birth - Born in state of residence (%) - Multirace
Place of birth - Born in state of residence (%) - Other Race
Place of birth - Born in other state (%)
Place of birth - Born in other state (%) - White
Place of birth - Born in other state (%) - Black or African American
Place of birth - Born in other state (%) - Asian
Place of birth - Born in other state (%) - Hispanic or Latino
Place of birth - Born in other state (%) - American Indian and Alaska Native
Place of birth - Born in other state (%) - Multirace
Place of birth - Born in other state (%) - Other Race
Place of birth - Native, outside of US (%)
Place of birth - Native, outside of US (%) - White
Place of birth - Native, outside of US (%) - Black or African American
Place of birth - Native, outside of US (%) - Asian
Place of birth - Native, outside of US (%) - Hispanic or Latino
Place of birth - Native, outside of US (%) - American Indian and Alaska Native
Place of birth - Native, outside of US (%) - Multirace
Place of birth - Native, outside of US (%) - Other Race
Place of birth - Foreign born (%)
Place of birth - Foreign born (%) - White
Place of birth - Foreign born (%) - Black or African American
Place of birth - Foreign born (%) - Asian
Place of birth - Foreign born (%) - Hispanic or Latino
Place of birth - Foreign born (%) - American Indian and Alaska Native
Place of birth - Foreign born (%) - Multirace
Place of birth - Foreign born (%) - Other Race
Residents speaking English at home (%)
Residents speaking English at home - Born in the United States (%)
Residents speaking English at home - Native, born elsewhere (%)
Residents speaking English at home - Foreign born (%)
Residents speaking Spanish at home (%)
Residents speaking Spanish at home - Born in the United States (%)
Residents speaking Spanish at home - Native, born elsewhere (%)
Residents speaking Spanish at home - Foreign born (%)
Residents speaking other language at home (%)
Residents speaking other language at home - Born in the United States (%)
Residents speaking other language at home - Native, born elsewhere (%)
Residents speaking other language at home - Foreign born (%)
Marital status - Never married (%)
Marital status - Now married (%)
Marital status - Separated (%)
Marital status - Widowed (%)
Marital status - Divorced (%)
Ancestries Reported - Arab (%)
Ancestries Reported - Czech (%)
Ancestries Reported - Danish (%)
Ancestries Reported - Dutch (%)
Ancestries Reported - English (%)
Ancestries Reported - French (%)
Ancestries Reported - French Canadian (%)
Ancestries Reported - German (%)
Ancestries Reported - Greek (%)
Ancestries Reported - Hungarian (%)
Ancestries Reported - Irish (%)
Ancestries Reported - Italian (%)
Ancestries Reported - Lithuanian (%)
Ancestries Reported - Norwegian (%)
Ancestries Reported - Polish (%)
Ancestries Reported - Portuguese (%)
Ancestries Reported - Russian (%)
Ancestries Reported - Scotch-Irish (%)
Ancestries Reported - Scottish (%)
Ancestries Reported - Slovak (%)
Ancestries Reported - Subsaharan African (%)
Ancestries Reported - Swedish (%)
Ancestries Reported - Swiss (%)
Ancestries Reported - Ukrainian (%)
Ancestries Reported - United States (%)
Ancestries Reported - Welsh (%)
Ancestries Reported - West Indian (%)
Ancestries Reported - Other (%)
Geographical mobility - Same house 1 year ago (%)
Geographical mobility - Same house 1 year ago (%) - White
Geographical mobility - Same house 1 year ago (%) - Black or African American
Geographical mobility - Same house 1 year ago (%) - Asian
Geographical mobility - Same house 1 year ago (%) - Hispanic or Latino
Geographical mobility - Same house 1 year ago (%) - American Indian and Alaska Native
Geographical mobility - Same house 1 year ago (%) - Multirace
Geographical mobility - Same house 1 year ago (%) - Other Race
Geographical mobility - Moved within same county (%)
Geographical mobility - Moved within same county (%) - White
Geographical mobility - Moved within same county (%) - Black or African American
Geographical mobility - Moved within same county (%) - Asian
Geographical mobility - Moved within same county (%) - Hispanic or Latino
Geographical mobility - Moved within same county (%) - American Indian and Alaska Native
Geographical mobility - Moved within same county (%) - Multirace
Geographical mobility - Moved within same county (%) - Other Race
Geographical mobility - Moved from different county within same state (%)
Geographical mobility - Moved from different county within same state (%) - White
Geographical mobility - Moved from different county within same state (%) - Black or African American
Geographical mobility - Moved from different county within same state (%) - Asian
Geographical mobility - Moved from different county within same state (%) - Hispanic or Latino
Geographical mobility - Moved from different county within same state (%) - American Indian and Alaska Native
Geographical mobility - Moved from different county within same state (%) - Multirace
Geographical mobility - Moved from different county within same state (%) - Other Race
Geographical mobility - Moved from different state (%)
Geographical mobility - Moved from different state (%) - White
Geographical mobility - Moved from different state (%) - Black or African American
Geographical mobility - Moved from different state (%) - Asian
Geographical mobility - Moved from different state (%) - Hispanic or Latino
Geographical mobility - Moved from different state (%) - American Indian and Alaska Native
Geographical mobility - Moved from different state (%) - Multirace
Geographical mobility - Moved from different state (%) - Other Race
Geographical mobility - Moved from abroad (%)
Geographical mobility - Moved from abroad (%) - White
Geographical mobility - Moved from abroad (%) - Black or African American
Geographical mobility - Moved from abroad (%) - Asian
Geographical mobility - Moved from abroad (%) - Hispanic or Latino
Geographical mobility - Moved from abroad (%) - American Indian and Alaska Native
Geographical mobility - Moved from abroad (%) - Multirace
Geographical mobility - Moved from abroad (%) - Other Race
Place of birth for the foreign-born population - Ireland (%)
Place of birth for the foreign-born population - Denmark (%)
Place of birth for the foreign-born population - Norway (%)
Place of birth for the foreign-born population - Sweden (%)
Place of birth for the foreign-born population - United Kingdom (%)
Place of birth for the foreign-born population - England (%)
Place of birth for the foreign-born population - Scotland (%)
Place of birth for the foreign-born population - Other Northern Europe (%)
Place of birth for the foreign-born population - Austria (%)
Place of birth for the foreign-born population - Belgium (%)
Place of birth for the foreign-born population - France (%)
Place of birth for the foreign-born population - Germany (%)
Place of birth for the foreign-born population - Netherlands (%)
Place of birth for the foreign-born population - Switzerland (%)
Place of birth for the foreign-born population - Other Western Europe (%)
Place of birth for the foreign-born population - Greece (%)
Place of birth for the foreign-born population - Italy (%)
Place of birth for the foreign-born population - Portugal (%)
Place of birth for the foreign-born population - Spain (%)
Place of birth for the foreign-born population - Other Southern Europe (%)
Place of birth for the foreign-born population - Albania (%)
Place of birth for the foreign-born population - Belarus (%)
Place of birth for the foreign-born population - Bosnia and Herzegovina (%)
Place of birth for the foreign-born population - Bulgaria (%)
Place of birth for the foreign-born population - Croatia (%)
Place of birth for the foreign-born population - Czechoslovakia (%)
Place of birth for the foreign-born population - Hungary (%)
Place of birth for the foreign-born population - Latvia (%)
Place of birth for the foreign-born population - Lithuania (%)
Place of birth for the foreign-born population - North Macedonia (Macedonia) (%)
Place of birth for the foreign-born population - Moldova (%)
Place of birth for the foreign-born population - Poland (%)
Place of birth for the foreign-born population - Romania (%)
Place of birth for the foreign-born population - Russia (%)
Place of birth for the foreign-born population - Serbia (%)
Place of birth for the foreign-born population - Ukraine (%)
Place of birth for the foreign-born population - Other Eastern Europe (%)
Place of birth for the foreign-born population - China (%)
Place of birth for the foreign-born population - Hong Kong (%)
Place of birth for the foreign-born population - Taiwan (%)
Place of birth for the foreign-born population - Japan (%)
Place of birth for the foreign-born population - Korea (%)
Place of birth for the foreign-born population - Other Eastern Asia (%)
Place of birth for the foreign-born population - Afghanistan (%)
Place of birth for the foreign-born population - Bangladesh (%)
Place of birth for the foreign-born population - India (%)
Place of birth for the foreign-born population - Iran (%)
Place of birth for the foreign-born population - Kazakhstan (%)
Place of birth for the foreign-born population - Nepal (%)
Place of birth for the foreign-born population - Pakistan (%)
Place of birth for the foreign-born population - Sri Lanka (%)
Place of birth for the foreign-born population - Uzbekistan (%)
Place of birth for the foreign-born population - Other South Central Asia (%)
Place of birth for the foreign-born population - Burma (%)
Place of birth for the foreign-born population - Cambodia (%)
Place of birth for the foreign-born population - Indonesia (%)
Place of birth for the foreign-born population - Laos (%)
Place of birth for the foreign-born population - Malaysia (%)
Place of birth for the foreign-born population - Philippines (%)
Place of birth for the foreign-born population - Singapore (%)
Place of birth for the foreign-born population - Thailand (%)
Place of birth for the foreign-born population - Vietnam (%)
Place of birth for the foreign-born population - Other South Eastern Asia (%)
Place of birth for the foreign-born population - Armenia (%)
Place of birth for the foreign-born population - Iraq (%)
Place of birth for the foreign-born population - Israel (%)
Place of birth for the foreign-born population - Jordan (%)
Place of birth for the foreign-born population - Kuwait (%)
Place of birth for the foreign-born population - Lebanon (%)
Place of birth for the foreign-born population - Saudi Arabia (%)
Place of birth for the foreign-born population - Syria (%)
Place of birth for the foreign-born population - Turkey (%)
Place of birth for the foreign-born population - Yemen (%)
Place of birth for the foreign-born population - Other Western Asia (%)
Place of birth for the foreign-born population - Eritrea (%)
Place of birth for the foreign-born population - Ethiopia (%)
Place of birth for the foreign-born population - Kenya (%)
Place of birth for the foreign-born population - Somalia (%)
Place of birth for the foreign-born population - Uganda (%)
Place of birth for the foreign-born population - Zimbabwe (%)
Place of birth for the foreign-born population - Other Eastern Africa (%)
Place of birth for the foreign-born population - Cameroon (%)
Place of birth for the foreign-born population - Congo (%)
Place of birth for the foreign-born population - Democratic Republic of Congo (Zaire) (%)
Place of birth for the foreign-born population - Other Middle Africa (%)
Place of birth for the foreign-born population - Egypt (%)
Place of birth for the foreign-born population - Morocco (%)
Place of birth for the foreign-born population - Sudan (%)
Place of birth for the foreign-born population - Other Northern Africa (%)
Place of birth for the foreign-born population - South Africa (%)
Place of birth for the foreign-born population - Other Southern Africa (%)
Place of birth for the foreign-born population - Cabo Verde (%)
Place of birth for the foreign-born population - Ghana (%)
Place of birth for the foreign-born population - Liberia (%)
Place of birth for the foreign-born population - Nigeria (%)
Place of birth for the foreign-born population - Senegal (%)
Place of birth for the foreign-born population - Sierra Leone (%)
Place of birth for the foreign-born population - Other Western Africa (%)
Place of birth for the foreign-born population - Australia (%)
Place of birth for the foreign-born population - New Zealand (%)
Place of birth for the foreign-born population - Fiji (%)
Place of birth for the foreign-born population - Micronesia (%)
Place of birth for the foreign-born population - Bahamas (%)
Place of birth for the foreign-born population - Barbados (%)
Place of birth for the foreign-born population - Cuba (%)
Place of birth for the foreign-born population - Dominica (%)
Place of birth for the foreign-born population - Dominican Republic (%)
Place of birth for the foreign-born population - Grenada (%)
Place of birth for the foreign-born population - Haiti (%)
Place of birth for the foreign-born population - Jamaica (%)
Place of birth for the foreign-born population - St. Vincent and the Grenadines (%)
Place of birth for the foreign-born population - Trinidad and Tobago (%)
Place of birth for the foreign-born population - West Indies (%)
Place of birth for the foreign-born population - Other Caribbean (%)
Place of birth for the foreign-born population - Belize (%)
Place of birth for the foreign-born population - Costa Rica (%)
Place of birth for the foreign-born population - El Salvador (%)
Place of birth for the foreign-born population - Guatemala (%)
Place of birth for the foreign-born population - Honduras (%)
Place of birth for the foreign-born population - Mexico (%)
Place of birth for the foreign-born population - Nicaragua (%)
Place of birth for the foreign-born population - Panama (%)
Place of birth for the foreign-born population - Other Central America (%)
Place of birth for the foreign-born population - Argentina (%)
Place of birth for the foreign-born population - Bolivia (%)
Place of birth for the foreign-born population - Brazil (%)
Place of birth for the foreign-born population - Chile (%)
Place of birth for the foreign-born population - Colombia (%)
Place of birth for the foreign-born population - Ecuador (%)
Place of birth for the foreign-born population - Guyana (%)
Place of birth for the foreign-born population - Peru (%)
Place of birth for the foreign-born population - Uruguay (%)
Place of birth for the foreign-born population - Venezuela (%)
Place of birth for the foreign-born population - Other South America (%)
Place of birth for the foreign-born population - Canada (%)
Place of birth for the foreign-born population - Other Northern America (%)
Place of birth for the foreign-born population - Other (%)
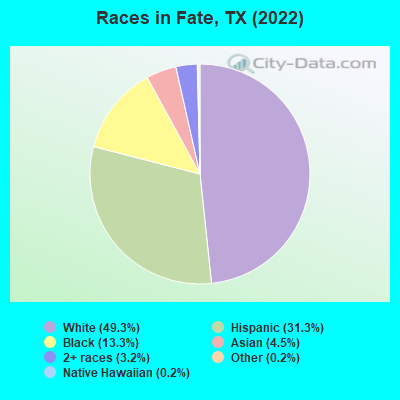
According to 2022 data, the most numerous races in Fate, TX are Hispanic (6,617 residents), White alone (10,427 residents), and Black alone (2,806 residents). 79.1% of Fate residents speak English at home.
Race distribution in Fate
2000 2022
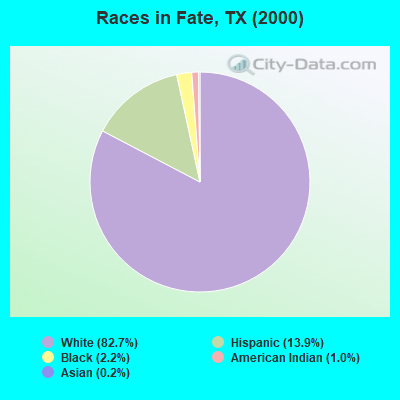
10,933,313 52.4% White alone 6,669,666 32.0% Hispanic 2,364,255 11.3% Black alone 554,445 2.7% Asian alone 230,567 1.1% Two or more races 68,859 0.3% American Indian alone 19,958 0.10% Other race alone 10,757 0.05% Native Hawaiian and Other
12,070,642 40.2% Hispanic 11,683,430 38.9% White alone 3,508,706 11.7% Black alone 1,608,173 5.4% Asian alone 956,560 3.2% Two or more races 125,763 0.4% Other race alone 47,023 0.2% American Indian alone 29,275 0.10% Native Hawaiian and Other
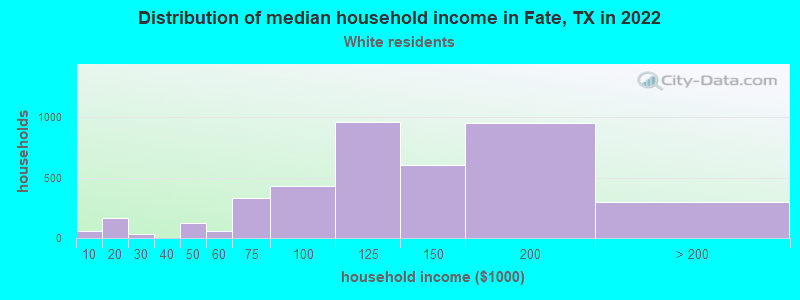
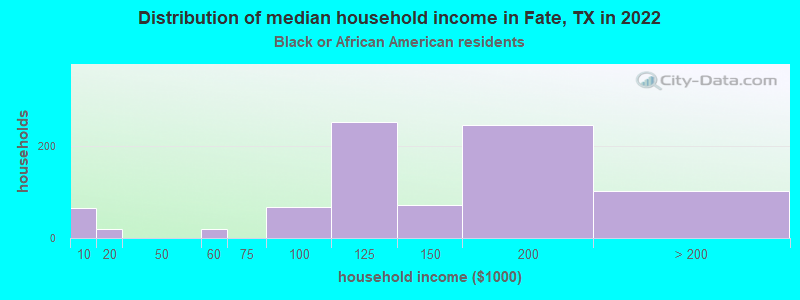
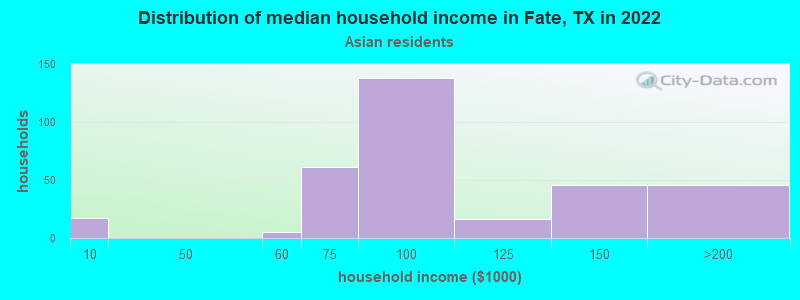
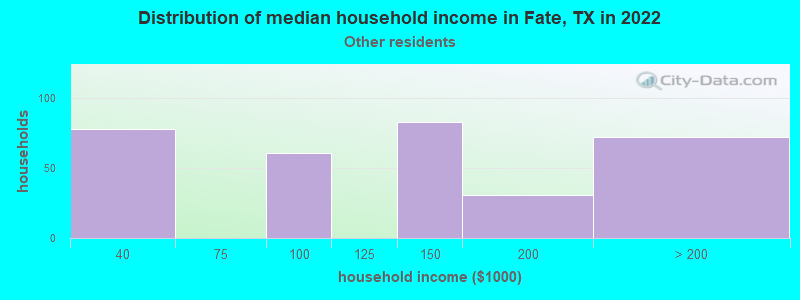
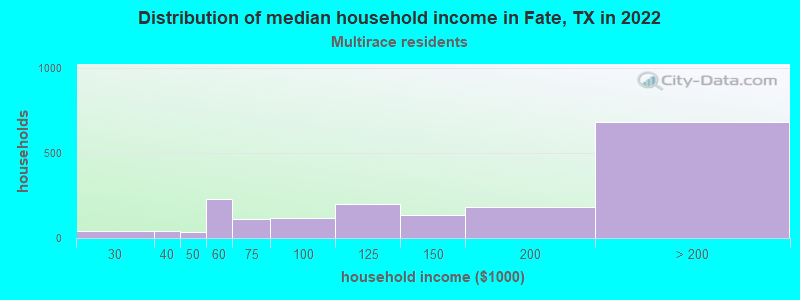
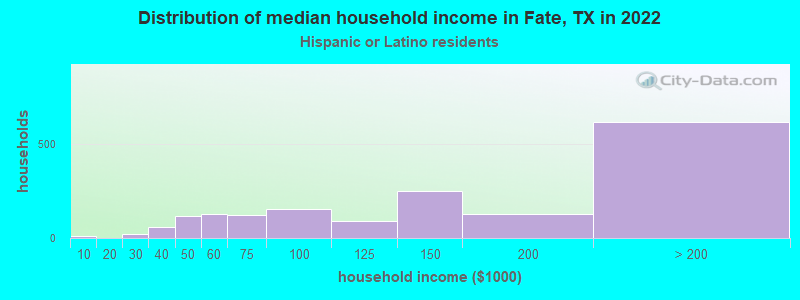
Income and house value in Fate Median household income in 2022 $119,449 White non-Hispanic householders$156,301 Black householders$103,721 Asian householders$129,162 Some other race householders$137,269 Two or more races householders$132,265 Hispanic or Latino race householdersMedian 2022 house value $375,303 White Non-Hispanic householders$228,809 Black or African American householders$298,568 Hispanic or Latino householders
Median age by race in Fate
32.8 Median age for White residents31.3 33.6 45.8 Median age for Black or African American residents42.7 45.7 70.0 Median age for American Indian / Alaska Native residents110.7 57.9 46.1 Median age for Asian residents32.8 56.0 8.4 Median age for Native Hawaiian / Pacific Islander residents48.7 -577,777,777.2 41.7 Median age for Other race residents38.8 38.8 24.9 Median age for Two or more races residents24.7 29.4 35.2 Median age for White alone residents34.6 36.5 24.8 Median age for Hispanic or Latino residents21.5 29.5
Owner/renter occupied households by race in Fate
House owners and renters - White residents 3,474 88.7% Owner occupied444 11.3% Renter occupiedHouse owners and renters - Black or African American residents 778 95.8% Owner occupied35 4.2% Renter occupiedHouse owners and renters - Asian residents 417 100.0% Owner occupiedHouse owners and renters - Other race residents 290 93.6% Owner occupied20 6.4% Renter occupiedHouse owners and renters - Two or more races residents 1,178 80.4% Owner occupied287 19.6% Renter occupiedHouse owners and renters - White alone residents 3,127 90.5% Owner occupied329 9.5% Renter occupiedHouse owners and renters - Hispanic or Latino residents 1,473 88.8% Owner occupied187 11.2% Renter occupied
Language usage in Fate
English speakers - Total 79.1% of residents of Fate speak English at home.
15.2% of residents speak Spanish at home 2,291 75.5% Speak English very well744 24.5% Speak English less than very well5.7% of residents speak other language at home 834 73.5% Speak English very well301 26.5% Speak English less than very well
English speakers - Born in the United States 88.8% of residents of Fate speak English at home.
8.7% of residents speak Spanish at home 607 100.0% Speak English very well4.3% of residents speak other language at home 300 100.0% Speak English very well
English speakers - Native, born elsewhere 22.6% of residents of Fate speak English at home.
77.4% of residents speak Spanish at home 322 83.4% Speak English very well64 16.6% Speak English less than very well
English speakers - Foreign-born 29.8% of residents of Fate speak English at home.
34.7% of residents speak Spanish at home 466 51.0% Speak English very well447 49.0% Speak English less than very well31.0% of residents speak other language at home 512 62.8% Speak English very well303 37.2% Speak English less than very well
White (Caucasian) - Speak only English Native:
92.7% (10,007)Foreign-born:
57.2% (219)
White (Caucasian) - Speak another language Native:
7.4% (801)Foreign-born:
51.0% (196)
Black or African American - Speak only English Native:
100.0% (1,694)Foreign-born:
74.1% (295)
Asian - Speak only English Native:
38.7% (161)Foreign-born:
24.7% (137)
Asian - Speak another language Native:
55.4% (231)Foreign-born:
74.4% (412)
Other race - Speak only English Native:
16.5% (121)Foreign-born:
3.8% (14)
Other race - Speak another language Native:
82.3% (606)Foreign-born:
96.0% (360)
Two or more races - Speak only English Native:
76.8% (3,255)Foreign-born:
6.4% (56)
Two or more races - Speak another language Native:
22.9% (969)Foreign-born:
95.1% (822)
White alone - Speak only English Native:
97.9% (9,276)Foreign-born:
75.2% (237)
White alone - Speak another language Native:
2.1% (197)Foreign-born:
26.9% (85)
Hispanic or Latino - Speak only English Native:
60.4% (3,141)Foreign-born:
6.7% (70)
Hispanic or Latino - Speak another language Native:
39.6% (2,057)Foreign-born:
91.7% (965)
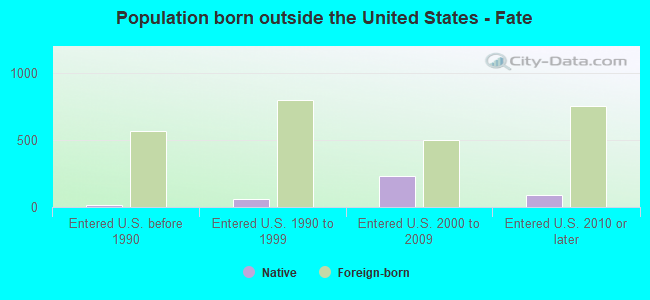
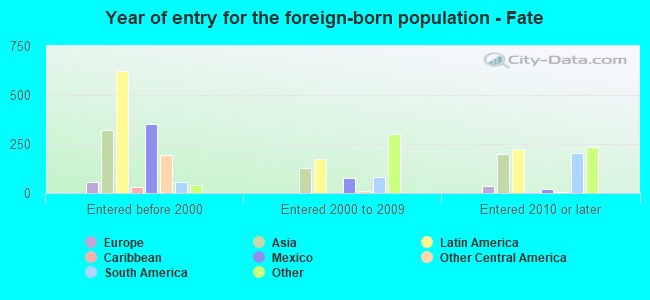
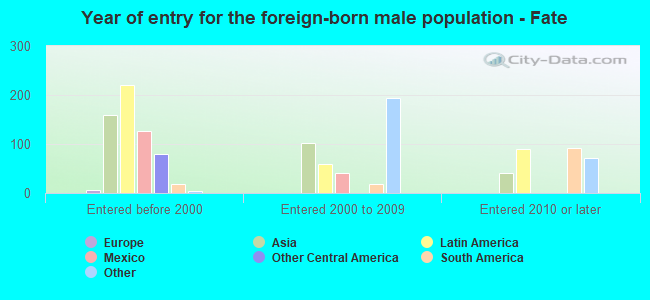
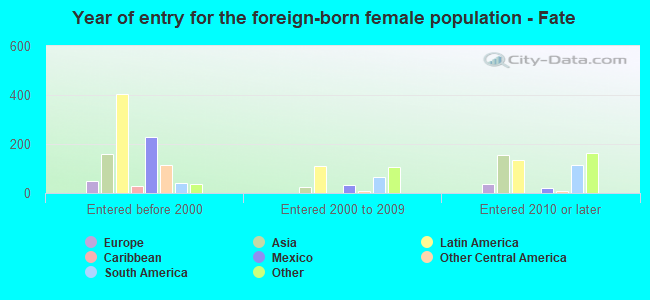
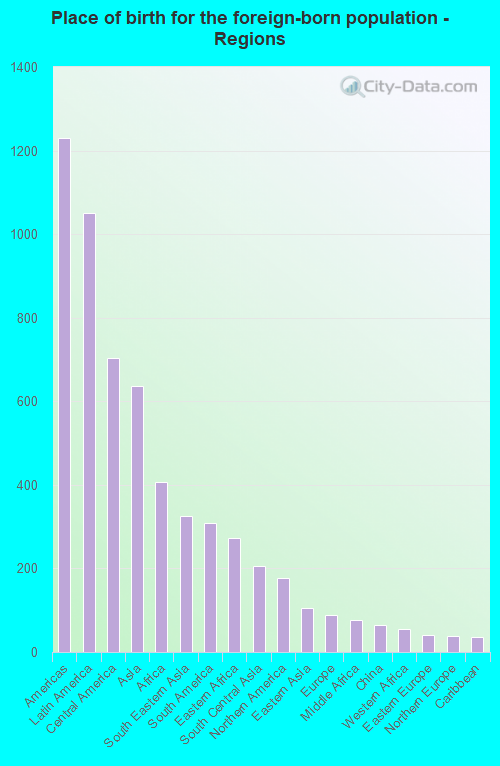
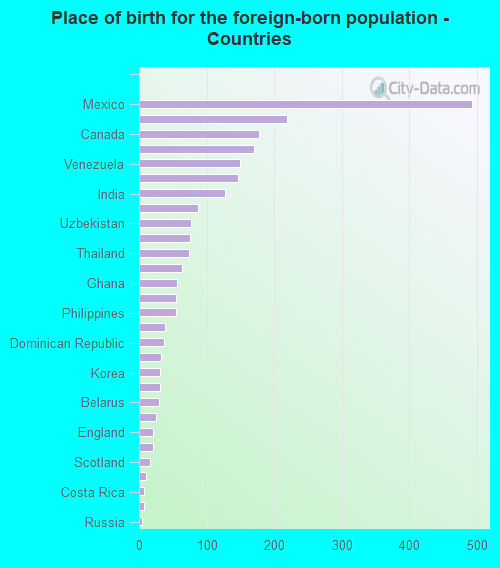
Foreign-born residents in Fate
Marital status for residents in Fate Marital status - White (Caucasian) population 15 years and over
Males 22.6% Never married68.6% Now married0.8% Separated0.6% Widowed7.3% DivorcedFemales 13.3% Never married70.9% Now married1.5% Separated5.7% Widowed8.7% DivorcedWomen who gave birth in the past 12 months Now married:
100.0% (142)Unmarried:
0.0% (0)
Women who did not give birth in the past 12 months Now married:
72.8% (1,988)Unmarried:
27.2% (742)
Marital status - Black or African American population 15 years and over
Males 30.3% Never married67.8% Now married0.0% Separated0.0% Widowed2.0% DivorcedFemales 11.1% Never married78.7% Now married0.0% Separated5.1% Widowed5.0% DivorcedWomen who gave birth in the past 12 months Now married:
100.0% (11)Unmarried:
0.0% (0)
Women who did not give birth in the past 12 months Now married:
79.0% (625)Unmarried:
21.0% (166)
Marital status - American Indian / Alaska Native population 15 years and over
Males 0.0% Never married100.0% Now married0.0% Separated0.0% Widowed0.0% DivorcedFemales 0.0% Never married100.0% Now married0.0% Separated0.0% Widowed0.0% DivorcedMarital status - Asian population 15 years and over
Males 31.1% Never married68.9% Now married0.0% Separated0.0% Widowed0.0% DivorcedFemales 0.0% Never married58.3% Now married0.0% Separated22.9% Widowed18.8% DivorcedWomen who did not give birth in the past 12 months Now married:
80.8% (63)Unmarried:
19.2% (15)
Marital status - Other race population 15 years and over
Males 15.7% Never married72.0% Now married0.0% Separated12.3% Widowed0.0% DivorcedFemales 15.3% Never married60.8% Now married0.0% Separated0.6% Widowed23.3% DivorcedWomen who did not give birth in the past 12 months Now married:
63.2% (260)Unmarried:
36.8% (151)
Marital status - Two or more races population 15 years and over
Males 47.2% Never married50.6% Now married0.0% Separated0.0% Widowed2.2% DivorcedFemales 52.2% Never married36.1% Now married1.6% Separated3.5% Widowed6.6% DivorcedWomen who gave birth in the past 12 months Now married:
31.6% (9)Unmarried:
68.4% (19)
Women who did not give birth in the past 12 months Now married:
27.1% (279)Unmarried:
72.9% (752)
Marital status - White alone, not Hispanic / Latino population 15 years and over
Males 20.7% Never married69.9% Now married0.9% Separated0.7% Widowed7.8% DivorcedFemales 12.7% Never married72.7% Now married0.1% Separated6.0% Widowed8.6% DivorcedWomen who gave birth in the past 12 months Now married:
100.0% (122)Unmarried:
0.0% (0)
Women who did not give birth in the past 12 months Now married:
73.6% (1,746)Unmarried:
26.4% (625)
Marital status - Hispanic or Latino population 15 years and over
Males 40.4% Never married55.4% Now married0.0% Separated1.8% Widowed2.4% DivorcedFemales 34.3% Never married51.2% Now married4.3% Separated2.7% Widowed7.6% DivorcedWomen who gave birth in the past 12 months Now married:
100.0% (36)Unmarried:
0.0% (0)
Women who did not give birth in the past 12 months Now married:
48.7% (796)Unmarried:
51.3% (838)
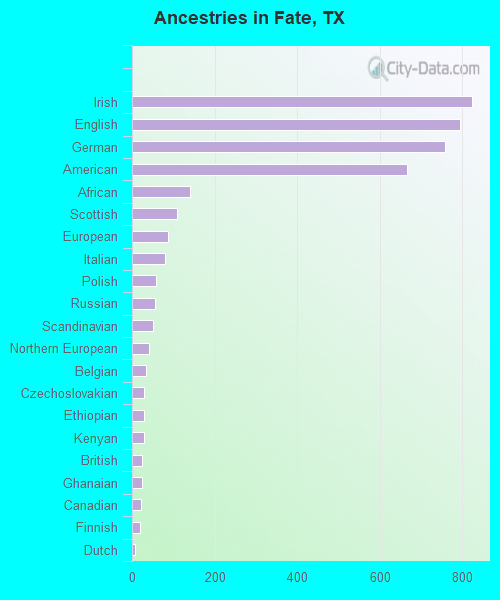
Ancestries in Fate
824 8.7% Irish795 8.4% English759 8.0% German666 7.0% American141 1.5% African108 1.1% Scottish88 0.9% European79 0.8% Italian58 0.6% Polish56 0.6% Russian52 0.5% Scandinavian42 0.4% Northern European34 0.4% Belgian30 0.3% Czechoslovakian30 0.3% Ethiopian28 0.3% Kenyan24 0.3% British24 0.3% Ghanaian23 0.2% Canadian20 0.2% Finnish8 0.08% Dutch5 0.05% Norwegian
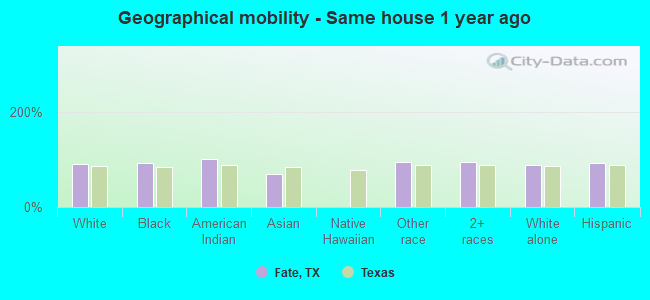
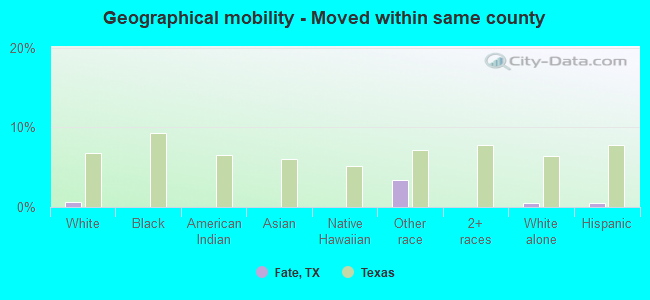
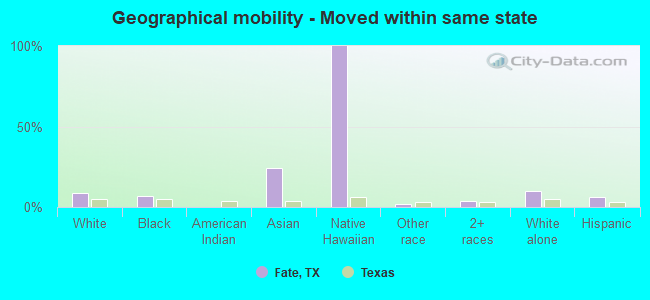
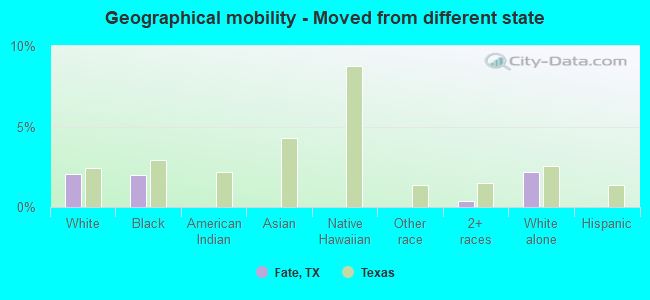
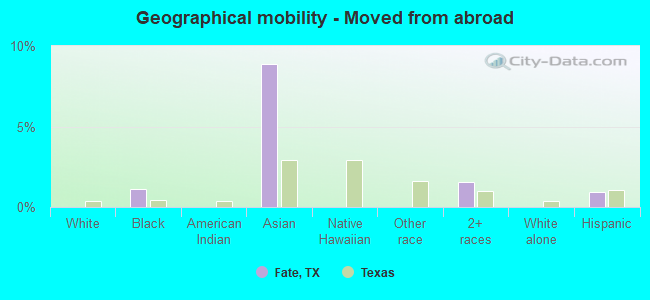
Geographical mobility in Fate Same house 1 year ago 10,650 90.0% White (Caucasian)2,091 91.6% Black or African American51 100.0% American Indian / Alaska Native594 69.3% Asian1,082 94.1% Other race5,162 93.9% Two or more races9,127 88.8% White alone, not Hispanic / Latino5,234 92.5% Hispanic or LatinoMoved within same county 79 0.7% White / Caucasian39 3.4% Other race46 0.5% White alone, not Hispanic / Latino31 0.5% Hispanic or LatinoMoved within same state 1,066 9.0% White / Caucasian150 6.6% Black or African American209 24.3% Asian63 100.0% Native Hawaiian / Pacific Islander27 2.4% Other race240 4.4% Two or more races1,033 10.1% White alone, not Hispanic / Latino353 6.2% Hispanic or LatinoMoved from different state 242 2.0% White / Caucasian45 2.0% Black or African American21 0.4% Two or more races220 2.1% White alone, not Hispanic / LatinoMoved from abroad 25 1.1% Black or African American76 8.9% Asian86 1.6% Two or more races51 0.9% Hispanic or Latino
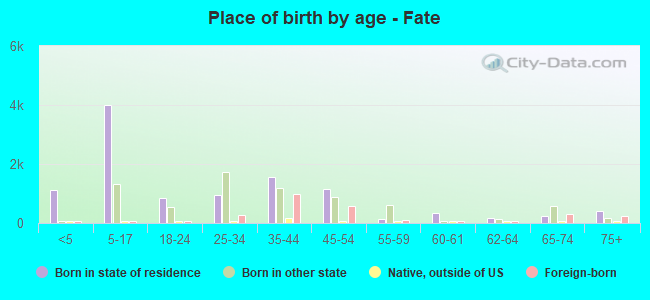
Children Nativity (place of birth) in Fate
Children under 6 years - Living with two parents Both parents native 833 100.0% NativeBoth parents foreign-born 195 100.0% NativeOne native, one foreign-born parent 169 100.0% NativeChildren under 6 years - Living with one parent Native parent 265 100.0% NativeChildren 6 to 17 years - Living with two parents Both parents native 2,826 100.0% Native0 0.0% Foreign-bornBoth parents foreign-born 564 94.9% Native30 5.1% Foreign-bornOne native, one foreign-born parent 423 100.0% NativeChildren 6 to 17 years - Living with one parent Native parent 745 100.0% NativeForeign-born parent 63 51.7% Native59 48.3% Foreign-born
Grandparents responsible for own grandchildren in Fate
Grandparents (30 to 59 years) White / Caucasian 33 29.5% Responsible for grandchildren79 70.5% Not responsible for grandchildrenBlack or African American 11 100.0% Not responsible for grandchildrenNative Hawaiian / Pacific Islander 18 100.0% Responsible for grandchildrenTwo or more races 17 100.0% Not responsible for grandchildrenWhite alone, not Hispanic / Latino 124 100.0% Not responsible for grandchildrenHispanic or Latino 50 100.0% Responsible for grandchildrenGrandparents (60 years and over) White / Caucasian 47 41.7% Responsible for grandchildren66 58.3% Not responsible for grandchildrenBlack or African American 20 33.1% Responsible for grandchildren40 66.9% Not responsible for grandchildrenTwo or more races 47 100.0% Not responsible for grandchildrenWhite alone, not Hispanic / Latino 56 38.2% Responsible for grandchildren90 61.8% Not responsible for grandchildrenHispanic or Latino 61 100.0% Not responsible for grandchildren