Races in Fairview, New York (NY) Detailed Stats
Ancestries, Foreign-born residents, place of birth
Settings
X


Recent posts about races in Fairview, New York on our local forum with over 2,400,000 registered users:
 | Upper Middle class african-american communities in ny (2055 replies) |
| Just how hot is the Rochester market? Check out these stats (81 replies) |
| Beach towns... (2 replies) |
| Opinions and Feedback on these School Districts Please (38 replies) |
| Considering move to Ithaca. Looks good on paper, what do you think? (34 replies) |
| Huntington Station area by the village advice? (7 replies) |
Latest news about races in Fairview, NY collected exclusively by city-data.com from local newspapers, TV, and radio stations
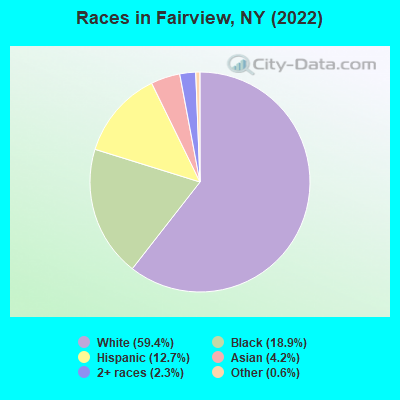
According to 2022 data, the most numerous races in Fairview, NY are White alone (3,992 residents), Hispanic (854 residents), and Black alone (1,274 residents). 84.9% of Fairview residents speak English at home. 15.3% of Fairview, NY residents are foreign-born (9.6% born in Latin America, 4.3% born in Asia), which is 44.1% less than the foreign-born rate of 22.0% across the entire state of New York.
Race distribution in Fairview
2000
2022

- 4,27178.8%White alone
- 59811.0%Black alone
- 2805.2%Hispanic
- 1252.3%Two or more races
- 1212.2%Asian alone
- 130.2%Other race alone
- 110.2%American Indian alone
- 20.04%Native Hawaiian and Other
Pacific Islander alone

-
- 3,99259.4%White alone
- 1,27418.9%Black alone
- 85412.7%Hispanic
- 2814.2%Asian alone
- 1542.3%Two or more races
- 380.6%Other race alone
2000
2022
-
- 11,760,98162.0%White alone
- 2,867,58315.1%Hispanic
- 2,812,62314.8%Black alone
- 1,035,9265.5%Asian alone
- 366,1161.9%Two or more races
- 75,4990.4%Other race alone
- 52,4990.3%American Indian alone
- 5,2300.03%Native Hawaiian and Other
Pacific Islander alone

-
- 10,408,93352.9%White alone
- 3,867,29919.7%Hispanic
- 2,633,84013.4%Black alone
- 1,776,2869.0%Asian alone
- 732,6703.7%Two or more races
- 216,1101.1%Other race alone
- 35,0820.2%American Indian alone
- 6,9310.04%Native Hawaiian and Other
Pacific Islander alone

Income and house value in Fairview
- Median household income in 2022
- $90,563White non-Hispanic householders
- $86,917Black householders
- $70,631Two or more races householders
- Median 2022 house value
- $271,535White Non-Hispanic householders
- $373,715Black or African American householders
- $900,828American Indian or Alaska Native householders
- $289,552Some other race householders
- $345,918Two or more races householders
- $302,935Hispanic or Latino householders
Household income for White non-Hispanic householders

Household income for Black householders

Household income for Asian householders

Household income for Some other race householders

Household income for Two or more races householders

Household income for Hispanic or Latino race householders

Median age by race in Fairview
- 32.3Median age for White residents
- 28.5Males
- 36.4Females
- 35.0Median age for Black or African American residents
- 34.4Males
- 33.7Females
- -815,273,477.0Median age for American Indian / Alaska Native residents
- -796,352,582.8Males
- -969,474,968.5Females
- 23.8Median age for Asian residents
- 20.9Males
- 52.9Females
- -663,333,332.7Median age for Native Hawaiian / Pacific Islander residents
- -477,502,295.2Males
- -497,387,669.3Females
- 20.4Median age for Other race residents
- 18.0Males
- 34.5Females
- 24.6Median age for Two or more races residents
- 25.0Males
- 22.4Females
- 32.1Median age for White alone residents
- 28.6Males
- 35.4Females
- 22.5Median age for Hispanic or Latino residents
- 22.0Males
- 33.3Females
Owner/renter occupied households by race in Fairview
- House owners and renters - White residents
- 1,10674.3%Owner occupied
- 38325.7%Renter occupied
- House owners and renters - Black or African American residents
- 20348.9%Owner occupied
- 21251.1%Renter occupied
- House owners and renters - Asian residents
- 38100.0%Owner occupied
- House owners and renters - Other race residents
- 4042.6%Owner occupied
- 5457.4%Renter occupied
- House owners and renters - Two or more races residents
- 12673.1%Owner occupied
- 4626.9%Renter occupied
- House owners and renters - White alone residents
- 1,08373.7%Owner occupied
- 38726.3%Renter occupied
- House owners and renters - Hispanic or Latino residents
- 15663.0%Owner occupied
- 9237.0%Renter occupied
Language usage in Fairview
- English speakers - Total
- 84.9% of residents of Fairview speak English at home.
- 8.8% of residents speak Spanish at home
- 42776.0%Speak English very well
- 13524.0%Speak English less than very well
- 6.3% of residents speak other language at home
- 25965.1%Speak English very well
- 13934.9%Speak English less than very well
- English speakers - Born in the United States
- 90.2% of residents of Fairview speak English at home.
- 5.9% of residents speak Spanish at home
- 68100.0%Speak English very well
- 2.9% of residents speak other language at home
- 34100.0%Speak English very well
- English speakers - Native, born elsewhere
- 85.1% of residents of Fairview speak English at home.
- 46.8% of residents speak other language at home
- 22100.0%Speak English very well
- English speakers - Foreign-born
- 45.9% of residents of Fairview speak English at home.
- 29.2% of residents speak Spanish at home
- 22066.5%Speak English very well
- 11133.5%Speak English less than very well
- 25.1% of residents speak other language at home
- 13146.1%Speak English very well
- 15353.9%Speak English less than very well
White (Caucasian) - Speak only English
| Native: | 98.0% (3,701) |
| Foreign-born: | 25.8% (51) |
White (Caucasian) - Speak another language
| Native: | 2.4% (92) |
| Foreign-born: | 74.7% (149) |
Black or African American - Speak only English
| Native: | 93.3% (632) |
| Foreign-born: | 90.7% (530) |
Black or African American - Speak another language
| Native: | 7.2% (49) |
| Foreign-born: | 8.5% (49) |
Asian - Speak only English
| Native: | 72.3% (112) |
| Foreign-born: | 13.2% (15) |
Asian - Speak another language
| Native: | 30.6% (47) |
| Foreign-born: | 85.1% (96) |
Other race - Speak another language
| Native: | 92.1% (194) |
| Foreign-born: | 90.7% (235) |
White alone - Speak only English
| Native: | 98.0% (3,660) |
| Foreign-born: | 31.3% (51) |
White alone - Speak another language
| Native: | 2.1% (79) |
| Foreign-born: | 70.1% (114) |
Hispanic or Latino - Speak only English
| Native: | 54.0% (225) |
| Foreign-born: | 0.4% (1) |
Hispanic or Latino - Speak another language
| Native: | 46.0% (192) |
| Foreign-born: | 100.0% (363) |
Foreign-born residents in Fairview
1,027 residents are foreign born (9.6% Latin America, 4.3% Asia).
| This city: | 15.3% |
| New York: | 22.6% |


Marital status for residents in Fairview
Marital status - White (Caucasian) population 15 years and over
- Males
- 57.4%Never married
- 37.8%Now married
- 0.0%Separated
- 0.4%Widowed
- 4.5%Divorced
- Females
- 47.1%Never married
- 38.9%Now married
- 1.1%Separated
- 5.5%Widowed
- 7.4%Divorced
Women who gave birth in the past 12 months
| Now married: | 0.0% (0) |
| Unmarried: | 100.0% (27) |
Women who did not give birth in the past 12 months
| Now married: | 32.0% (374) |
| Unmarried: | 68.0% (793) |
Marital status - Black or African American population 15 years and over
- Males
- 23.7%Never married
- 68.3%Now married
- 2.0%Separated
- 0.0%Widowed
- 6.0%Divorced
- Females
- 21.6%Never married
- 72.0%Now married
- 0.0%Separated
- 0.6%Widowed
- 5.9%Divorced
Women who did not give birth in the past 12 months
| Now married: | 81.1% (247) |
| Unmarried: | 18.9% (57) |
Marital status - Asian population 15 years and over
- Males
- 80.7%Never married
- 19.3%Now married
- 0.0%Separated
- 0.0%Widowed
- 0.0%Divorced
- Females
- 11.6%Never married
- 88.4%Now married
- 0.0%Separated
- 0.0%Widowed
- 0.0%Divorced
Women who did not give birth in the past 12 months
| Now married: | 73.0% (27) |
| Unmarried: | 27.0% (10) |
Marital status - Other race population 15 years and over
- Males
- 81.6%Never married
- 18.4%Now married
- 0.0%Separated
- 0.0%Widowed
- 0.0%Divorced
- Females
- 47.7%Never married
- 52.3%Now married
- 0.0%Separated
- 0.0%Widowed
- 0.0%Divorced
Women who did not give birth in the past 12 months
| Now married: | 41.8% (62) |
| Unmarried: | 58.2% (86) |
Marital status - Two or more races population 15 years and over
- Males
- 29.3%Never married
- 70.1%Now married
- 0.0%Separated
- 0.6%Widowed
- 0.0%Divorced
- Females
- 29.2%Never married
- 70.8%Now married
- 0.0%Separated
- 0.0%Widowed
- 0.0%Divorced
Women who did not give birth in the past 12 months
| Now married: | 70.8% (67) |
| Unmarried: | 29.2% (28) |
Marital status - White alone, not Hispanic / Latino population 15 years and over
- Males
- 57.6%Never married
- 37.6%Now married
- 0.0%Separated
- 0.4%Widowed
- 4.4%Divorced
- Females
- 46.8%Never married
- 38.8%Now married
- 1.1%Separated
- 5.8%Widowed
- 7.5%Divorced
Women who gave birth in the past 12 months
| Now married: | 0.0% (0) |
| Unmarried: | 100.0% (28) |
Women who did not give birth in the past 12 months
| Now married: | 33.7% (384) |
| Unmarried: | 66.3% (756) |
Marital status - Hispanic or Latino population 15 years and over
- Males
- 47.9%Never married
- 51.5%Now married
- 0.0%Separated
- 0.0%Widowed
- 0.7%Divorced
- Females
- 51.6%Never married
- 45.8%Now married
- 0.0%Separated
- 0.0%Widowed
- 2.5%Divorced
Women who did not give birth in the past 12 months
| Now married: | 25.1% (54) |
| Unmarried: | 74.9% (160) |
Ancestries in Fairview

- 46615.2%Italian
- 32210.5%Jamaican
- 2839.3%Irish
- 2297.5%American
- 1103.6%Guyanese
- 1043.4%German
- 662.2%Polish
- 331.1%Portuguese
- 210.7%Brazilian
- 160.5%Norwegian
- 150.5%Scottish
- 110.4%Eastern European
- 110.4%African
- 80.3%Ugandan
- 70.2%Greek

Geographical mobility in Fairview

- Same house 1 year ago
- 3,14177.2%White (Caucasian)
- 1,12493.1%Black or African American
- 18967.2%Asian
- 589100.0%Other race
- 35689.9%Two or more races
- 3,05576.7%White alone, not Hispanic / Latino
- 72985.5%Hispanic or Latino

-
- Moved within same county
- 2145.3%White / Caucasian
- 12110.0%Black or African American
- 132.3%Other race
- 287.0%Two or more races
- 2285.7%White alone, not Hispanic / Latino
- 728.5%Hispanic or Latino

-
- Moved within same state
- 41310.2%White / Caucasian
- 151.2%Black or African American
- 3909.8%White alone, not Hispanic / Latino
- 172.0%Hispanic or Latino

-
- Moved from different state
- 3689.1%White / Caucasian
- 20874.3%Asian
- 3558.9%White alone, not Hispanic / Latino

Children Nativity (place of birth) in Fairview
Place of birth for residents in Fairview
![Place of birth for the foreign-born population - Regions]()
- 635Americas
- 635Latin America
- 286Asia
- 217Central America
- 209Caribbean
- 208South America
- 111Eastern Asia
- 90Europe
- 84South Eastern Asia
- 77Southern Europe
- 64Western Asia
- 26South Central Asia
- 13Eastern Europe
- 13Africa
- 11Western Africa
- 1Eastern Africa

![Place of birth for the foreign-born population - Countries]()
- 187Mexico
- 177Jamaica
- 111Japan
- 90Guyana
- 60Jordan
- 53Argentina
- 48Vietnam
- 39Italy
- 39Colombia
- 37Portugal
- 35Philippines
- 32Dominican Republic
- 29Honduras
- 26India
- 22Brazil
- 13Poland
- 11Liberia
- 3Israel
- 1Uganda
- 1Ecuador

Grandparents responsible for own grandchildren in Fairview
Zip codes: 12538.