Races in Fairfield, Vermont (VT) Detailed Stats
Ancestries, Foreign-born residents, place of birth

Recent posts about races in Fairfield, Vermont on our local forum with over 2,400,000 registered users:
 | What I love about living in Vermont (52 replies) |
| Looking to move to top part of vermont (7 replies) |
| Slamming VT (82 replies) |
| The One Millionth Vermont Relocation Post!! HELP! (71 replies) |
| Does Vermont want another out-of-stater? (129 replies) |
| Should I move from Maine to Manchester, VT? (27 replies) |
2.8% of Fairfield, VT residents are foreign-born (1.8% born in North America, 0.9% born in Europe), which is 41.2% less than the foreign-born rate of 4.0% across the entire state of Vermont.
Race distribution in Fairfield

- 1,72996.1%White alone
- 261.4%Two or more races
- 231.3%Hispanic
- 160.9%American Indian alone
- 30.2%Native Hawaiian and Other
Pacific Islander alone - 20.1%Asian alone
- 10.06%Other race alone

2000
2022
-
- 585,43196.2%White alone
- 6,8091.1%Two or more races
- 5,5040.9%Hispanic
- 5,1600.8%Asian alone
- 2,9210.5%Black alone
- 2,3250.4%American Indian alone
- 5570.09%Other race alone
- 1200.02%Native Hawaiian and Other
Pacific Islander alone

-
- 583,54690.2%White alone
- 27,3404.2%Two or more races
- 14,7702.3%Hispanic
- 11,5121.8%Asian alone
- 6,2641.0%Black alone
- 2,5210.4%Other race alone
- 1,0520.2%American Indian alone
- 590.01%Native Hawaiian and Other
Pacific Islander alone

Income and house value in Fairfield
- Median household income in 2022
- $80,403White non-Hispanic householders
- $115,154American Indian and Alaska Native householders
- $47,460Two or more races householders
- over $200,000Hispanic or Latino race householders
- Median 2022 house value
- $270,243White Non-Hispanic householders
- $380,757Two or more races householders
- $552,569Hispanic or Latino householders
Household income for White non-Hispanic householders

Household income for American Indian and Alaska Native householders

Household income for Two or more races householders

Household income for Hispanic or Latino race householders

Foreign-born residents in Fairfield
51 residents are foreign born (1.8% North America, 0.9% Europe).
| This city: | 2.8% |
| Vermont: | 3.8% |
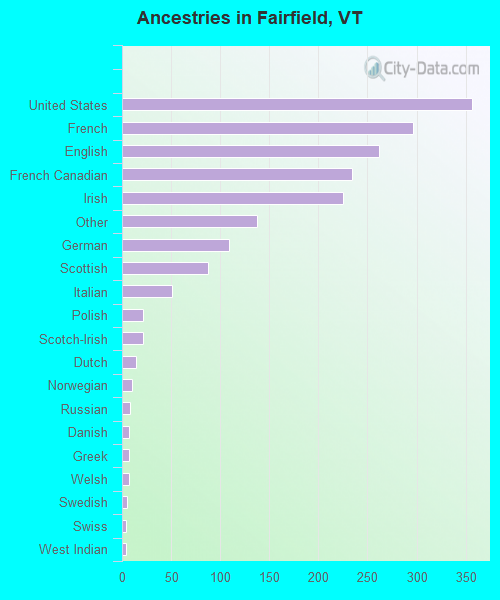
Ancestries in Fairfield

- 35619.0%United States
- 29615.8%French
- 26214.0%English
- 23412.5%French Canadian
- 22512.0%Irish
- 1387.4%Other
- 1095.8%German
- 884.7%Scottish
- 512.7%Italian
- 211.1%Polish
- 211.1%Scotch-Irish
- 140.7%Dutch
- 100.5%Norwegian
- 80.4%Russian
- 70.4%Danish
- 70.4%Greek
- 70.4%Welsh
- 50.3%Swedish
- 40.2%Swiss
- 40.2%West Indian
- 30.2%Hungarian
- 30.2%Lithuanian
Zip codes: 05455.