Races in Emmett Valley, Idaho (ID) Detailed Stats
Ancestries, Foreign-born residents, place of birth
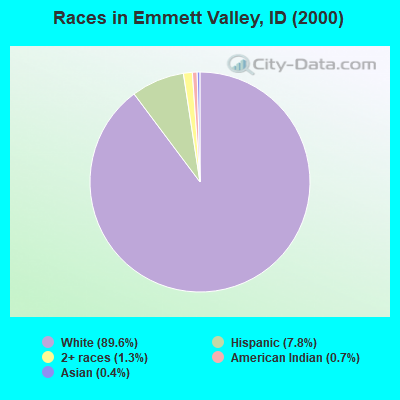
Race distribution in Emmett Valley

- 9,94389.6%White alone
- 8657.8%Hispanic
- 1451.3%Two or more races
- 770.7%American Indian alone
- 470.4%Asian alone
- 100.09%Black alone
- 90.08%Native Hawaiian and Other
Pacific Islander alone - 60.05%Other race alone
2000
2022
-
- 1,139,29188.0%White alone
- 101,6907.9%Hispanic
- 18,2611.4%Two or more races
- 15,7891.2%American Indian alone
- 11,6410.9%Asian alone
- 4,8890.4%Black alone
- 1,1920.09%Other race alone
- 1,2000.09%Native Hawaiian and Other
Pacific Islander alone

-
- 1,531,21979.0%White alone
- 261,92113.5%Hispanic
- 81,1124.2%Two or more races
- 25,1741.3%Asian alone
- 15,8250.8%American Indian alone
- 11,8680.6%Black alone
- 8,7520.5%Other race alone
- 3,1620.2%Native Hawaiian and Other
Pacific Islander alone

Income and house value in Emmett Valley
- Median household income in 2022
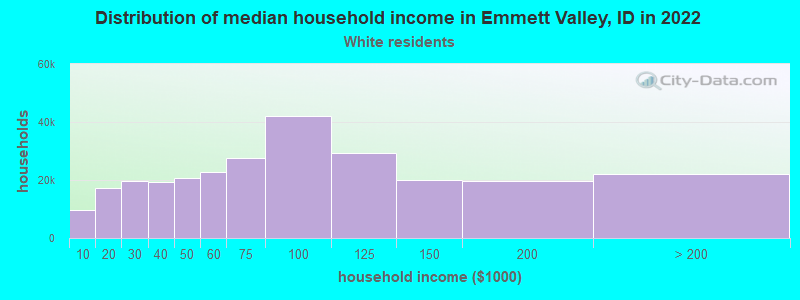
- $64,747White non-Hispanic householders
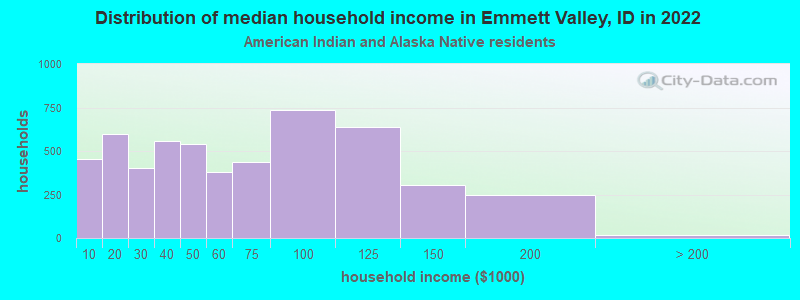
- $72,328American Indian and Alaska Native householders
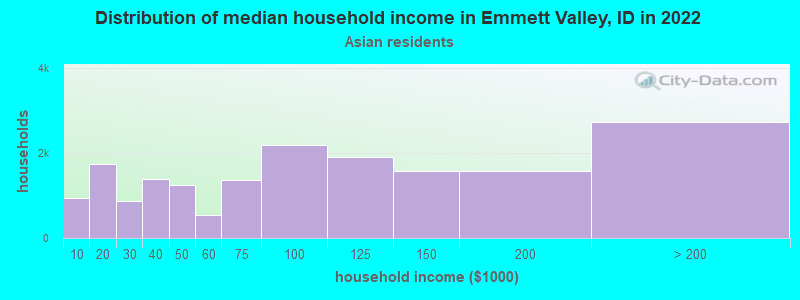
- $181,029Asian householders
- $67,557Some other race householders
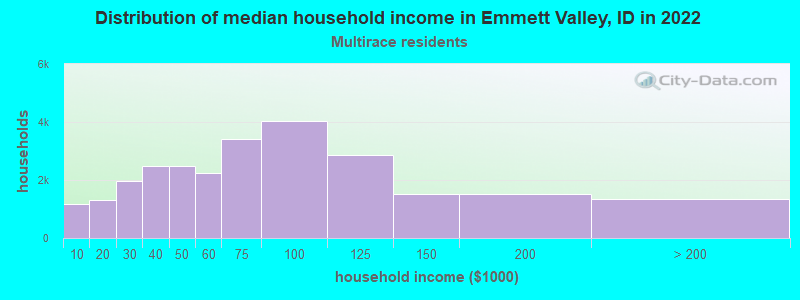
- $68,711Two or more races householders
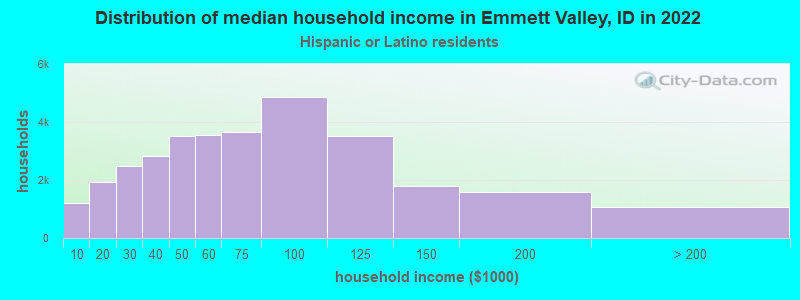
- $58,408Hispanic or Latino race householders
- Median 2022 house value
- $409,454White Non-Hispanic householders
- $308,580American Indian or Alaska Native householders
- $404,347Asian householders
- $394,557Some other race householders
- $321,349Two or more races householders
- $355,825Hispanic or Latino householders
Household income for White non-Hispanic householders
Household income for American Indian and Alaska Native householders
Household income for Asian householders
Household income for Two or more races householders
Household income for Hispanic or Latino race householders
Zip code: 83617