Races in Elon, North Carolina (NC) Detailed Stats
Data:
Races - White alone (%)
Races - White alone (% change since 2000)
Races - Black alone (%)
Races - Black alone (% change since 2000)
Races - American Indian alone (%)
Races - American Indian alone (% change since 2000)
Races - Asian alone (%)
Races - Asian alone (% change since 2000)
Races - Hispanic (%)
Races - Hispanic (% change since 2000)
Races - Native Hawaiian and Other Pacific Islander alone (%)
Races - Native Hawaiian and Other Pacific Islander alone (% change since 2000)
Races - Two or more races(%)
Races - Two or more races(% change since 2000)
Races - Other race alone (%)
Races - Other race alone (% change since 2000)
Racial diversity
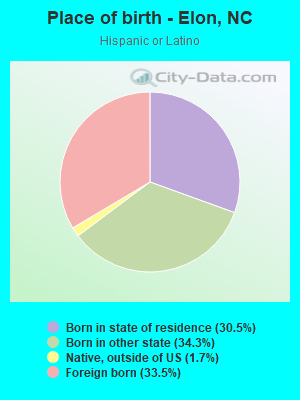
Place of birth - Born in state of residence (%)
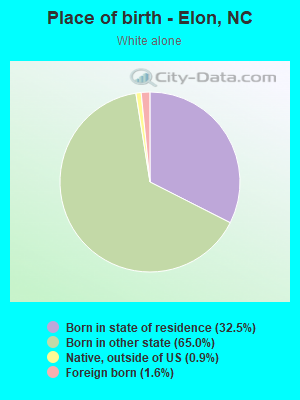
Place of birth - Born in state of residence (%) - White
Place of birth - Born in state of residence (%) - Black or African American
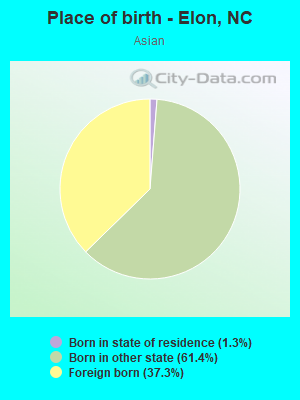
Place of birth - Born in state of residence (%) - Asian
Place of birth - Born in state of residence (%) - Hispanic or Latino
Place of birth - Born in state of residence (%) - American Indian and Alaska Native
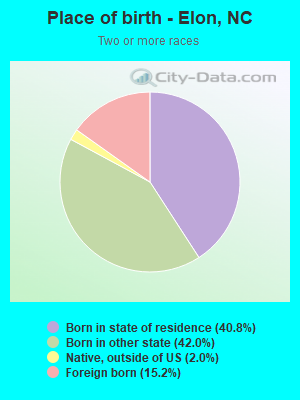
Place of birth - Born in state of residence (%) - Multirace
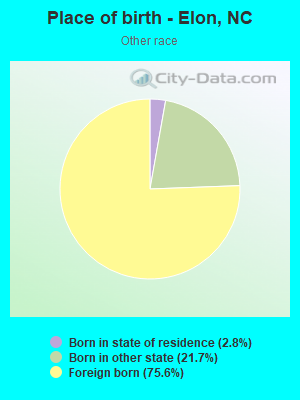
Place of birth - Born in state of residence (%) - Other Race
Place of birth - Born in other state (%)
Place of birth - Born in other state (%) - White
Place of birth - Born in other state (%) - Black or African American
Place of birth - Born in other state (%) - Asian
Place of birth - Born in other state (%) - Hispanic or Latino
Place of birth - Born in other state (%) - American Indian and Alaska Native
Place of birth - Born in other state (%) - Multirace
Place of birth - Born in other state (%) - Other Race
Place of birth - Native, outside of US (%)
Place of birth - Native, outside of US (%) - White
Place of birth - Native, outside of US (%) - Black or African American
Place of birth - Native, outside of US (%) - Asian
Place of birth - Native, outside of US (%) - Hispanic or Latino
Place of birth - Native, outside of US (%) - American Indian and Alaska Native
Place of birth - Native, outside of US (%) - Multirace
Place of birth - Native, outside of US (%) - Other Race
Place of birth - Foreign born (%)
Place of birth - Foreign born (%) - White
Place of birth - Foreign born (%) - Black or African American
Place of birth - Foreign born (%) - Asian
Place of birth - Foreign born (%) - Hispanic or Latino
Place of birth - Foreign born (%) - American Indian and Alaska Native
Place of birth - Foreign born (%) - Multirace
Place of birth - Foreign born (%) - Other Race
Residents speaking English at home (%)
Residents speaking English at home - Born in the United States (%)
Residents speaking English at home - Native, born elsewhere (%)
Residents speaking English at home - Foreign born (%)
Residents speaking Spanish at home (%)
Residents speaking Spanish at home - Born in the United States (%)
Residents speaking Spanish at home - Native, born elsewhere (%)
Residents speaking Spanish at home - Foreign born (%)
Residents speaking other language at home (%)
Residents speaking other language at home - Born in the United States (%)
Residents speaking other language at home - Native, born elsewhere (%)
Residents speaking other language at home - Foreign born (%)
Marital status - Never married (%)
Marital status - Now married (%)
Marital status - Separated (%)
Marital status - Widowed (%)
Marital status - Divorced (%)
Ancestries Reported - Arab (%)
Ancestries Reported - Czech (%)
Ancestries Reported - Danish (%)
Ancestries Reported - Dutch (%)
Ancestries Reported - English (%)
Ancestries Reported - French (%)
Ancestries Reported - French Canadian (%)
Ancestries Reported - German (%)
Ancestries Reported - Greek (%)
Ancestries Reported - Hungarian (%)
Ancestries Reported - Irish (%)
Ancestries Reported - Italian (%)
Ancestries Reported - Lithuanian (%)
Ancestries Reported - Norwegian (%)
Ancestries Reported - Polish (%)
Ancestries Reported - Portuguese (%)
Ancestries Reported - Russian (%)
Ancestries Reported - Scotch-Irish (%)
Ancestries Reported - Scottish (%)
Ancestries Reported - Slovak (%)
Ancestries Reported - Subsaharan African (%)
Ancestries Reported - Swedish (%)
Ancestries Reported - Swiss (%)
Ancestries Reported - Ukrainian (%)
Ancestries Reported - United States (%)
Ancestries Reported - Welsh (%)
Ancestries Reported - West Indian (%)
Ancestries Reported - Other (%)
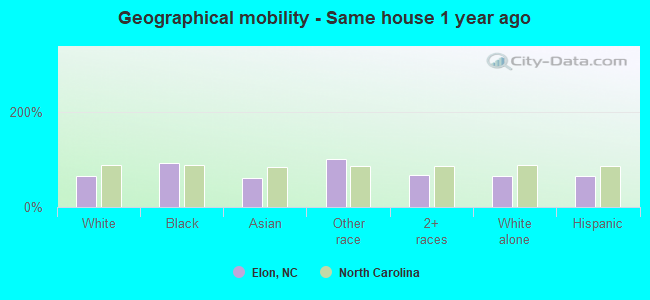
Geographical mobility - Same house 1 year ago (%)
Geographical mobility - Same house 1 year ago (%) - White
Geographical mobility - Same house 1 year ago (%) - Black or African American
Geographical mobility - Same house 1 year ago (%) - Asian
Geographical mobility - Same house 1 year ago (%) - Hispanic or Latino
Geographical mobility - Same house 1 year ago (%) - American Indian and Alaska Native
Geographical mobility - Same house 1 year ago (%) - Multirace
Geographical mobility - Same house 1 year ago (%) - Other Race
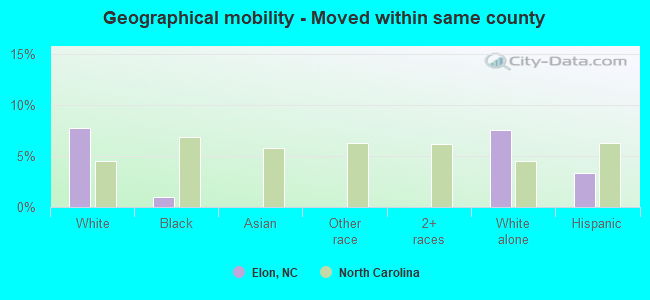
Geographical mobility - Moved within same county (%)
Geographical mobility - Moved within same county (%) - White
Geographical mobility - Moved within same county (%) - Black or African American
Geographical mobility - Moved within same county (%) - Asian
Geographical mobility - Moved within same county (%) - Hispanic or Latino
Geographical mobility - Moved within same county (%) - American Indian and Alaska Native
Geographical mobility - Moved within same county (%) - Multirace
Geographical mobility - Moved within same county (%) - Other Race
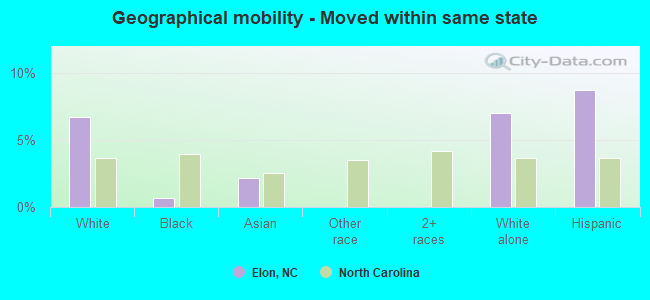
Geographical mobility - Moved from different county within same state (%)
Geographical mobility - Moved from different county within same state (%) - White
Geographical mobility - Moved from different county within same state (%) - Black or African American
Geographical mobility - Moved from different county within same state (%) - Asian
Geographical mobility - Moved from different county within same state (%) - Hispanic or Latino
Geographical mobility - Moved from different county within same state (%) - American Indian and Alaska Native
Geographical mobility - Moved from different county within same state (%) - Multirace
Geographical mobility - Moved from different county within same state (%) - Other Race
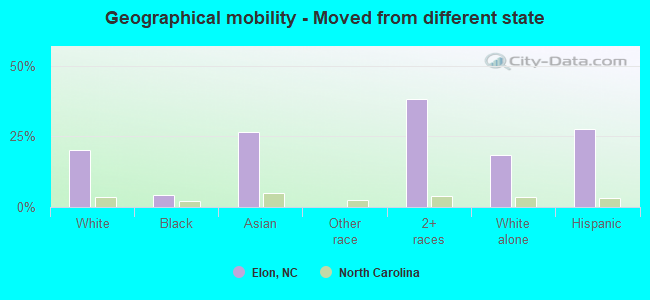
Geographical mobility - Moved from different state (%)
Geographical mobility - Moved from different state (%) - White
Geographical mobility - Moved from different state (%) - Black or African American
Geographical mobility - Moved from different state (%) - Asian
Geographical mobility - Moved from different state (%) - Hispanic or Latino
Geographical mobility - Moved from different state (%) - American Indian and Alaska Native
Geographical mobility - Moved from different state (%) - Multirace
Geographical mobility - Moved from different state (%) - Other Race
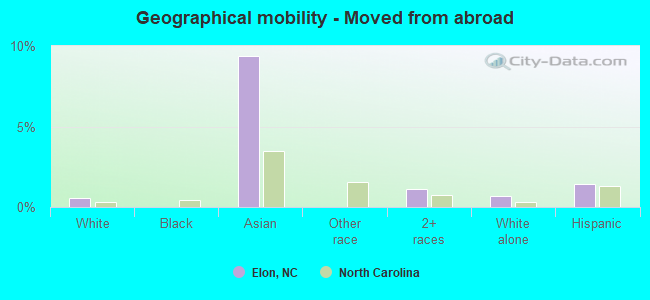
Geographical mobility - Moved from abroad (%)
Geographical mobility - Moved from abroad (%) - White
Geographical mobility - Moved from abroad (%) - Black or African American
Geographical mobility - Moved from abroad (%) - Asian
Geographical mobility - Moved from abroad (%) - Hispanic or Latino
Geographical mobility - Moved from abroad (%) - American Indian and Alaska Native
Geographical mobility - Moved from abroad (%) - Multirace
Geographical mobility - Moved from abroad (%) - Other Race
Place of birth for the foreign-born population - Ireland (%)
Place of birth for the foreign-born population - Denmark (%)
Place of birth for the foreign-born population - Norway (%)
Place of birth for the foreign-born population - Sweden (%)
Place of birth for the foreign-born population - United Kingdom (%)
Place of birth for the foreign-born population - England (%)
Place of birth for the foreign-born population - Scotland (%)
Place of birth for the foreign-born population - Other Northern Europe (%)
Place of birth for the foreign-born population - Austria (%)
Place of birth for the foreign-born population - Belgium (%)
Place of birth for the foreign-born population - France (%)
Place of birth for the foreign-born population - Germany (%)
Place of birth for the foreign-born population - Netherlands (%)
Place of birth for the foreign-born population - Switzerland (%)
Place of birth for the foreign-born population - Other Western Europe (%)
Place of birth for the foreign-born population - Greece (%)
Place of birth for the foreign-born population - Italy (%)
Place of birth for the foreign-born population - Portugal (%)
Place of birth for the foreign-born population - Spain (%)
Place of birth for the foreign-born population - Other Southern Europe (%)
Place of birth for the foreign-born population - Albania (%)
Place of birth for the foreign-born population - Belarus (%)
Place of birth for the foreign-born population - Bosnia and Herzegovina (%)
Place of birth for the foreign-born population - Bulgaria (%)
Place of birth for the foreign-born population - Croatia (%)
Place of birth for the foreign-born population - Czechoslovakia (%)
Place of birth for the foreign-born population - Hungary (%)
Place of birth for the foreign-born population - Latvia (%)
Place of birth for the foreign-born population - Lithuania (%)
Place of birth for the foreign-born population - North Macedonia (Macedonia) (%)
Place of birth for the foreign-born population - Moldova (%)
Place of birth for the foreign-born population - Poland (%)
Place of birth for the foreign-born population - Romania (%)
Place of birth for the foreign-born population - Russia (%)
Place of birth for the foreign-born population - Serbia (%)
Place of birth for the foreign-born population - Ukraine (%)
Place of birth for the foreign-born population - Other Eastern Europe (%)
Place of birth for the foreign-born population - China (%)
Place of birth for the foreign-born population - Hong Kong (%)
Place of birth for the foreign-born population - Taiwan (%)
Place of birth for the foreign-born population - Japan (%)
Place of birth for the foreign-born population - Korea (%)
Place of birth for the foreign-born population - Other Eastern Asia (%)
Place of birth for the foreign-born population - Afghanistan (%)
Place of birth for the foreign-born population - Bangladesh (%)
Place of birth for the foreign-born population - India (%)
Place of birth for the foreign-born population - Iran (%)
Place of birth for the foreign-born population - Kazakhstan (%)
Place of birth for the foreign-born population - Nepal (%)
Place of birth for the foreign-born population - Pakistan (%)
Place of birth for the foreign-born population - Sri Lanka (%)
Place of birth for the foreign-born population - Uzbekistan (%)
Place of birth for the foreign-born population - Other South Central Asia (%)
Place of birth for the foreign-born population - Burma (%)
Place of birth for the foreign-born population - Cambodia (%)
Place of birth for the foreign-born population - Indonesia (%)
Place of birth for the foreign-born population - Laos (%)
Place of birth for the foreign-born population - Malaysia (%)
Place of birth for the foreign-born population - Philippines (%)
Place of birth for the foreign-born population - Singapore (%)
Place of birth for the foreign-born population - Thailand (%)
Place of birth for the foreign-born population - Vietnam (%)
Place of birth for the foreign-born population - Other South Eastern Asia (%)
Place of birth for the foreign-born population - Armenia (%)
Place of birth for the foreign-born population - Iraq (%)
Place of birth for the foreign-born population - Israel (%)
Place of birth for the foreign-born population - Jordan (%)
Place of birth for the foreign-born population - Kuwait (%)
Place of birth for the foreign-born population - Lebanon (%)
Place of birth for the foreign-born population - Saudi Arabia (%)
Place of birth for the foreign-born population - Syria (%)
Place of birth for the foreign-born population - Turkey (%)
Place of birth for the foreign-born population - Yemen (%)
Place of birth for the foreign-born population - Other Western Asia (%)
Place of birth for the foreign-born population - Eritrea (%)
Place of birth for the foreign-born population - Ethiopia (%)
Place of birth for the foreign-born population - Kenya (%)
Place of birth for the foreign-born population - Somalia (%)
Place of birth for the foreign-born population - Uganda (%)
Place of birth for the foreign-born population - Zimbabwe (%)
Place of birth for the foreign-born population - Other Eastern Africa (%)
Place of birth for the foreign-born population - Cameroon (%)
Place of birth for the foreign-born population - Congo (%)
Place of birth for the foreign-born population - Democratic Republic of Congo (Zaire) (%)
Place of birth for the foreign-born population - Other Middle Africa (%)
Place of birth for the foreign-born population - Egypt (%)
Place of birth for the foreign-born population - Morocco (%)
Place of birth for the foreign-born population - Sudan (%)
Place of birth for the foreign-born population - Other Northern Africa (%)
Place of birth for the foreign-born population - South Africa (%)
Place of birth for the foreign-born population - Other Southern Africa (%)
Place of birth for the foreign-born population - Cabo Verde (%)
Place of birth for the foreign-born population - Ghana (%)
Place of birth for the foreign-born population - Liberia (%)
Place of birth for the foreign-born population - Nigeria (%)
Place of birth for the foreign-born population - Senegal (%)
Place of birth for the foreign-born population - Sierra Leone (%)
Place of birth for the foreign-born population - Other Western Africa (%)
Place of birth for the foreign-born population - Australia (%)
Place of birth for the foreign-born population - New Zealand (%)
Place of birth for the foreign-born population - Fiji (%)
Place of birth for the foreign-born population - Micronesia (%)
Place of birth for the foreign-born population - Bahamas (%)
Place of birth for the foreign-born population - Barbados (%)
Place of birth for the foreign-born population - Cuba (%)
Place of birth for the foreign-born population - Dominica (%)
Place of birth for the foreign-born population - Dominican Republic (%)
Place of birth for the foreign-born population - Grenada (%)
Place of birth for the foreign-born population - Haiti (%)
Place of birth for the foreign-born population - Jamaica (%)
Place of birth for the foreign-born population - St. Vincent and the Grenadines (%)
Place of birth for the foreign-born population - Trinidad and Tobago (%)
Place of birth for the foreign-born population - West Indies (%)
Place of birth for the foreign-born population - Other Caribbean (%)
Place of birth for the foreign-born population - Belize (%)
Place of birth for the foreign-born population - Costa Rica (%)
Place of birth for the foreign-born population - El Salvador (%)
Place of birth for the foreign-born population - Guatemala (%)
Place of birth for the foreign-born population - Honduras (%)
Place of birth for the foreign-born population - Mexico (%)
Place of birth for the foreign-born population - Nicaragua (%)
Place of birth for the foreign-born population - Panama (%)
Place of birth for the foreign-born population - Other Central America (%)
Place of birth for the foreign-born population - Argentina (%)
Place of birth for the foreign-born population - Bolivia (%)
Place of birth for the foreign-born population - Brazil (%)
Place of birth for the foreign-born population - Chile (%)
Place of birth for the foreign-born population - Colombia (%)
Place of birth for the foreign-born population - Ecuador (%)
Place of birth for the foreign-born population - Guyana (%)
Place of birth for the foreign-born population - Peru (%)
Place of birth for the foreign-born population - Uruguay (%)
Place of birth for the foreign-born population - Venezuela (%)
Place of birth for the foreign-born population - Other South America (%)
Place of birth for the foreign-born population - Canada (%)
Place of birth for the foreign-born population - Other Northern America (%)
Place of birth for the foreign-born population - Other (%)
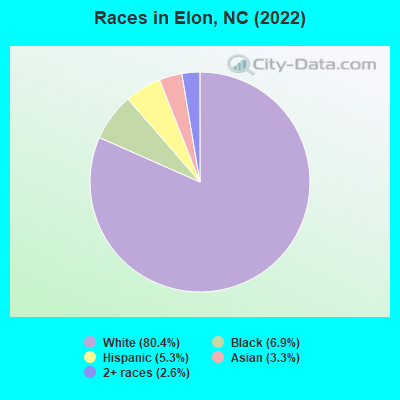
According to 2022 data, the most numerous races in Elon, NC are White alone (9,210 residents), Black alone (793 residents), and Hispanic (612 residents). 94.4% of Elon residents speak English at home.
Race distribution in Elon 9,210 80.4% White alone 793 6.9% Black alone 612 5.3% Hispanic 379 3.3% Asian alone 301 2.6% Two or more races
2000 2022
5,647,155 70.2% White alone 1,723,301 21.4% Black alone 378,963 4.7% Hispanic 112,416 1.4% Asian alone 95,333 1.2% American Indian alone 79,965 1.0% Two or more races 9,015 0.1% Other race alone 3,165 0.04% Native Hawaiian and Other
6,497,519 60.7% White alone 2,155,650 20.1% Black alone 1,114,799 10.4% Hispanic 438,061 4.1% Two or more races 341,052 3.2% Asian alone 91,758 0.9% American Indian alone 50,180 0.5% Other race alone 9,954 0.09% Native Hawaiian and Other
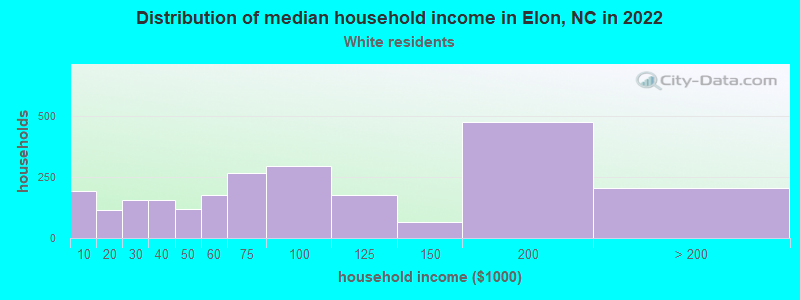
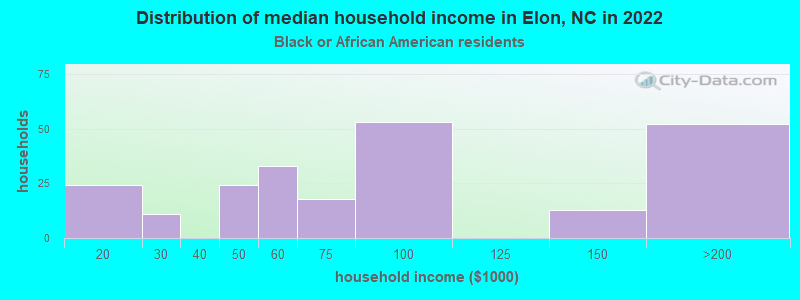
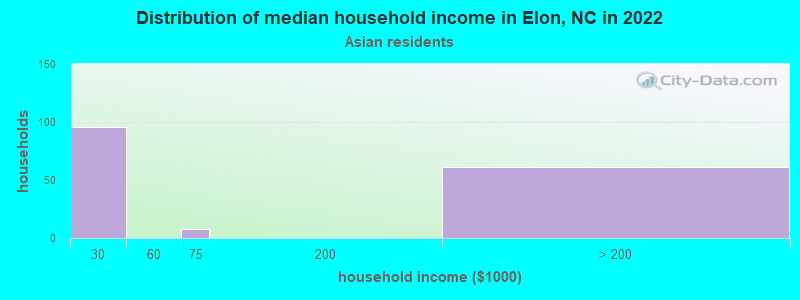
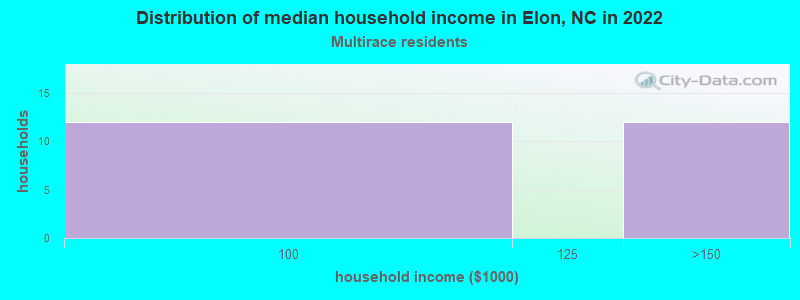
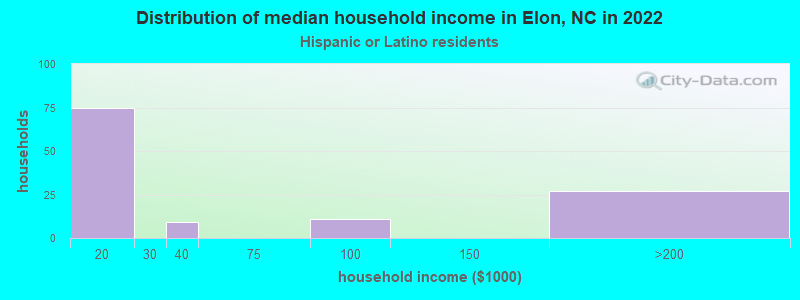
Income and house value in Elon Median household income in 2022 $75,514 White non-Hispanic householders$60,835 Black householders
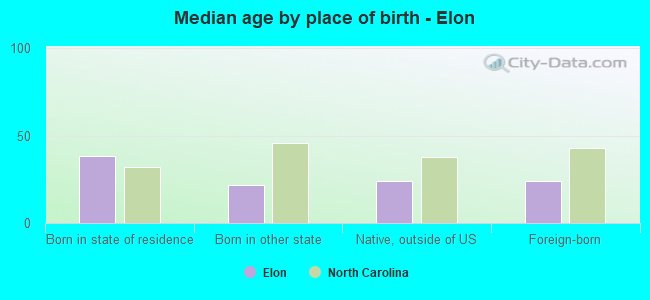
Median age by race in Elon
22.6 Median age for White residents22.8 22.3 34.5 Median age for Black or African American residents31.6 47.1 -1,192,353,642.8 Median age for American Indian / Alaska Native residents-668,604,650.5 -1,383,874,848.2 22.6 Median age for Asian residents15.0 27.4 -298,932,384.0 Median age for Native Hawaiian / Pacific Islander residents-635,658,914.1 -612,403,100.2 19.6 Median age for Other race residents15.6 24.4 21.8 Median age for Two or more races residents28.6 20.8 22.1 Median age for White alone residents22.1 21.8 20.7 Median age for Hispanic or Latino residents19.7 22.0
Owner/renter occupied households by race in Elon
House owners and renters - White residents 1,450 58.2% Owner occupied1,043 41.8% Renter occupiedHouse owners and renters - Black or African American residents 141 61.2% Owner occupied89 38.8% Renter occupiedHouse owners and renters - Asian residents 72 32.1% Owner occupied152 67.9% Renter occupiedHouse owners and renters - Two or more races residents 23 100.0% Owner occupiedHouse owners and renters - White alone residents 1,495 60.5% Owner occupied976 39.5% Renter occupiedHouse owners and renters - Hispanic or Latino residents 23 14.5% Owner occupied136 85.5% Renter occupied
Language usage in Elon
English speakers - Total 94.4% of residents of Elon speak English at home.
3.2% of residents speak Spanish at home 164 45.8% Speak English very well194 54.2% Speak English less than very well2.4% of residents speak other language at home 95 36.3% Speak English very well167 63.7% Speak English less than very well
English speakers - Born in the United States 98.4% of residents of Elon speak English at home.
1.5% of residents speak Spanish at home 94 84.7% Speak English very well17 15.3% Speak English less than very well1.1% of residents speak other language at home 82 100.0% Speak English very well
English speakers - Native, born elsewhere 99.3% of residents of Elon speak English at home.
8.1% of residents speak Spanish at home 12 100.0% Speak English very well
English speakers - Foreign-born 30.5% of residents of Elon speak English at home.
39.2% of residents speak Spanish at home 27 14.6% Speak English very well158 85.4% Speak English less than very well39.8% of residents speak other language at home 31 16.5% Speak English very well157 83.5% Speak English less than very well
White (Caucasian) - Speak only English Native:
99.2% (8,692)Foreign-born:
100.0% (84)
White (Caucasian) - Speak another language Native:
1.5% (130)Foreign-born:
59.8% (50)
Asian - Speak only English Native:
100.0% (228)Foreign-born:
11.0% (18)
Other race - Speak another language Native:
100.0% (45)Foreign-born:
99.8% (97)
Two or more races - Speak another language Native:
1.2% (4)Foreign-born:
100.0% (69)
White alone - Speak only English Native:
98.0% (8,621)Foreign-born:
73.0% (107)
White alone - Speak another language Native:
2.1% (180)Foreign-born:
28.7% (42)
Hispanic or Latino - Speak another language Native:
32.4% (130)Foreign-born:
98.3% (196)
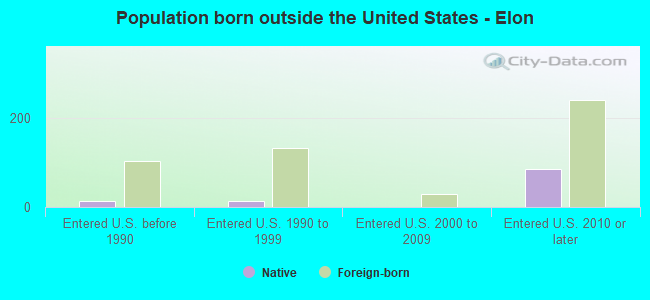
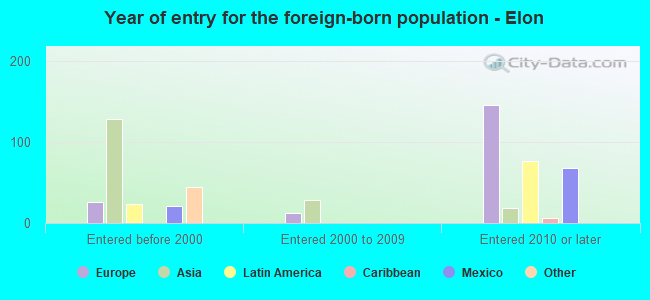
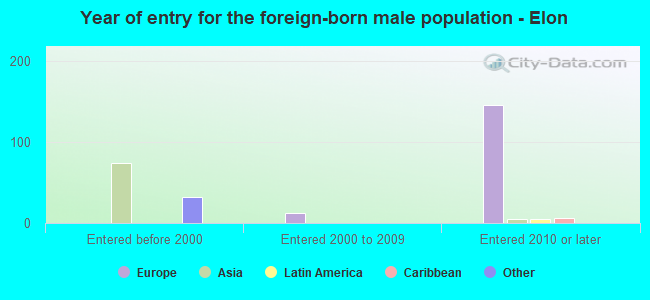
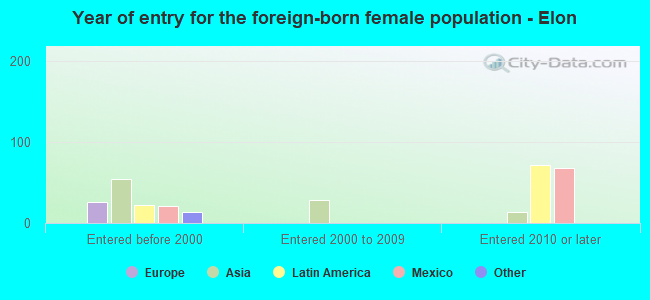
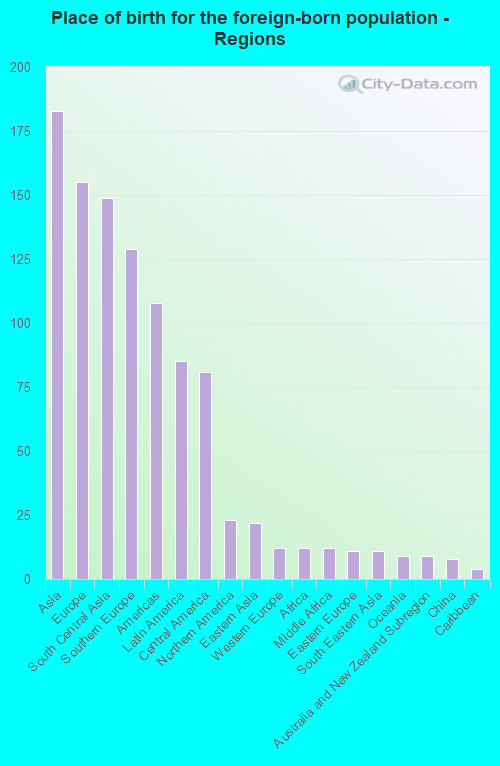
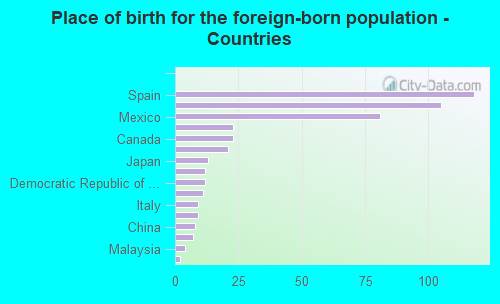
Foreign-born residents in Elon
Marital status for residents in Elon Marital status - White (Caucasian) population 15 years and over
Males 57.9% Never married36.1% Now married0.9% Separated1.8% Widowed3.3% DivorcedFemales 60.4% Never married27.5% Now married0.0% Separated10.4% Widowed1.8% DivorcedWomen who gave birth in the past 12 months Now married:
37.1% (33)Unmarried:
62.9% (56)
Women who did not give birth in the past 12 months Now married:
17.0% (527)Unmarried:
83.0% (2,574)
Marital status - Black or African American population 15 years and over
Males 70.9% Never married24.2% Now married0.7% Separated0.7% Widowed3.6% DivorcedFemales 54.5% Never married20.2% Now married0.0% Separated15.7% Widowed9.6% DivorcedWomen who did not give birth in the past 12 months Now married:
23.8% (53)Unmarried:
76.2% (169)
Marital status - Asian population 15 years and over
Males 70.2% Never married29.8% Now married0.0% Separated0.0% Widowed0.0% DivorcedFemales 65.2% Never married30.4% Now married0.0% Separated4.4% Widowed0.0% DivorcedWomen who did not give birth in the past 12 months Now married:
0.0% (0)Unmarried:
100.0% (108)
Marital status - Other race population 15 years and over
Males 100.0% Never married0.0% Now married0.0% Separated0.0% Widowed0.0% DivorcedFemales 53.8% Never married46.2% Now married0.0% Separated0.0% Widowed0.0% DivorcedWomen who did not give birth in the past 12 months Now married:
0.0% (0)Unmarried:
100.0% (45)
Marital status - Two or more races population 15 years and over
Males 90.0% Never married10.0% Now married0.0% Separated0.0% Widowed0.0% DivorcedFemales 86.9% Never married6.9% Now married6.2% Separated0.0% Widowed0.0% DivorcedWomen who did not give birth in the past 12 months Now married:
0.0% (0)Unmarried:
100.0% (155)
Marital status - White alone, not Hispanic / Latino population 15 years and over
Males 57.1% Never married36.8% Now married0.9% Separated1.8% Widowed3.3% DivorcedFemales 59.5% Never married27.9% Now married0.0% Separated10.7% Widowed1.9% DivorcedWomen who gave birth in the past 12 months Now married:
37.1% (35)Unmarried:
62.9% (59)
Women who did not give birth in the past 12 months Now married:
17.4% (552)Unmarried:
82.6% (2,618)
Marital status - Hispanic or Latino population 15 years and over
Males 91.9% Never married8.1% Now married0.0% Separated0.0% Widowed0.0% DivorcedFemales 79.3% Never married20.7% Now married0.0% Separated0.0% Widowed0.0% DivorcedWomen who did not give birth in the past 12 months Now married:
5.7% (11)Unmarried:
94.3% (179)
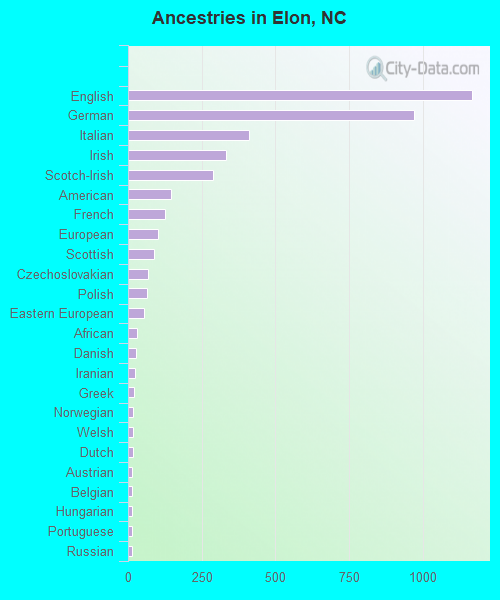
Ancestries in Elon
1,167 19.6% English971 16.3% German411 6.9% Italian331 5.5% Irish288 4.8% Scotch-Irish145 2.4% American125 2.1% French103 1.7% European88 1.5% Scottish68 1.1% Czechoslovakian64 1.1% Polish56 0.9% Eastern European32 0.5% African28 0.5% Danish24 0.4% Iranian22 0.4% Greek18 0.3% Norwegian18 0.3% Welsh16 0.3% Dutch15 0.3% Austrian14 0.2% Belgian13 0.2% Hungarian13 0.2% Portuguese12 0.2% Russian5 0.08% French Canadian
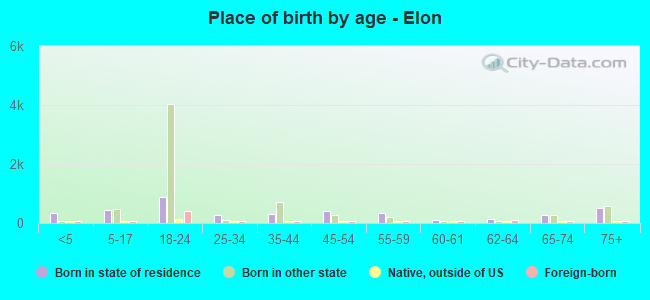
Children Nativity (place of birth) in Elon
Children under 6 years - Living with two parents Both parents native 247 100.0% NativeChildren under 6 years - Living with one parent Native parent 96 100.0% Native
Children 6 to 17 years - Living with two parents Both parents native 612 98.1% Native12 1.9% Foreign-bornChildren 6 to 17 years - Living with one parent Native parent 85 100.0% Native
Grandparents responsible for own grandchildren in Elon
Grandparents (30 to 59 years) White / Caucasian 70 100.0% Responsible for grandchildrenWhite alone, not Hispanic / Latino 74 100.0% Responsible for grandchildrenGrandparents (60 years and over) White / Caucasian 15 57.1% Responsible for grandchildren11 42.9% Not responsible for grandchildrenWhite alone, not Hispanic / Latino 17 61.0% Responsible for grandchildren11 39.0% Not responsible for grandchildren