Races in Elmwood Park, New Jersey (NJ) Detailed Stats
Data:
Races - White alone (%)
Races - White alone (% change since 2000)
Races - Black alone (%)
Races - Black alone (% change since 2000)
Races - American Indian alone (%)
Races - American Indian alone (% change since 2000)
Races - Asian alone (%)
Races - Asian alone (% change since 2000)
Races - Hispanic (%)
Races - Hispanic (% change since 2000)
Races - Native Hawaiian and Other Pacific Islander alone (%)
Races - Native Hawaiian and Other Pacific Islander alone (% change since 2000)
Races - Two or more races(%)
Races - Two or more races(% change since 2000)
Races - Other race alone (%)
Races - Other race alone (% change since 2000)
Racial diversity
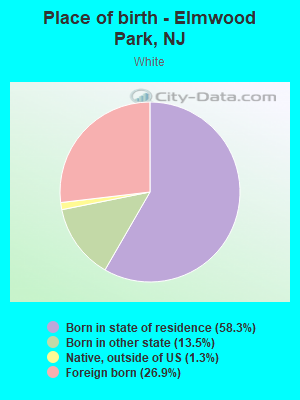
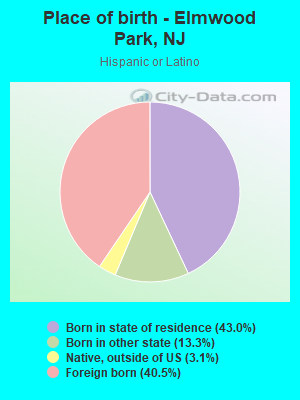
Place of birth - Born in state of residence (%)
Place of birth - Born in state of residence (%) - White
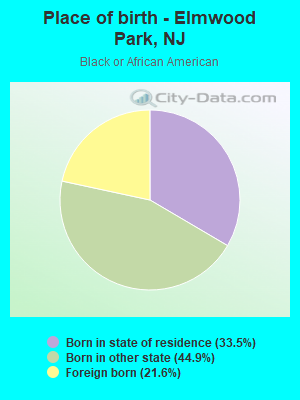
Place of birth - Born in state of residence (%) - Black or African American
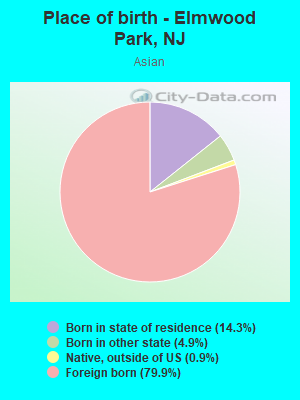
Place of birth - Born in state of residence (%) - Asian
Place of birth - Born in state of residence (%) - Hispanic or Latino
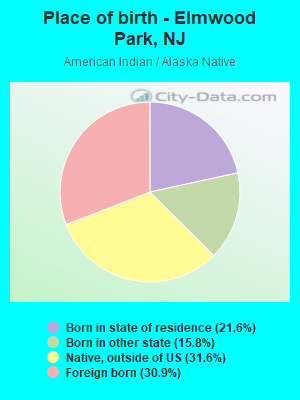
Place of birth - Born in state of residence (%) - American Indian and Alaska Native
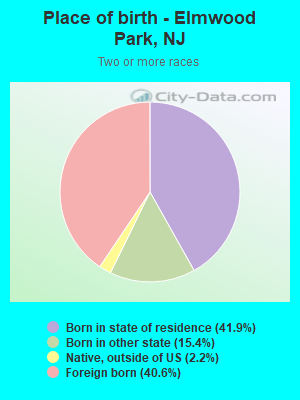
Place of birth - Born in state of residence (%) - Multirace
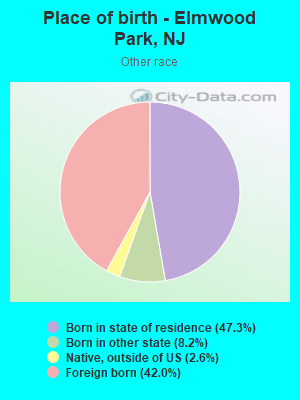
Place of birth - Born in state of residence (%) - Other Race
Place of birth - Born in other state (%)
Place of birth - Born in other state (%) - White
Place of birth - Born in other state (%) - Black or African American
Place of birth - Born in other state (%) - Asian
Place of birth - Born in other state (%) - Hispanic or Latino
Place of birth - Born in other state (%) - American Indian and Alaska Native
Place of birth - Born in other state (%) - Multirace
Place of birth - Born in other state (%) - Other Race
Place of birth - Native, outside of US (%)
Place of birth - Native, outside of US (%) - White
Place of birth - Native, outside of US (%) - Black or African American
Place of birth - Native, outside of US (%) - Asian
Place of birth - Native, outside of US (%) - Hispanic or Latino
Place of birth - Native, outside of US (%) - American Indian and Alaska Native
Place of birth - Native, outside of US (%) - Multirace
Place of birth - Native, outside of US (%) - Other Race
Place of birth - Foreign born (%)
Place of birth - Foreign born (%) - White
Place of birth - Foreign born (%) - Black or African American
Place of birth - Foreign born (%) - Asian
Place of birth - Foreign born (%) - Hispanic or Latino
Place of birth - Foreign born (%) - American Indian and Alaska Native
Place of birth - Foreign born (%) - Multirace
Place of birth - Foreign born (%) - Other Race
Residents speaking English at home (%)
Residents speaking English at home - Born in the United States (%)
Residents speaking English at home - Native, born elsewhere (%)
Residents speaking English at home - Foreign born (%)
Residents speaking Spanish at home (%)
Residents speaking Spanish at home - Born in the United States (%)
Residents speaking Spanish at home - Native, born elsewhere (%)
Residents speaking Spanish at home - Foreign born (%)
Residents speaking other language at home (%)
Residents speaking other language at home - Born in the United States (%)
Residents speaking other language at home - Native, born elsewhere (%)
Residents speaking other language at home - Foreign born (%)
Marital status - Never married (%)
Marital status - Now married (%)
Marital status - Separated (%)
Marital status - Widowed (%)
Marital status - Divorced (%)
Ancestries Reported - Arab (%)
Ancestries Reported - Czech (%)
Ancestries Reported - Danish (%)
Ancestries Reported - Dutch (%)
Ancestries Reported - English (%)
Ancestries Reported - French (%)
Ancestries Reported - French Canadian (%)
Ancestries Reported - German (%)
Ancestries Reported - Greek (%)
Ancestries Reported - Hungarian (%)
Ancestries Reported - Irish (%)
Ancestries Reported - Italian (%)
Ancestries Reported - Lithuanian (%)
Ancestries Reported - Norwegian (%)
Ancestries Reported - Polish (%)
Ancestries Reported - Portuguese (%)
Ancestries Reported - Russian (%)
Ancestries Reported - Scotch-Irish (%)
Ancestries Reported - Scottish (%)
Ancestries Reported - Slovak (%)
Ancestries Reported - Subsaharan African (%)
Ancestries Reported - Swedish (%)
Ancestries Reported - Swiss (%)
Ancestries Reported - Ukrainian (%)
Ancestries Reported - United States (%)
Ancestries Reported - Welsh (%)
Ancestries Reported - West Indian (%)
Ancestries Reported - Other (%)
Geographical mobility - Same house 1 year ago (%)
Geographical mobility - Same house 1 year ago (%) - White
Geographical mobility - Same house 1 year ago (%) - Black or African American
Geographical mobility - Same house 1 year ago (%) - Asian
Geographical mobility - Same house 1 year ago (%) - Hispanic or Latino
Geographical mobility - Same house 1 year ago (%) - American Indian and Alaska Native
Geographical mobility - Same house 1 year ago (%) - Multirace
Geographical mobility - Same house 1 year ago (%) - Other Race
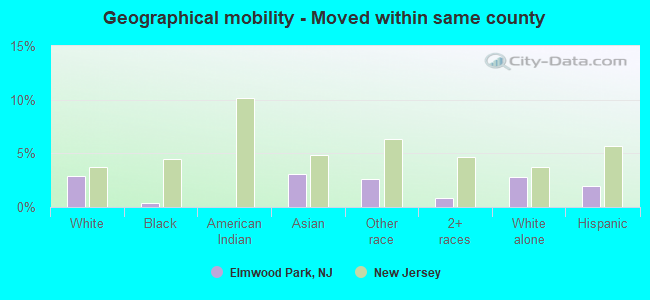
Geographical mobility - Moved within same county (%)
Geographical mobility - Moved within same county (%) - White
Geographical mobility - Moved within same county (%) - Black or African American
Geographical mobility - Moved within same county (%) - Asian
Geographical mobility - Moved within same county (%) - Hispanic or Latino
Geographical mobility - Moved within same county (%) - American Indian and Alaska Native
Geographical mobility - Moved within same county (%) - Multirace
Geographical mobility - Moved within same county (%) - Other Race
Geographical mobility - Moved from different county within same state (%)
Geographical mobility - Moved from different county within same state (%) - White
Geographical mobility - Moved from different county within same state (%) - Black or African American
Geographical mobility - Moved from different county within same state (%) - Asian
Geographical mobility - Moved from different county within same state (%) - Hispanic or Latino
Geographical mobility - Moved from different county within same state (%) - American Indian and Alaska Native
Geographical mobility - Moved from different county within same state (%) - Multirace
Geographical mobility - Moved from different county within same state (%) - Other Race
Geographical mobility - Moved from different state (%)
Geographical mobility - Moved from different state (%) - White
Geographical mobility - Moved from different state (%) - Black or African American
Geographical mobility - Moved from different state (%) - Asian
Geographical mobility - Moved from different state (%) - Hispanic or Latino
Geographical mobility - Moved from different state (%) - American Indian and Alaska Native
Geographical mobility - Moved from different state (%) - Multirace
Geographical mobility - Moved from different state (%) - Other Race
Geographical mobility - Moved from abroad (%)
Geographical mobility - Moved from abroad (%) - White
Geographical mobility - Moved from abroad (%) - Black or African American
Geographical mobility - Moved from abroad (%) - Asian
Geographical mobility - Moved from abroad (%) - Hispanic or Latino
Geographical mobility - Moved from abroad (%) - American Indian and Alaska Native
Geographical mobility - Moved from abroad (%) - Multirace
Geographical mobility - Moved from abroad (%) - Other Race
Place of birth for the foreign-born population - Ireland (%)
Place of birth for the foreign-born population - Denmark (%)
Place of birth for the foreign-born population - Norway (%)
Place of birth for the foreign-born population - Sweden (%)
Place of birth for the foreign-born population - United Kingdom (%)
Place of birth for the foreign-born population - England (%)
Place of birth for the foreign-born population - Scotland (%)
Place of birth for the foreign-born population - Other Northern Europe (%)
Place of birth for the foreign-born population - Austria (%)
Place of birth for the foreign-born population - Belgium (%)
Place of birth for the foreign-born population - France (%)
Place of birth for the foreign-born population - Germany (%)
Place of birth for the foreign-born population - Netherlands (%)
Place of birth for the foreign-born population - Switzerland (%)
Place of birth for the foreign-born population - Other Western Europe (%)
Place of birth for the foreign-born population - Greece (%)
Place of birth for the foreign-born population - Italy (%)
Place of birth for the foreign-born population - Portugal (%)
Place of birth for the foreign-born population - Spain (%)
Place of birth for the foreign-born population - Other Southern Europe (%)
Place of birth for the foreign-born population - Albania (%)
Place of birth for the foreign-born population - Belarus (%)
Place of birth for the foreign-born population - Bosnia and Herzegovina (%)
Place of birth for the foreign-born population - Bulgaria (%)
Place of birth for the foreign-born population - Croatia (%)
Place of birth for the foreign-born population - Czechoslovakia (%)
Place of birth for the foreign-born population - Hungary (%)
Place of birth for the foreign-born population - Latvia (%)
Place of birth for the foreign-born population - Lithuania (%)
Place of birth for the foreign-born population - North Macedonia (Macedonia) (%)
Place of birth for the foreign-born population - Moldova (%)
Place of birth for the foreign-born population - Poland (%)
Place of birth for the foreign-born population - Romania (%)
Place of birth for the foreign-born population - Russia (%)
Place of birth for the foreign-born population - Serbia (%)
Place of birth for the foreign-born population - Ukraine (%)
Place of birth for the foreign-born population - Other Eastern Europe (%)
Place of birth for the foreign-born population - China (%)
Place of birth for the foreign-born population - Hong Kong (%)
Place of birth for the foreign-born population - Taiwan (%)
Place of birth for the foreign-born population - Japan (%)
Place of birth for the foreign-born population - Korea (%)
Place of birth for the foreign-born population - Other Eastern Asia (%)
Place of birth for the foreign-born population - Afghanistan (%)
Place of birth for the foreign-born population - Bangladesh (%)
Place of birth for the foreign-born population - India (%)
Place of birth for the foreign-born population - Iran (%)
Place of birth for the foreign-born population - Kazakhstan (%)
Place of birth for the foreign-born population - Nepal (%)
Place of birth for the foreign-born population - Pakistan (%)
Place of birth for the foreign-born population - Sri Lanka (%)
Place of birth for the foreign-born population - Uzbekistan (%)
Place of birth for the foreign-born population - Other South Central Asia (%)
Place of birth for the foreign-born population - Burma (%)
Place of birth for the foreign-born population - Cambodia (%)
Place of birth for the foreign-born population - Indonesia (%)
Place of birth for the foreign-born population - Laos (%)
Place of birth for the foreign-born population - Malaysia (%)
Place of birth for the foreign-born population - Philippines (%)
Place of birth for the foreign-born population - Singapore (%)
Place of birth for the foreign-born population - Thailand (%)
Place of birth for the foreign-born population - Vietnam (%)
Place of birth for the foreign-born population - Other South Eastern Asia (%)
Place of birth for the foreign-born population - Armenia (%)
Place of birth for the foreign-born population - Iraq (%)
Place of birth for the foreign-born population - Israel (%)
Place of birth for the foreign-born population - Jordan (%)
Place of birth for the foreign-born population - Kuwait (%)
Place of birth for the foreign-born population - Lebanon (%)
Place of birth for the foreign-born population - Saudi Arabia (%)
Place of birth for the foreign-born population - Syria (%)
Place of birth for the foreign-born population - Turkey (%)
Place of birth for the foreign-born population - Yemen (%)
Place of birth for the foreign-born population - Other Western Asia (%)
Place of birth for the foreign-born population - Eritrea (%)
Place of birth for the foreign-born population - Ethiopia (%)
Place of birth for the foreign-born population - Kenya (%)
Place of birth for the foreign-born population - Somalia (%)
Place of birth for the foreign-born population - Uganda (%)
Place of birth for the foreign-born population - Zimbabwe (%)
Place of birth for the foreign-born population - Other Eastern Africa (%)
Place of birth for the foreign-born population - Cameroon (%)
Place of birth for the foreign-born population - Congo (%)
Place of birth for the foreign-born population - Democratic Republic of Congo (Zaire) (%)
Place of birth for the foreign-born population - Other Middle Africa (%)
Place of birth for the foreign-born population - Egypt (%)
Place of birth for the foreign-born population - Morocco (%)
Place of birth for the foreign-born population - Sudan (%)
Place of birth for the foreign-born population - Other Northern Africa (%)
Place of birth for the foreign-born population - South Africa (%)
Place of birth for the foreign-born population - Other Southern Africa (%)
Place of birth for the foreign-born population - Cabo Verde (%)
Place of birth for the foreign-born population - Ghana (%)
Place of birth for the foreign-born population - Liberia (%)
Place of birth for the foreign-born population - Nigeria (%)
Place of birth for the foreign-born population - Senegal (%)
Place of birth for the foreign-born population - Sierra Leone (%)
Place of birth for the foreign-born population - Other Western Africa (%)
Place of birth for the foreign-born population - Australia (%)
Place of birth for the foreign-born population - New Zealand (%)
Place of birth for the foreign-born population - Fiji (%)
Place of birth for the foreign-born population - Micronesia (%)
Place of birth for the foreign-born population - Bahamas (%)
Place of birth for the foreign-born population - Barbados (%)
Place of birth for the foreign-born population - Cuba (%)
Place of birth for the foreign-born population - Dominica (%)
Place of birth for the foreign-born population - Dominican Republic (%)
Place of birth for the foreign-born population - Grenada (%)
Place of birth for the foreign-born population - Haiti (%)
Place of birth for the foreign-born population - Jamaica (%)
Place of birth for the foreign-born population - St. Vincent and the Grenadines (%)
Place of birth for the foreign-born population - Trinidad and Tobago (%)
Place of birth for the foreign-born population - West Indies (%)
Place of birth for the foreign-born population - Other Caribbean (%)
Place of birth for the foreign-born population - Belize (%)
Place of birth for the foreign-born population - Costa Rica (%)
Place of birth for the foreign-born population - El Salvador (%)
Place of birth for the foreign-born population - Guatemala (%)
Place of birth for the foreign-born population - Honduras (%)
Place of birth for the foreign-born population - Mexico (%)
Place of birth for the foreign-born population - Nicaragua (%)
Place of birth for the foreign-born population - Panama (%)
Place of birth for the foreign-born population - Other Central America (%)
Place of birth for the foreign-born population - Argentina (%)
Place of birth for the foreign-born population - Bolivia (%)
Place of birth for the foreign-born population - Brazil (%)
Place of birth for the foreign-born population - Chile (%)
Place of birth for the foreign-born population - Colombia (%)
Place of birth for the foreign-born population - Ecuador (%)
Place of birth for the foreign-born population - Guyana (%)
Place of birth for the foreign-born population - Peru (%)
Place of birth for the foreign-born population - Uruguay (%)
Place of birth for the foreign-born population - Venezuela (%)
Place of birth for the foreign-born population - Other South America (%)
Place of birth for the foreign-born population - Canada (%)
Place of birth for the foreign-born population - Other Northern America (%)
Place of birth for the foreign-born population - Other (%)
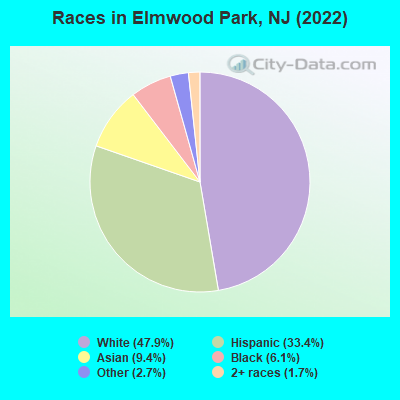
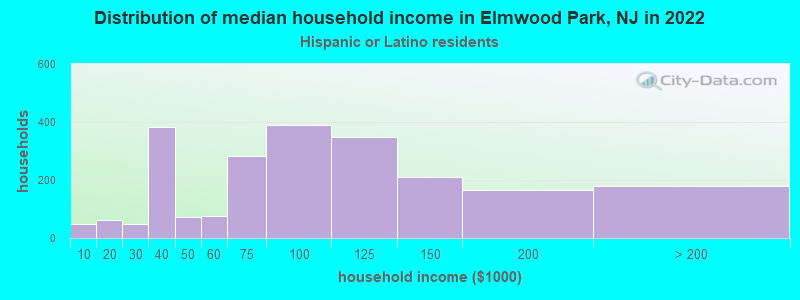
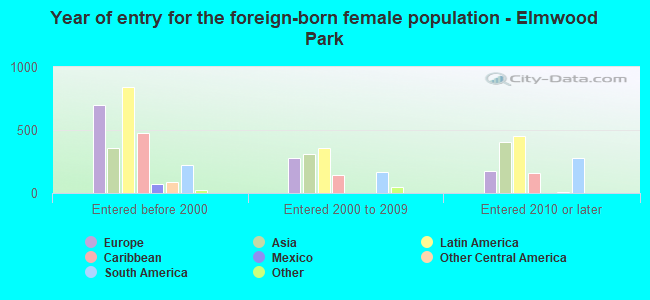
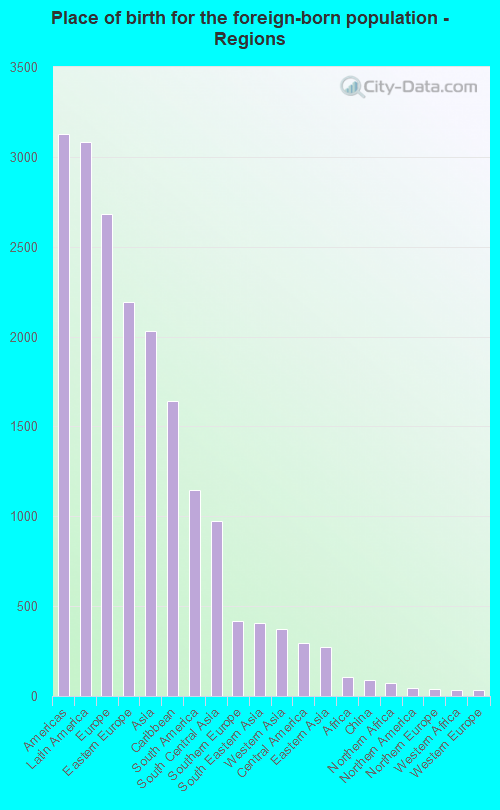
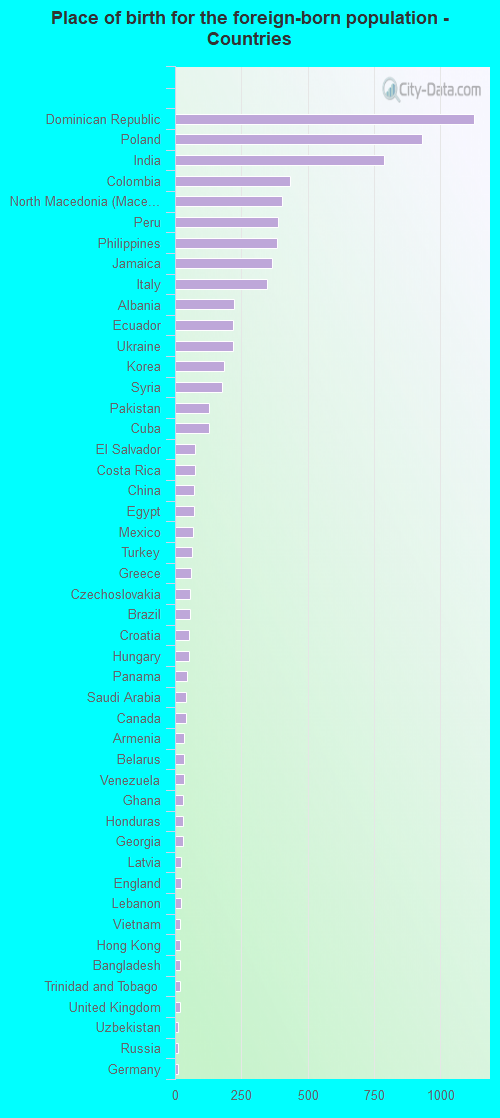
According to 2022 data, the most numerous races in Elmwood Park, NJ are White alone (10,172 residents), Hispanic (7,107 residents), and Black alone (1,297 residents). 42.7% of Elmwood Park residents speak English at home. 37.4% of Elmwood Park, NJ residents are foreign-born (14.1% born in Latin America, 12.3% born in Europe, 9.3% born in Asia), which is 38.5% greater than the foreign-born rate of 23.0% across the entire state of New Jersey.
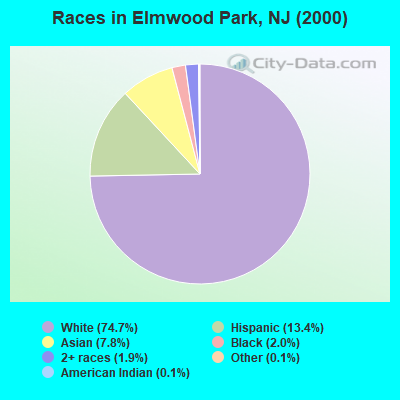
Race distribution in Elmwood Park
2000 2022
5,557,209 66.0% White alone 1,117,191 13.3% Hispanic 1,096,171 13.0% Black alone 477,012 5.7% Asian alone 133,689 1.6% Two or more races 19,565 0.2% Other race alone 11,338 0.1% American Indian alone 2,175 0.03% Native Hawaiian and Other
4,766,476 51.5% White alone 2,028,470 21.9% Hispanic 1,111,632 12.0% Black alone 923,546 10.0% Asian alone 332,237 3.6% Two or more races 89,847 1.0% Other race alone 8,557 0.09% American Indian alone 934 0.01% Native Hawaiian and Other
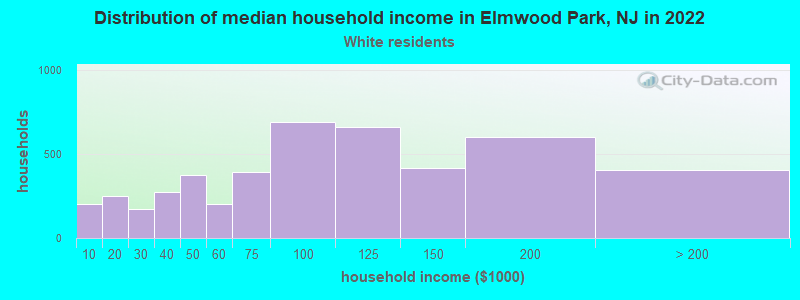
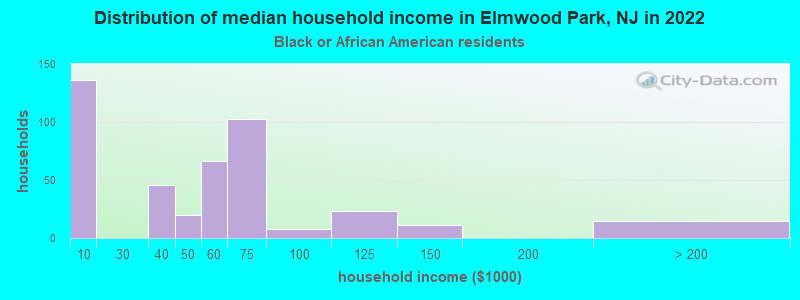
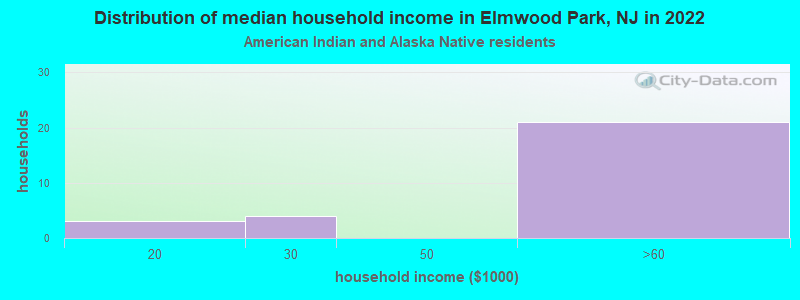
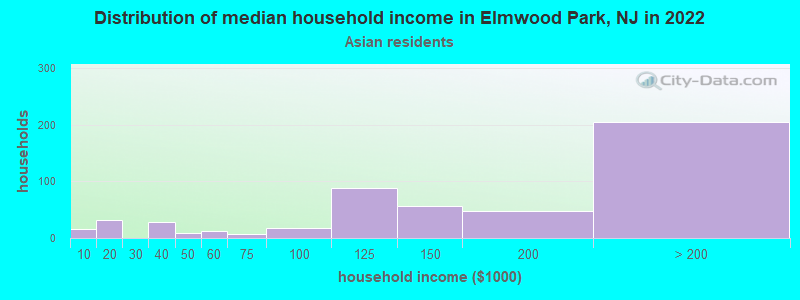
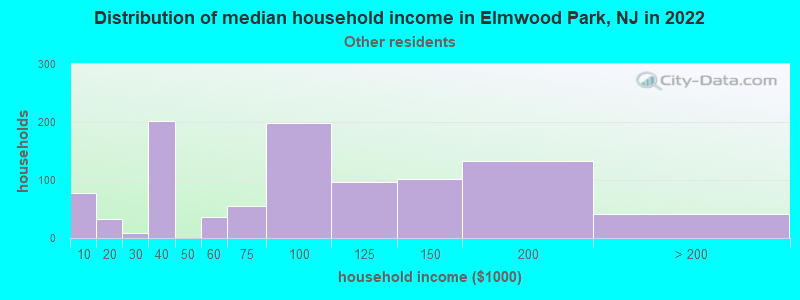
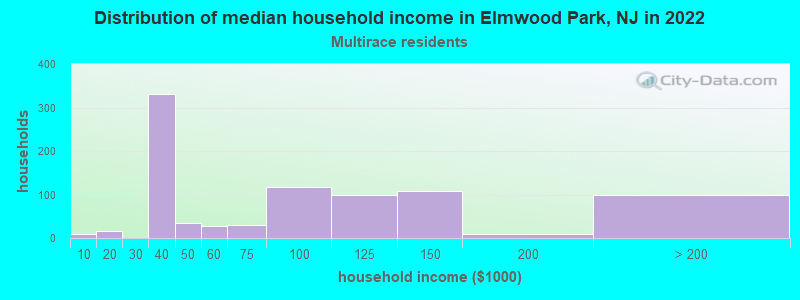
Income and house value in Elmwood Park Median household income in 2022 $80,709 White non-Hispanic householders$65,145 Black householders$140,929 Asian householders$76,902 Some other race householders$82,404 Hispanic or Latino race householdersMedian 2022 house value $428,690 White Non-Hispanic householders$398,454 Black or African American householders $425,174 Asian householders$444,159 Some other race householders$475,567 Two or more races householders$450,488 Hispanic or Latino householders
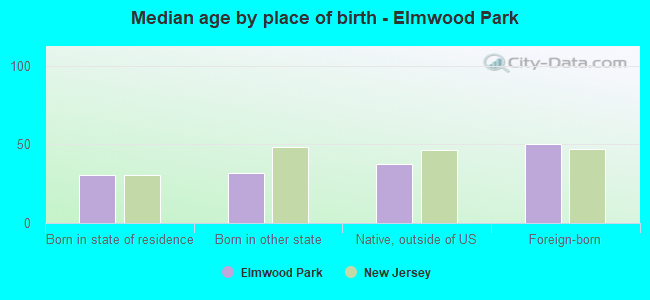
Median age by race in Elmwood Park
45.5 Median age for White residents43.8 48.3 31.4 Median age for Black or African American residents29.1 30.8 36.1 Median age for American Indian / Alaska Native residents32.2 44.3 42.7 Median age for Asian residents42.4 43.1 -510,460,250.5 Median age for Native Hawaiian / Pacific Islander residents-514,767,932.0 -713,070,378.3 28.6 Median age for Other race residents29.2 26.6 36.3 Median age for Two or more races residents35.5 38.5 48.9 Median age for White alone residents46.1 51.3 33.5 Median age for Hispanic or Latino residents32.6 33.9
Owner/renter occupied households by race in Elmwood Park
House owners and renters - White residents 2,933 64.3% Owner occupied1,628 35.7% Renter occupiedHouse owners and renters - Black or African American residents 60 16.0% Owner occupied313 84.0% Renter occupiedHouse owners and renters - American Indian / Alaska Native residents 12 50.5% Owner occupied12 49.5% Renter occupiedHouse owners and renters - Asian residents 354 66.1% Owner occupied182 33.9% Renter occupiedHouse owners and renters - Other race residents 352 34.3% Owner occupied675 65.7% Renter occupiedHouse owners and renters - Two or more races residents 271 29.7% Owner occupied642 70.3% Renter occupiedHouse owners and renters - White alone residents 2,780 67.7% Owner occupied1,328 32.3% Renter occupiedHouse owners and renters - Hispanic or Latino residents 708 32.1% Owner occupied1,500 67.9% Renter occupied
Language usage in Elmwood Park
English speakers - Total 42.7% of residents of Elmwood Park speak English at home.
26.9% of residents speak Spanish at home 3,457 64.5% Speak English very well1,901 35.5% Speak English less than very well31.3% of residents speak other language at home 3,636 58.5% Speak English very well2,581 41.5% Speak English less than very well
English speakers - Born in the United States 71.1% of residents of Elmwood Park speak English at home.
26.0% of residents speak Spanish at home 655 94.7% Speak English very well37 5.3% Speak English less than very well4.6% of residents speak other language at home 107 87.7% Speak English very well15 12.3% Speak English less than very well
English speakers - Native, born elsewhere 11.4% of residents of Elmwood Park speak English at home.
56.3% of residents speak Spanish at home 182 81.6% Speak English very well41 18.4% Speak English less than very well28.8% of residents speak other language at home 77 67.5% Speak English very well37 32.5% Speak English less than very well
English speakers - Foreign-born 8.3% of residents of Elmwood Park speak English at home.
32.6% of residents speak Spanish at home 849 33.2% Speak English very well1,705 66.8% Speak English less than very well59.8% of residents speak other language at home 2,253 48.1% Speak English very well2,429 51.9% Speak English less than very well
White (Caucasian) - Speak only English Native:
75.3% (6,093)Foreign-born:
11.4% (352)
White (Caucasian) - Speak another language Native:
21.1% (1,709)Foreign-born:
86.2% (2,664)
Black or African American - Speak only English Native:
74.3% (789)Foreign-born:
39.3% (132)
Black or African American - Speak another language Native:
25.9% (275)Foreign-born:
55.1% (185)
American Indian / Alaska Native - Speak another language Native:
100.0% (51)Foreign-born:
100.0% (25)
Asian - Speak only English Native:
55.0% (193)Foreign-born:
3.8% (59)
Asian - Speak another language Native:
45.4% (159)Foreign-born:
96.5% (1,512)
Other race - Speak only English Native:
9.1% (152)Foreign-born:
1.9% (28)
Other race - Speak another language Native:
96.2% (1,594)Foreign-born:
100.0% (1,496)
Two or more races - Speak only English Native:
50.6% (603)Foreign-born:
7.1% (69)
Two or more races - Speak another language Native:
50.3% (600)Foreign-born:
93.6% (907)
White alone - Speak only English Native:
83.3% (5,824)Foreign-born:
10.0% (288)
White alone - Speak another language Native:
16.2% (1,134)Foreign-born:
90.4% (2,614)
Hispanic or Latino - Speak only English Native:
27.6% (1,024)Foreign-born:
6.3% (175)
Hispanic or Latino - Speak another language Native:
74.6% (2,765)Foreign-born:
93.3% (2,577)
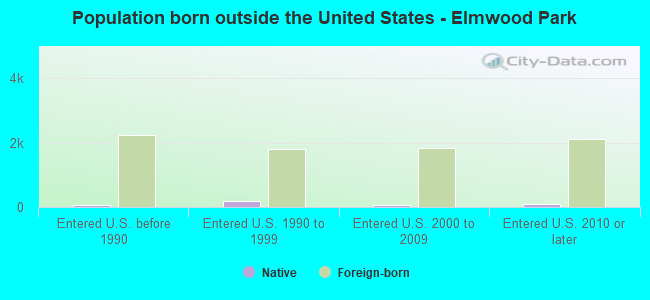
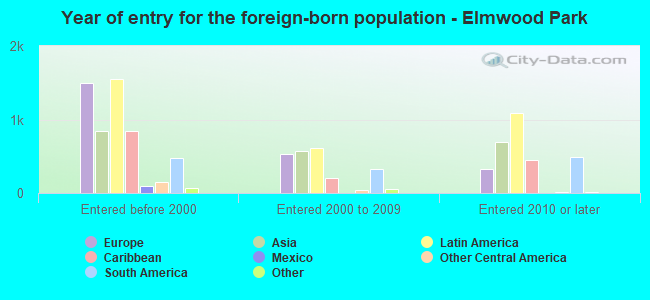
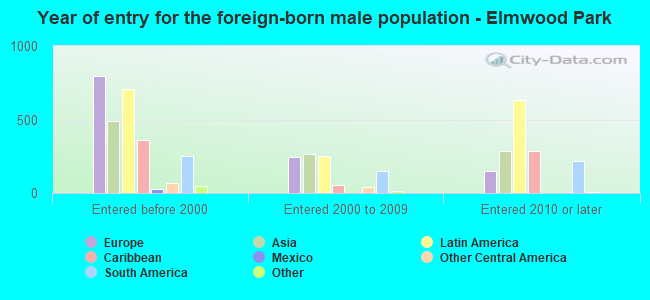
Foreign-born residents in Elmwood Park 7,945 residents are foreign born (14.1% Latin America , 12.3% Europe , 9.3% Asia ).
This city:
37.4%New Jersey:
23.2%
Marital status for residents in Elmwood Park Marital status - White (Caucasian) population 15 years and over
Males 37.1% Never married51.5% Now married0.9% Separated3.5% Widowed6.9% DivorcedFemales 35.5% Never married44.4% Now married1.8% Separated9.4% Widowed9.0% DivorcedWomen who gave birth in the past 12 months Now married:
72.4% (145)Unmarried:
27.6% (55)
Women who did not give birth in the past 12 months Now married:
30.4% (685)Unmarried:
69.6% (1,570)
Marital status - Black or African American population 15 years and over
Males 34.7% Never married60.5% Now married2.0% Separated0.0% Widowed2.8% DivorcedFemales 61.9% Never married29.4% Now married3.8% Separated1.8% Widowed3.0% DivorcedWomen who gave birth in the past 12 months Now married:
100.0% (21)Unmarried:
0.0% (0)
Women who did not give birth in the past 12 months Now married:
31.1% (141)Unmarried:
68.9% (313)
Marital status - American Indian / Alaska Native population 15 years and over
Males 7.4% Never married92.6% Now married0.0% Separated0.0% Widowed0.0% DivorcedFemales 38.5% Never married30.8% Now married19.2% Separated0.0% Widowed11.5% DivorcedWomen who gave birth in the past 12 months Now married:
44.4% (12)Unmarried:
55.6% (15)
Women who did not give birth in the past 12 months Now married:
100.0% (8)Unmarried:
0.0% (0)
Marital status - Asian population 15 years and over
Males 28.9% Never married70.4% Now married0.0% Separated0.7% Widowed0.0% DivorcedFemales 19.8% Never married74.4% Now married2.9% Separated0.0% Widowed2.8% DivorcedWomen who gave birth in the past 12 months Now married:
100.0% (15)Unmarried:
0.0% (0)
Women who did not give birth in the past 12 months Now married:
70.3% (354)Unmarried:
29.7% (150)
Marital status - Other race population 15 years and over
Males 39.3% Never married49.2% Now married8.6% Separated1.8% Widowed1.1% DivorcedFemales 39.4% Never married42.2% Now married5.7% Separated5.7% Widowed6.9% DivorcedWomen who gave birth in the past 12 months Now married:
65.2% (152)Unmarried:
34.8% (81)
Women who did not give birth in the past 12 months Now married:
32.7% (325)Unmarried:
67.3% (668)
Marital status - Two or more races population 15 years and over
Males 38.6% Never married56.2% Now married0.0% Separated0.0% Widowed5.1% DivorcedFemales 31.6% Never married25.1% Now married3.6% Separated4.6% Widowed35.2% DivorcedWomen who did not give birth in the past 12 months Now married:
28.0% (212)Unmarried:
72.0% (544)
Marital status - White alone, not Hispanic / Latino population 15 years and over
Males 35.9% Never married53.4% Now married1.1% Separated3.1% Widowed6.5% DivorcedFemales 30.4% Never married51.4% Now married2.0% Separated8.3% Widowed7.8% DivorcedWomen who gave birth in the past 12 months Now married:
75.8% (160)Unmarried:
24.2% (51)
Women who did not give birth in the past 12 months Now married:
38.3% (640)Unmarried:
61.7% (1,030)
Marital status - Hispanic or Latino population 15 years and over
Males 39.5% Never married47.9% Now married3.3% Separated3.3% Widowed6.1% DivorcedFemales 45.8% Never married26.3% Now married3.4% Separated7.9% Widowed16.7% DivorcedWomen who gave birth in the past 12 months Now married:
59.4% (106)Unmarried:
40.6% (72)
Women who did not give birth in the past 12 months Now married:
21.5% (454)Unmarried:
78.5% (1,659)
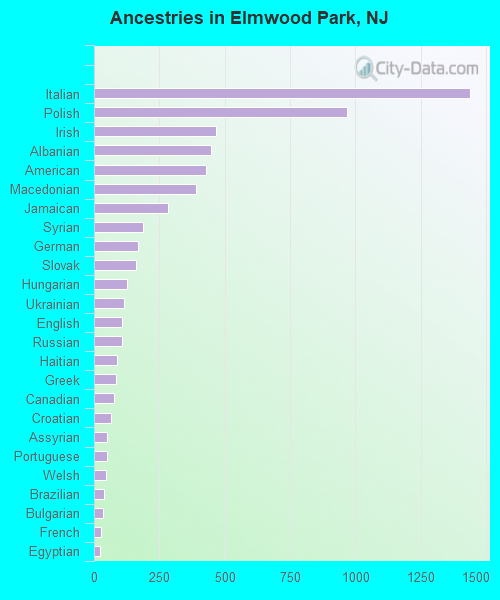
Ancestries in Elmwood Park
1,439 11.0% Italian969 7.4% Polish467 3.6% Irish448 3.4% Albanian430 3.3% American392 3.0% Macedonian284 2.2% Jamaican188 1.4% Syrian169 1.3% German159 1.2% Slovak125 1.0% Hungarian114 0.9% Ukrainian108 0.8% English107 0.8% Russian87 0.7% Haitian84 0.6% Greek78 0.6% Canadian64 0.5% Croatian51 0.4% Assyrian51 0.4% Portuguese47 0.4% Welsh39 0.3% Brazilian35 0.3% Bulgarian26 0.2% French22 0.2% Egyptian21 0.2% Turkish21 0.2% British West Indian17 0.1% Yugoslavian13 0.10% Trinidadian and Tobagonian10 0.08% European8 0.06% Serbian6 0.05% French Canadian5 0.04% British3 0.02% Norwegian
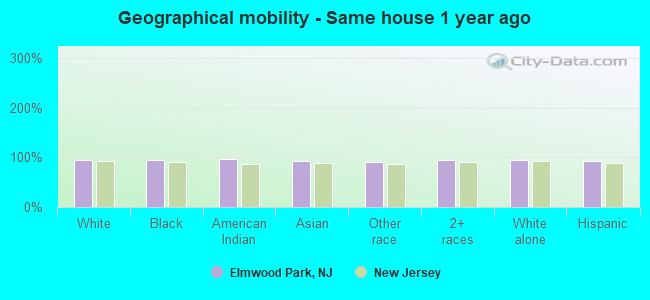
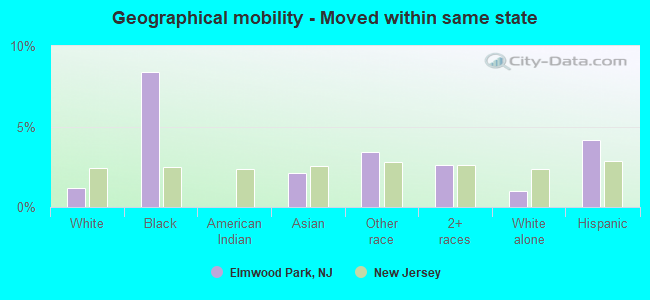
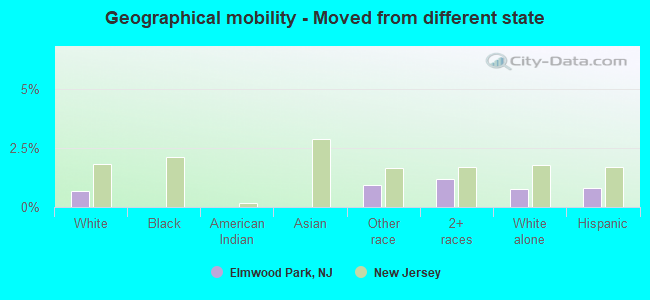
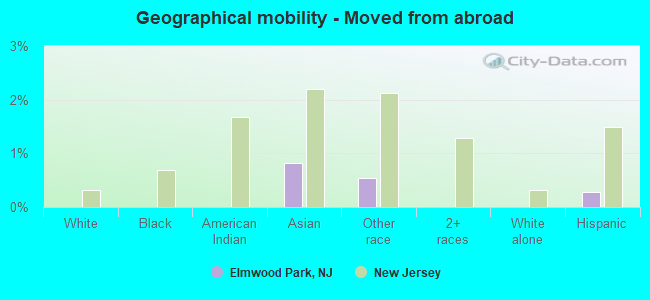
Geographical mobility in Elmwood Park Same house 1 year ago 11,150 95.1% White (Caucasian)1,490 95.3% Black or African American98 96.6% American Indian / Alaska Native1,868 92.1% Asian3,356 91.5% Other race2,137 94.8% Two or more races9,564 95.2% White alone, not Hispanic / Latino6,461 92.7% Hispanic or LatinoMoved within same county 336 2.9% White / Caucasian6 0.4% Black or African American63 3.1% Asian96 2.6% Other race18 0.8% Two or more races279 2.8% White alone, not Hispanic / Latino138 2.0% Hispanic or LatinoMoved within same state 135 1.2% White / Caucasian131 8.4% Black or African American43 2.1% Asian125 3.4% Other race58 2.6% Two or more races102 1.0% White alone, not Hispanic / Latino289 4.1% Hispanic or LatinoMoved from different state 79 0.7% White / Caucasian34 0.9% Other race27 1.2% Two or more races76 0.8% White alone, not Hispanic / Latino56 0.8% Hispanic or LatinoMoved from abroad 16 0.8% Asian20 0.5% Other race19 0.3% Hispanic or Latino
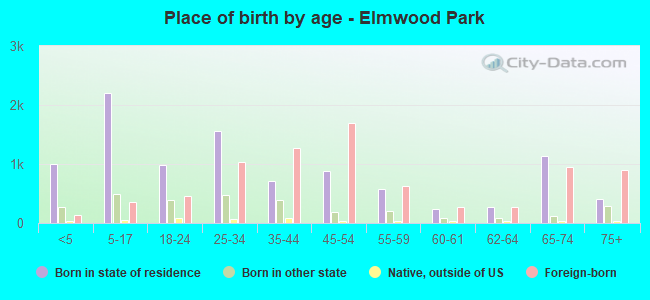
Children Nativity (place of birth) in Elmwood Park
Children under 6 years - Living with two parents Both parents native 378 100.0% NativeBoth parents foreign-born 366 83.0% Native75 17.0% Foreign-bornOne native, one foreign-born parent 105 100.0% NativeChildren under 6 years - Living with one parent Native parent 217 81.6% Native49 18.4% Foreign-bornForeign-born parent 267 100.0% NativeChildren 6 to 17 years - Living with two parents Both parents native 432 94.8% Native24 5.2% Foreign-bornBoth parents foreign-born 900 83.3% Native181 16.7% Foreign-bornOne native, one foreign-born parent 233 95.3% Native11 4.7% Foreign-bornChildren 6 to 17 years - Living with one parent Native parent 526 100.0% NativeForeign-born parent 547 54.1% Native464 45.9% Foreign-born
Grandparents responsible for own grandchildren in Elmwood Park
Grandparents (30 to 59 years) White / Caucasian 9 5.4% Responsible for grandchildren165 94.6% Not responsible for grandchildrenAsian 18 100.0% Not responsible for grandchildrenOther race 154 100.0% Not responsible for grandchildrenTwo or more races 54 65.5% Responsible for grandchildren28 34.5% Not responsible for grandchildrenWhite alone, not Hispanic / Latino 11 11.6% Responsible for grandchildren81 88.4% Not responsible for grandchildrenHispanic or Latino 44 22.8% Responsible for grandchildren147 77.2% Not responsible for grandchildrenGrandparents (60 years and over) White / Caucasian 12 7.8% Responsible for grandchildren138 92.2% Not responsible for grandchildrenAsian 5 9.2% Responsible for grandchildren44 90.8% Not responsible for grandchildrenOther race 20 100.0% Not responsible for grandchildrenTwo or more races 24 100.0% Not responsible for grandchildrenWhite alone, not Hispanic / Latino 16 14.8% Responsible for grandchildren92 85.2% Not responsible for grandchildrenHispanic or Latino 147 100.0% Not responsible for grandchildren