Races in Elko, Nevada (NV) Detailed Stats
Data:
Races - White alone (%)
Races - White alone (% change since 2000)
Races - Black alone (%)
Races - Black alone (% change since 2000)
Races - American Indian alone (%)
Races - American Indian alone (% change since 2000)
Races - Asian alone (%)
Races - Asian alone (% change since 2000)
Races - Hispanic (%)
Races - Hispanic (% change since 2000)
Races - Native Hawaiian and Other Pacific Islander alone (%)
Races - Native Hawaiian and Other Pacific Islander alone (% change since 2000)
Races - Two or more races(%)
Races - Two or more races(% change since 2000)
Races - Other race alone (%)
Races - Other race alone (% change since 2000)
Racial diversity
Place of birth - Born in state of residence (%)
Place of birth - Born in state of residence (%) - White
Place of birth - Born in state of residence (%) - Black or African American
Place of birth - Born in state of residence (%) - Asian
Place of birth - Born in state of residence (%) - Hispanic or Latino
Place of birth - Born in state of residence (%) - American Indian and Alaska Native
Place of birth - Born in state of residence (%) - Multirace
Place of birth - Born in state of residence (%) - Other Race
Place of birth - Born in other state (%)
Place of birth - Born in other state (%) - White
Place of birth - Born in other state (%) - Black or African American
Place of birth - Born in other state (%) - Asian
Place of birth - Born in other state (%) - Hispanic or Latino
Place of birth - Born in other state (%) - American Indian and Alaska Native
Place of birth - Born in other state (%) - Multirace
Place of birth - Born in other state (%) - Other Race
Place of birth - Native, outside of US (%)
Place of birth - Native, outside of US (%) - White
Place of birth - Native, outside of US (%) - Black or African American
Place of birth - Native, outside of US (%) - Asian
Place of birth - Native, outside of US (%) - Hispanic or Latino
Place of birth - Native, outside of US (%) - American Indian and Alaska Native
Place of birth - Native, outside of US (%) - Multirace
Place of birth - Native, outside of US (%) - Other Race
Place of birth - Foreign born (%)
Place of birth - Foreign born (%) - White
Place of birth - Foreign born (%) - Black or African American
Place of birth - Foreign born (%) - Asian
Place of birth - Foreign born (%) - Hispanic or Latino
Place of birth - Foreign born (%) - American Indian and Alaska Native
Place of birth - Foreign born (%) - Multirace
Place of birth - Foreign born (%) - Other Race
Residents speaking English at home (%)
Residents speaking English at home - Born in the United States (%)
Residents speaking English at home - Native, born elsewhere (%)
Residents speaking English at home - Foreign born (%)
Residents speaking Spanish at home (%)
Residents speaking Spanish at home - Born in the United States (%)
Residents speaking Spanish at home - Native, born elsewhere (%)
Residents speaking Spanish at home - Foreign born (%)
Residents speaking other language at home (%)
Residents speaking other language at home - Born in the United States (%)
Residents speaking other language at home - Native, born elsewhere (%)
Residents speaking other language at home - Foreign born (%)
Marital status - Never married (%)
Marital status - Now married (%)
Marital status - Separated (%)
Marital status - Widowed (%)
Marital status - Divorced (%)
Ancestries Reported - Arab (%)
Ancestries Reported - Czech (%)
Ancestries Reported - Danish (%)
Ancestries Reported - Dutch (%)
Ancestries Reported - English (%)
Ancestries Reported - French (%)
Ancestries Reported - French Canadian (%)
Ancestries Reported - German (%)
Ancestries Reported - Greek (%)
Ancestries Reported - Hungarian (%)
Ancestries Reported - Irish (%)
Ancestries Reported - Italian (%)
Ancestries Reported - Lithuanian (%)
Ancestries Reported - Norwegian (%)
Ancestries Reported - Polish (%)
Ancestries Reported - Portuguese (%)
Ancestries Reported - Russian (%)
Ancestries Reported - Scotch-Irish (%)
Ancestries Reported - Scottish (%)
Ancestries Reported - Slovak (%)
Ancestries Reported - Subsaharan African (%)
Ancestries Reported - Swedish (%)
Ancestries Reported - Swiss (%)
Ancestries Reported - Ukrainian (%)
Ancestries Reported - United States (%)
Ancestries Reported - Welsh (%)
Ancestries Reported - West Indian (%)
Ancestries Reported - Other (%)
Geographical mobility - Same house 1 year ago (%)
Geographical mobility - Same house 1 year ago (%) - White
Geographical mobility - Same house 1 year ago (%) - Black or African American
Geographical mobility - Same house 1 year ago (%) - Asian
Geographical mobility - Same house 1 year ago (%) - Hispanic or Latino
Geographical mobility - Same house 1 year ago (%) - American Indian and Alaska Native
Geographical mobility - Same house 1 year ago (%) - Multirace
Geographical mobility - Same house 1 year ago (%) - Other Race
Geographical mobility - Moved within same county (%)
Geographical mobility - Moved within same county (%) - White
Geographical mobility - Moved within same county (%) - Black or African American
Geographical mobility - Moved within same county (%) - Asian
Geographical mobility - Moved within same county (%) - Hispanic or Latino
Geographical mobility - Moved within same county (%) - American Indian and Alaska Native
Geographical mobility - Moved within same county (%) - Multirace
Geographical mobility - Moved within same county (%) - Other Race
Geographical mobility - Moved from different county within same state (%)
Geographical mobility - Moved from different county within same state (%) - White
Geographical mobility - Moved from different county within same state (%) - Black or African American
Geographical mobility - Moved from different county within same state (%) - Asian
Geographical mobility - Moved from different county within same state (%) - Hispanic or Latino
Geographical mobility - Moved from different county within same state (%) - American Indian and Alaska Native
Geographical mobility - Moved from different county within same state (%) - Multirace
Geographical mobility - Moved from different county within same state (%) - Other Race
Geographical mobility - Moved from different state (%)
Geographical mobility - Moved from different state (%) - White
Geographical mobility - Moved from different state (%) - Black or African American
Geographical mobility - Moved from different state (%) - Asian
Geographical mobility - Moved from different state (%) - Hispanic or Latino
Geographical mobility - Moved from different state (%) - American Indian and Alaska Native
Geographical mobility - Moved from different state (%) - Multirace
Geographical mobility - Moved from different state (%) - Other Race
Geographical mobility - Moved from abroad (%)
Geographical mobility - Moved from abroad (%) - White
Geographical mobility - Moved from abroad (%) - Black or African American
Geographical mobility - Moved from abroad (%) - Asian
Geographical mobility - Moved from abroad (%) - Hispanic or Latino
Geographical mobility - Moved from abroad (%) - American Indian and Alaska Native
Geographical mobility - Moved from abroad (%) - Multirace
Geographical mobility - Moved from abroad (%) - Other Race
Place of birth for the foreign-born population - Ireland (%)
Place of birth for the foreign-born population - Denmark (%)
Place of birth for the foreign-born population - Norway (%)
Place of birth for the foreign-born population - Sweden (%)
Place of birth for the foreign-born population - United Kingdom (%)
Place of birth for the foreign-born population - England (%)
Place of birth for the foreign-born population - Scotland (%)
Place of birth for the foreign-born population - Other Northern Europe (%)
Place of birth for the foreign-born population - Austria (%)
Place of birth for the foreign-born population - Belgium (%)
Place of birth for the foreign-born population - France (%)
Place of birth for the foreign-born population - Germany (%)
Place of birth for the foreign-born population - Netherlands (%)
Place of birth for the foreign-born population - Switzerland (%)
Place of birth for the foreign-born population - Other Western Europe (%)
Place of birth for the foreign-born population - Greece (%)
Place of birth for the foreign-born population - Italy (%)
Place of birth for the foreign-born population - Portugal (%)
Place of birth for the foreign-born population - Spain (%)
Place of birth for the foreign-born population - Other Southern Europe (%)
Place of birth for the foreign-born population - Albania (%)
Place of birth for the foreign-born population - Belarus (%)
Place of birth for the foreign-born population - Bosnia and Herzegovina (%)
Place of birth for the foreign-born population - Bulgaria (%)
Place of birth for the foreign-born population - Croatia (%)
Place of birth for the foreign-born population - Czechoslovakia (%)
Place of birth for the foreign-born population - Hungary (%)
Place of birth for the foreign-born population - Latvia (%)
Place of birth for the foreign-born population - Lithuania (%)
Place of birth for the foreign-born population - North Macedonia (Macedonia) (%)
Place of birth for the foreign-born population - Moldova (%)
Place of birth for the foreign-born population - Poland (%)
Place of birth for the foreign-born population - Romania (%)
Place of birth for the foreign-born population - Russia (%)
Place of birth for the foreign-born population - Serbia (%)
Place of birth for the foreign-born population - Ukraine (%)
Place of birth for the foreign-born population - Other Eastern Europe (%)
Place of birth for the foreign-born population - China (%)
Place of birth for the foreign-born population - Hong Kong (%)
Place of birth for the foreign-born population - Taiwan (%)
Place of birth for the foreign-born population - Japan (%)
Place of birth for the foreign-born population - Korea (%)
Place of birth for the foreign-born population - Other Eastern Asia (%)
Place of birth for the foreign-born population - Afghanistan (%)
Place of birth for the foreign-born population - Bangladesh (%)
Place of birth for the foreign-born population - India (%)
Place of birth for the foreign-born population - Iran (%)
Place of birth for the foreign-born population - Kazakhstan (%)
Place of birth for the foreign-born population - Nepal (%)
Place of birth for the foreign-born population - Pakistan (%)
Place of birth for the foreign-born population - Sri Lanka (%)
Place of birth for the foreign-born population - Uzbekistan (%)
Place of birth for the foreign-born population - Other South Central Asia (%)
Place of birth for the foreign-born population - Burma (%)
Place of birth for the foreign-born population - Cambodia (%)
Place of birth for the foreign-born population - Indonesia (%)
Place of birth for the foreign-born population - Laos (%)
Place of birth for the foreign-born population - Malaysia (%)
Place of birth for the foreign-born population - Philippines (%)
Place of birth for the foreign-born population - Singapore (%)
Place of birth for the foreign-born population - Thailand (%)
Place of birth for the foreign-born population - Vietnam (%)
Place of birth for the foreign-born population - Other South Eastern Asia (%)
Place of birth for the foreign-born population - Armenia (%)
Place of birth for the foreign-born population - Iraq (%)
Place of birth for the foreign-born population - Israel (%)
Place of birth for the foreign-born population - Jordan (%)
Place of birth for the foreign-born population - Kuwait (%)
Place of birth for the foreign-born population - Lebanon (%)
Place of birth for the foreign-born population - Saudi Arabia (%)
Place of birth for the foreign-born population - Syria (%)
Place of birth for the foreign-born population - Turkey (%)
Place of birth for the foreign-born population - Yemen (%)
Place of birth for the foreign-born population - Other Western Asia (%)
Place of birth for the foreign-born population - Eritrea (%)
Place of birth for the foreign-born population - Ethiopia (%)
Place of birth for the foreign-born population - Kenya (%)
Place of birth for the foreign-born population - Somalia (%)
Place of birth for the foreign-born population - Uganda (%)
Place of birth for the foreign-born population - Zimbabwe (%)
Place of birth for the foreign-born population - Other Eastern Africa (%)
Place of birth for the foreign-born population - Cameroon (%)
Place of birth for the foreign-born population - Congo (%)
Place of birth for the foreign-born population - Democratic Republic of Congo (Zaire) (%)
Place of birth for the foreign-born population - Other Middle Africa (%)
Place of birth for the foreign-born population - Egypt (%)
Place of birth for the foreign-born population - Morocco (%)
Place of birth for the foreign-born population - Sudan (%)
Place of birth for the foreign-born population - Other Northern Africa (%)
Place of birth for the foreign-born population - South Africa (%)
Place of birth for the foreign-born population - Other Southern Africa (%)
Place of birth for the foreign-born population - Cabo Verde (%)
Place of birth for the foreign-born population - Ghana (%)
Place of birth for the foreign-born population - Liberia (%)
Place of birth for the foreign-born population - Nigeria (%)
Place of birth for the foreign-born population - Senegal (%)
Place of birth for the foreign-born population - Sierra Leone (%)
Place of birth for the foreign-born population - Other Western Africa (%)
Place of birth for the foreign-born population - Australia (%)
Place of birth for the foreign-born population - New Zealand (%)
Place of birth for the foreign-born population - Fiji (%)
Place of birth for the foreign-born population - Micronesia (%)
Place of birth for the foreign-born population - Bahamas (%)
Place of birth for the foreign-born population - Barbados (%)
Place of birth for the foreign-born population - Cuba (%)
Place of birth for the foreign-born population - Dominica (%)
Place of birth for the foreign-born population - Dominican Republic (%)
Place of birth for the foreign-born population - Grenada (%)
Place of birth for the foreign-born population - Haiti (%)
Place of birth for the foreign-born population - Jamaica (%)
Place of birth for the foreign-born population - St. Vincent and the Grenadines (%)
Place of birth for the foreign-born population - Trinidad and Tobago (%)
Place of birth for the foreign-born population - West Indies (%)
Place of birth for the foreign-born population - Other Caribbean (%)
Place of birth for the foreign-born population - Belize (%)
Place of birth for the foreign-born population - Costa Rica (%)
Place of birth for the foreign-born population - El Salvador (%)
Place of birth for the foreign-born population - Guatemala (%)
Place of birth for the foreign-born population - Honduras (%)
Place of birth for the foreign-born population - Mexico (%)
Place of birth for the foreign-born population - Nicaragua (%)
Place of birth for the foreign-born population - Panama (%)
Place of birth for the foreign-born population - Other Central America (%)
Place of birth for the foreign-born population - Argentina (%)
Place of birth for the foreign-born population - Bolivia (%)
Place of birth for the foreign-born population - Brazil (%)
Place of birth for the foreign-born population - Chile (%)
Place of birth for the foreign-born population - Colombia (%)
Place of birth for the foreign-born population - Ecuador (%)
Place of birth for the foreign-born population - Guyana (%)
Place of birth for the foreign-born population - Peru (%)
Place of birth for the foreign-born population - Uruguay (%)
Place of birth for the foreign-born population - Venezuela (%)
Place of birth for the foreign-born population - Other South America (%)
Place of birth for the foreign-born population - Canada (%)
Place of birth for the foreign-born population - Other Northern America (%)
Place of birth for the foreign-born population - Other (%)
Latest news about races in Elko, NV collected exclusively by city-data.com from local newspapers, TV, and radio stations
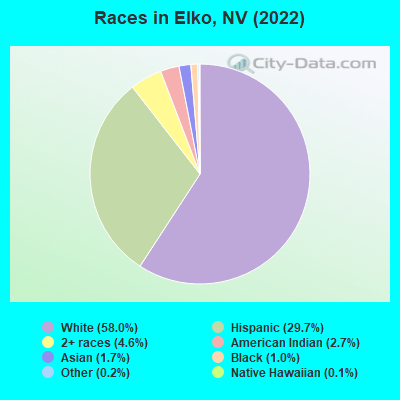
According to 2022 data, the most numerous races in Elko, NV are White alone (12,184 residents), Hispanic (6,238 residents), and Black alone (207 residents). 82.4% of Elko residents speak English at home. 6.5% of Elko, NV residents are foreign-born (5.3% born in Latin America), which is 177.5% less than the foreign-born rate of 18.0% across the entire state of Nevada.
Race distribution in Elko
2000 2022
1,303,001 65.2% White alone 393,970 19.7% Hispanic 131,509 6.6% Black alone 88,593 4.4% Asian alone 49,231 2.5% Two or more races 21,397 1.1% American Indian alone 7,769 0.4% Native Hawaiian and Other 2,787 0.1% Other race alone
1,410,145 44.4% White alone 961,357 30.3% Hispanic 286,471 9.0% Black alone 281,149 8.8% Asian alone 182,151 5.7% Two or more races 20,102 0.6% Native Hawaiian and Other 18,781 0.6% Other race alone 17,616 0.6% American Indian alone
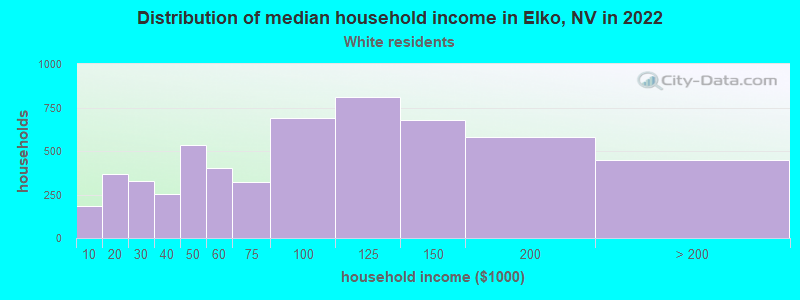
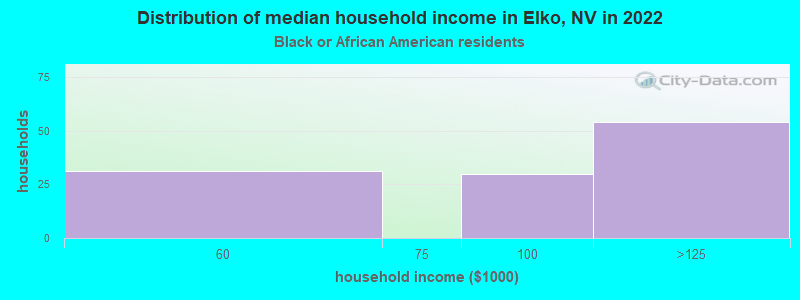
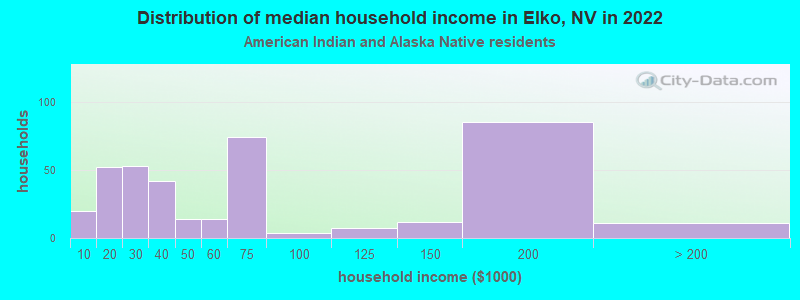
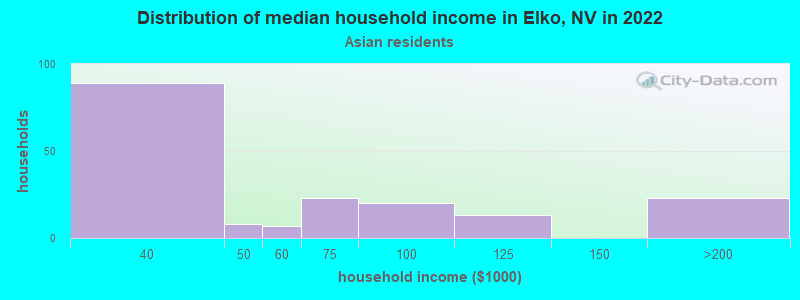
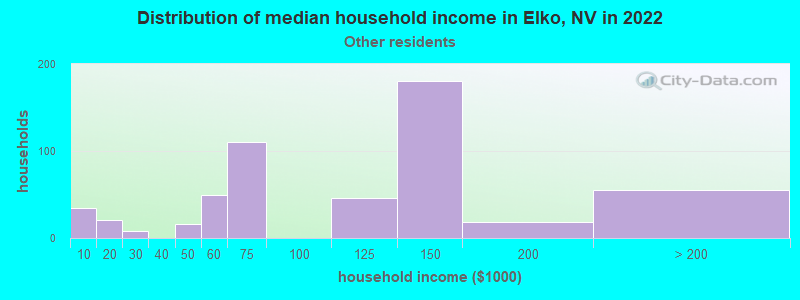
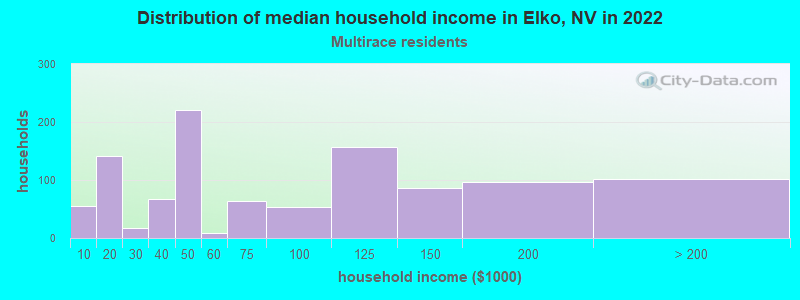
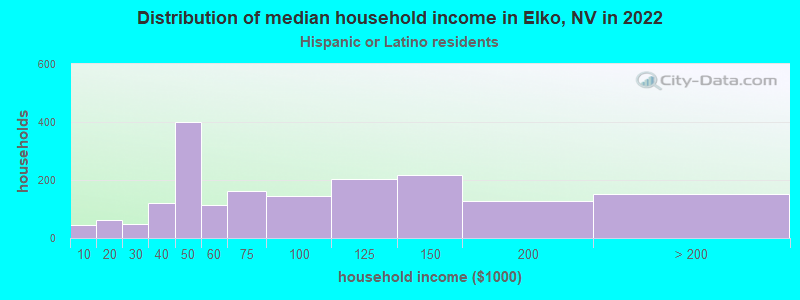
Income and house value in Elko Median household income in 2022 $88,476 White non-Hispanic householders$87,405 Black householders$45,248 American Indian and Alaska Native householders$47,849 Asian householders$115,206 Some other race householders$66,388 Two or more races householders$65,380 Hispanic or Latino race householdersMedian 2022 house value $363,934 White Non-Hispanic householders$390,335 Black or African American householders$271,105 American Indian or Alaska Native householders $354,850 Asian householders$354,850 Some other race householders$338,385 Two or more races householders$333,843 Hispanic or Latino householders
Median age by race in Elko
37.4 Median age for White residents37.0 37.6 35.7 Median age for Black or African American residents38.2 5.0 31.3 Median age for American Indian / Alaska Native residents30.0 37.2 23.0 Median age for Asian residents28.9 18.9 32.7 Median age for Native Hawaiian / Pacific Islander residents-648,090,814.6 -725,146,198.1 31.3 Median age for Other race residents30.0 37.3 26.0 Median age for Two or more races residents28.0 24.2 38.5 Median age for White alone residents38.4 38.6 26.6 Median age for Hispanic or Latino residents26.2 28.0
Owner/renter occupied households by race in Elko
House owners and renters - White residents 3,597 64.6% Owner occupied1,971 35.4% Renter occupiedHouse owners and renters - Black or African American residents 27 25.0% Owner occupied81 75.0% Renter occupiedHouse owners and renters - American Indian / Alaska Native residents 171 40.7% Owner occupied250 59.3% Renter occupiedHouse owners and renters - Asian residents 66 34.9% Owner occupied123 65.1% Renter occupiedHouse owners and renters - Native Hawaiian / Pacific Islander residents 16 100.0% Renter occupiedHouse owners and renters - Other race residents 364 68.2% Owner occupied170 31.8% Renter occupiedHouse owners and renters - Two or more races residents 644 61.4% Owner occupied405 38.6% Renter occupiedHouse owners and renters - White alone residents 3,188 61.9% Owner occupied1,963 38.1% Renter occupiedHouse owners and renters - Hispanic or Latino residents 1,265 69.6% Owner occupied553 30.4% Renter occupied
Language usage in Elko
English speakers - Total 82.4% of residents of Elko speak English at home.
15.4% of residents speak Spanish at home 2,398 79.6% Speak English very well616 20.4% Speak English less than very well2.2% of residents speak other language at home 382 88.4% Speak English very well50 11.6% Speak English less than very well
English speakers - Born in the United States 88.8% of residents of Elko speak English at home.
9.5% of residents speak Spanish at home 813 87.1% Speak English very well120 12.9% Speak English less than very well1.7% of residents speak other language at home 162 100.0% Speak English very well
English speakers - Native, born elsewhere 39.0% of residents of Elko speak English at home.
0.6% of residents speak Spanish at home 1 100.0% Speak English less than very well59.1% of residents speak other language at home 97 100.0% Speak English very well
English speakers - Foreign-born 9.8% of residents of Elko speak English at home.
82.1% of residents speak Spanish at home 581 54.9% Speak English very well477 45.1% Speak English less than very well9.3% of residents speak other language at home 86 71.7% Speak English very well34 28.3% Speak English less than very well
White (Caucasian) - Speak only English Native:
97.4% (12,222)Foreign-born:
38.7% (83)
White (Caucasian) - Speak another language Native:
3.7% (469)Foreign-born:
62.8% (135)
Black or African American - Speak another language Native:
9.8% (15)Foreign-born:
100.0% (17)
American Indian / Alaska Native - Speak another language Native:
17.5% (155)Foreign-born:
100.0% (9)
Asian - Speak only English Native:
49.6% (72)Foreign-born:
5.2% (8)
Asian - Speak another language Native:
47.8% (70)Foreign-born:
94.4% (137)
Other race - Speak another language Native:
61.3% (947)Foreign-born:
100.0% (455)
Two or more races - Speak only English Native:
73.4% (1,925)Foreign-born:
6.2% (34)
Two or more races - Speak another language Native:
25.8% (675)Foreign-born:
93.9% (506)
White alone - Speak only English Native:
98.2% (11,418)Foreign-born:
82.7% (45)
White alone - Speak another language Native:
1.8% (212)Foreign-born:
16.0% (9)
Hispanic or Latino - Speak only English Native:
59.8% (2,757)Foreign-born:
4.6% (49)
Hispanic or Latino - Speak another language Native:
40.5% (1,870)Foreign-born:
95.5% (1,021)
Foreign-born residents in Elko 1,362 residents are foreign born (5.3% Latin America ).
This city:
6.5%Nevada:
19.1%
Marital status for residents in Elko Marital status - White (Caucasian) population 15 years and over
Males 31.7% Never married50.3% Now married2.8% Separated1.1% Widowed14.1% DivorcedFemales 23.7% Never married52.5% Now married1.2% Separated6.3% Widowed16.4% DivorcedWomen who gave birth in the past 12 months Now married:
80.3% (143)Unmarried:
19.7% (35)
Women who did not give birth in the past 12 months Now married:
52.9% (1,446)Unmarried:
47.1% (1,286)
Marital status - Black or African American population 15 years and over
Males 38.0% Never married20.7% Now married21.5% Separated0.0% Widowed19.8% DivorcedFemales 33.3% Never married66.7% Now married0.0% Separated0.0% Widowed0.0% DivorcedWomen who did not give birth in the past 12 months Now married:
66.7% (21)Unmarried:
33.3% (10)
Marital status - American Indian / Alaska Native population 15 years and over
Males 57.0% Never married29.7% Now married0.0% Separated0.3% Widowed13.0% DivorcedFemales 41.7% Never married21.2% Now married0.7% Separated7.3% Widowed29.1% DivorcedWomen who gave birth in the past 12 months Now married:
72.7% (19)Unmarried:
27.3% (7)
Women who did not give birth in the past 12 months Now married:
0.0% (0)Unmarried:
100.0% (212)
Marital status - Asian population 15 years and over
Males 52.7% Never married42.6% Now married4.7% Separated0.0% Widowed0.0% DivorcedFemales 36.6% Never married49.1% Now married0.0% Separated14.3% Widowed0.0% DivorcedWomen who did not give birth in the past 12 months Now married:
28.6% (18)Unmarried:
71.4% (45)
Marital status - Native Hawaiian / Pacific Islander population 15 years and over
Males 44.4% Never married55.6% Now married0.0% Separated0.0% Widowed0.0% DivorcedFemales 0.0% Never married0.0% Now married0.0% Separated100.0% Widowed0.0% DivorcedMarital status - Other race population 15 years and over
Males 44.4% Never married48.5% Now married0.1% Separated0.0% Widowed7.0% DivorcedFemales 40.2% Never married37.7% Now married4.2% Separated1.2% Widowed16.8% DivorcedWomen who gave birth in the past 12 months Now married:
61.8% (23)Unmarried:
38.2% (14)
Women who did not give birth in the past 12 months Now married:
35.1% (252)Unmarried:
64.9% (466)
Marital status - Two or more races population 15 years and over
Males 52.6% Never married35.9% Now married1.1% Separated0.0% Widowed10.4% DivorcedFemales 35.1% Never married44.6% Now married5.0% Separated0.2% Widowed15.1% DivorcedWomen who did not give birth in the past 12 months Now married:
36.8% (170)Unmarried:
63.2% (291)
Marital status - White alone, not Hispanic / Latino population 15 years and over
Males 32.8% Never married48.4% Now married3.1% Separated1.2% Widowed14.5% DivorcedFemales 23.6% Never married50.5% Now married1.3% Separated6.6% Widowed18.1% DivorcedWomen who gave birth in the past 12 months Now married:
80.4% (131)Unmarried:
19.6% (32)
Women who did not give birth in the past 12 months Now married:
50.6% (1,280)Unmarried:
49.4% (1,252)
Marital status - Hispanic or Latino population 15 years and over
Males 44.7% Never married45.4% Now married0.0% Separated0.0% Widowed9.8% DivorcedFemales 34.2% Never married51.0% Now married1.9% Separated2.3% Widowed10.6% DivorcedWomen who gave birth in the past 12 months Now married:
71.0% (51)Unmarried:
29.0% (21)
Women who did not give birth in the past 12 months Now married:
47.2% (692)Unmarried:
52.8% (776)
Ancestries in Elko
850 8.5% American659 6.6% European565 5.6% Irish506 5.1% English365 3.6% German240 2.4% Basque134 1.3% Norwegian118 1.2% Italian79 0.8% Danish71 0.7% Scottish70 0.7% French69 0.7% Slovak50 0.5% Scotch-Irish35 0.3% Hungarian30 0.3% Ghanaian29 0.3% Czech29 0.3% French Canadian27 0.3% Eastern European23 0.2% African18 0.2% Swedish16 0.2% Dutch15 0.1% Canadian13 0.1% British11 0.1% Polish11 0.1% Welsh6 0.06% Russian3 0.03% Croatian3 0.03% Greek3 0.03% Northern European3 0.03% Portuguese1 0.01% Ukrainian
Geographical mobility in Elko Same house 1 year ago 10,705 81.2% White (Caucasian)166 79.6% Black or African American704 72.0% American Indian / Alaska Native158 55.0% Asian21 71.8% Native Hawaiian / Pacific Islander1,832 91.6% Other race3,072 87.9% Two or more races10,216 84.1% White alone, not Hispanic / Latino4,841 78.6% Hispanic or LatinoMoved within same county 1,304 9.9% White / Caucasian8 3.7% Black or African American152 15.6% American Indian / Alaska Native39 13.5% Asian124 6.2% Other race197 5.6% Two or more races950 7.8% White alone, not Hispanic / Latino787 12.8% Hispanic or LatinoMoved within same state 288 2.2% White / Caucasian10 5.0% Black or African American48 4.9% American Indian / Alaska Native69 24.1% Asian11 38.2% Native Hawaiian / Pacific Islander46 2.3% Other race14 0.4% Two or more races289 2.4% White alone, not Hispanic / Latino43 0.7% Hispanic or LatinoMoved from different state 860 6.5% White / Caucasian28 13.6% Black or African American14 5.0% Asian18 0.9% Other race211 6.0% Two or more races690 5.7% White alone, not Hispanic / Latino331 5.4% Hispanic or LatinoMoved from abroad 2 0.3% American Indian / Alaska Native
Children Nativity (place of birth) in Elko
Children under 6 years - Living with two parents Both parents native 1,236 100.0% NativeBoth parents foreign-born 31 100.0% NativeOne native, one foreign-born parent 71 100.0% NativeChildren under 6 years - Living with one parent Native parent 314 100.0% NativeChildren 6 to 17 years - Living with two parents Both parents native 1,549 100.0% NativeBoth parents foreign-born 113 100.0% NativeOne native, one foreign-born parent 171 100.0% NativeChildren 6 to 17 years - Living with one parent Native parent 805 100.0% NativeForeign-born parent 171 50.0% Native171 50.0% Foreign-born
Grandparents responsible for own grandchildren in Elko
Grandparents (30 to 59 years) White / Caucasian 63 55.3% Responsible for grandchildren51 44.7% Not responsible for grandchildrenAmerican Indian / Alaska Native 14 100.0% Responsible for grandchildrenAsian 16 100.0% Not responsible for grandchildrenOther race 27 100.0% Not responsible for grandchildrenWhite alone, not Hispanic / Latino 87 60.4% Responsible for grandchildren57 39.6% Not responsible for grandchildrenHispanic or Latino 30 100.0% Not responsible for grandchildrenGrandparents (60 years and over) White / Caucasian 31 43.0% Responsible for grandchildren42 57.0% Not responsible for grandchildrenAmerican Indian / Alaska Native 4 24.7% Responsible for grandchildren13 75.3% Not responsible for grandchildrenAsian 14 100.0% Responsible for grandchildrenOther race 9 15.8% Responsible for grandchildren50 84.2% Not responsible for grandchildrenWhite alone, not Hispanic / Latino 36 43.4% Responsible for grandchildren47 56.6% Not responsible for grandchildrenHispanic or Latino 7 9.1% Responsible for grandchildren66 90.9% Not responsible for grandchildren