Races in Elgin, Oklahoma (OK) Detailed Stats
Data:
Races - White alone (%)
Races - White alone (% change since 2000)
Races - Black alone (%)
Races - Black alone (% change since 2000)
Races - American Indian alone (%)
Races - American Indian alone (% change since 2000)
Races - Asian alone (%)
Races - Asian alone (% change since 2000)
Races - Hispanic (%)
Races - Hispanic (% change since 2000)
Races - Native Hawaiian and Other Pacific Islander alone (%)
Races - Native Hawaiian and Other Pacific Islander alone (% change since 2000)
Races - Two or more races(%)
Races - Two or more races(% change since 2000)
Races - Other race alone (%)
Races - Other race alone (% change since 2000)
Racial diversity
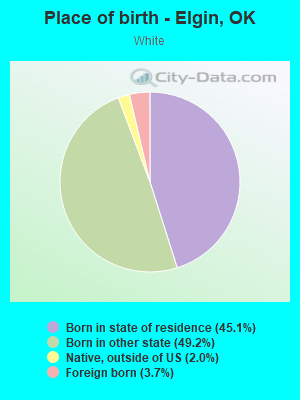
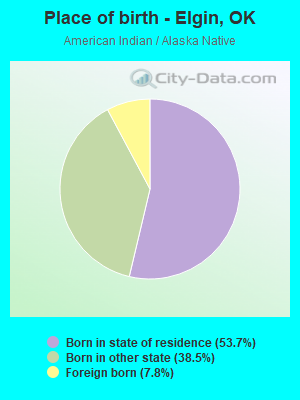
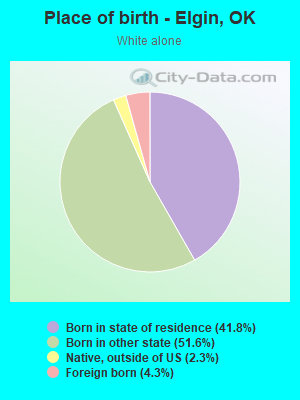
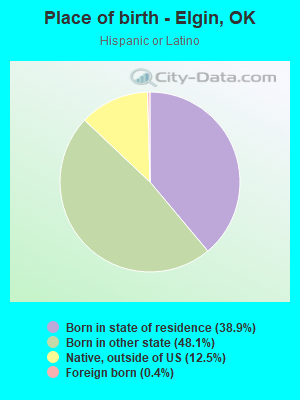
Place of birth - Born in state of residence (%)
Place of birth - Born in state of residence (%) - White
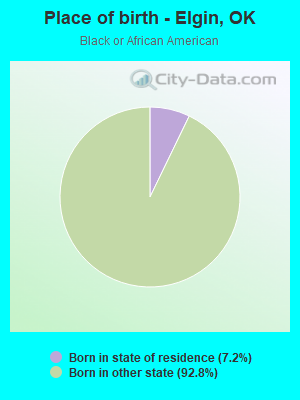
Place of birth - Born in state of residence (%) - Black or African American
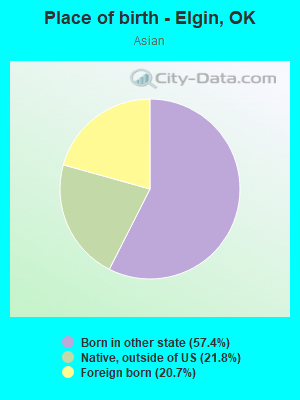
Place of birth - Born in state of residence (%) - Asian
Place of birth - Born in state of residence (%) - Hispanic or Latino
Place of birth - Born in state of residence (%) - American Indian and Alaska Native
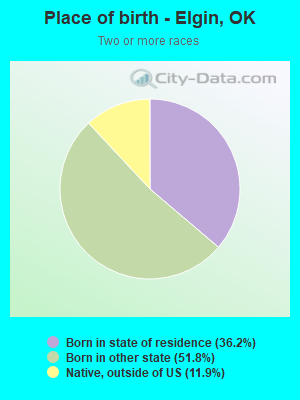
Place of birth - Born in state of residence (%) - Multirace
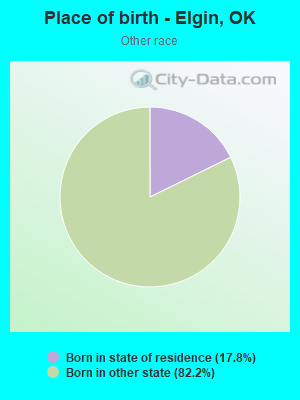
Place of birth - Born in state of residence (%) - Other Race
Place of birth - Born in other state (%)
Place of birth - Born in other state (%) - White
Place of birth - Born in other state (%) - Black or African American
Place of birth - Born in other state (%) - Asian
Place of birth - Born in other state (%) - Hispanic or Latino
Place of birth - Born in other state (%) - American Indian and Alaska Native
Place of birth - Born in other state (%) - Multirace
Place of birth - Born in other state (%) - Other Race
Place of birth - Native, outside of US (%)
Place of birth - Native, outside of US (%) - White
Place of birth - Native, outside of US (%) - Black or African American
Place of birth - Native, outside of US (%) - Asian
Place of birth - Native, outside of US (%) - Hispanic or Latino
Place of birth - Native, outside of US (%) - American Indian and Alaska Native
Place of birth - Native, outside of US (%) - Multirace
Place of birth - Native, outside of US (%) - Other Race
Place of birth - Foreign born (%)
Place of birth - Foreign born (%) - White
Place of birth - Foreign born (%) - Black or African American
Place of birth - Foreign born (%) - Asian
Place of birth - Foreign born (%) - Hispanic or Latino
Place of birth - Foreign born (%) - American Indian and Alaska Native
Place of birth - Foreign born (%) - Multirace
Place of birth - Foreign born (%) - Other Race
Residents speaking English at home (%)
Residents speaking English at home - Born in the United States (%)
Residents speaking English at home - Native, born elsewhere (%)
Residents speaking English at home - Foreign born (%)
Residents speaking Spanish at home (%)
Residents speaking Spanish at home - Born in the United States (%)
Residents speaking Spanish at home - Native, born elsewhere (%)
Residents speaking Spanish at home - Foreign born (%)
Residents speaking other language at home (%)
Residents speaking other language at home - Born in the United States (%)
Residents speaking other language at home - Native, born elsewhere (%)
Residents speaking other language at home - Foreign born (%)
Marital status - Never married (%)
Marital status - Now married (%)
Marital status - Separated (%)
Marital status - Widowed (%)
Marital status - Divorced (%)
Ancestries Reported - Arab (%)
Ancestries Reported - Czech (%)
Ancestries Reported - Danish (%)
Ancestries Reported - Dutch (%)
Ancestries Reported - English (%)
Ancestries Reported - French (%)
Ancestries Reported - French Canadian (%)
Ancestries Reported - German (%)
Ancestries Reported - Greek (%)
Ancestries Reported - Hungarian (%)
Ancestries Reported - Irish (%)
Ancestries Reported - Italian (%)
Ancestries Reported - Lithuanian (%)
Ancestries Reported - Norwegian (%)
Ancestries Reported - Polish (%)
Ancestries Reported - Portuguese (%)
Ancestries Reported - Russian (%)
Ancestries Reported - Scotch-Irish (%)
Ancestries Reported - Scottish (%)
Ancestries Reported - Slovak (%)
Ancestries Reported - Subsaharan African (%)
Ancestries Reported - Swedish (%)
Ancestries Reported - Swiss (%)
Ancestries Reported - Ukrainian (%)
Ancestries Reported - United States (%)
Ancestries Reported - Welsh (%)
Ancestries Reported - West Indian (%)
Ancestries Reported - Other (%)
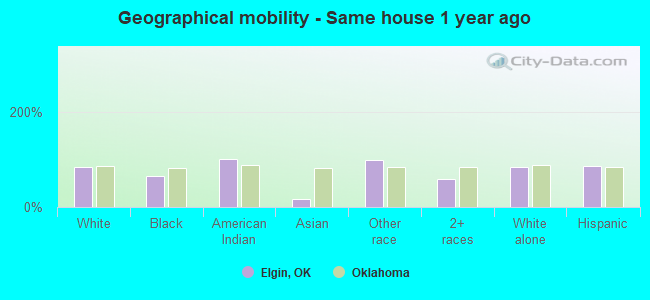
Geographical mobility - Same house 1 year ago (%)
Geographical mobility - Same house 1 year ago (%) - White
Geographical mobility - Same house 1 year ago (%) - Black or African American
Geographical mobility - Same house 1 year ago (%) - Asian
Geographical mobility - Same house 1 year ago (%) - Hispanic or Latino
Geographical mobility - Same house 1 year ago (%) - American Indian and Alaska Native
Geographical mobility - Same house 1 year ago (%) - Multirace
Geographical mobility - Same house 1 year ago (%) - Other Race
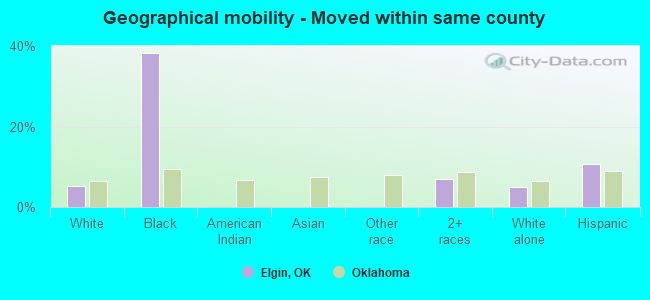
Geographical mobility - Moved within same county (%)
Geographical mobility - Moved within same county (%) - White
Geographical mobility - Moved within same county (%) - Black or African American
Geographical mobility - Moved within same county (%) - Asian
Geographical mobility - Moved within same county (%) - Hispanic or Latino
Geographical mobility - Moved within same county (%) - American Indian and Alaska Native
Geographical mobility - Moved within same county (%) - Multirace
Geographical mobility - Moved within same county (%) - Other Race
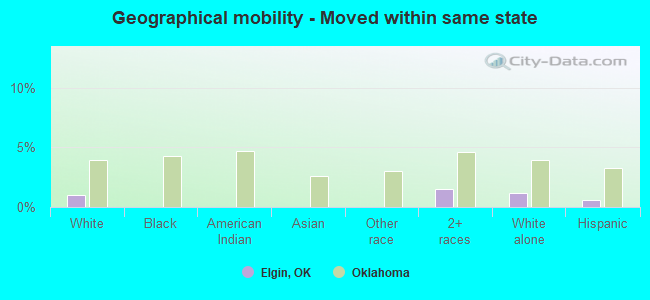
Geographical mobility - Moved from different county within same state (%)
Geographical mobility - Moved from different county within same state (%) - White
Geographical mobility - Moved from different county within same state (%) - Black or African American
Geographical mobility - Moved from different county within same state (%) - Asian
Geographical mobility - Moved from different county within same state (%) - Hispanic or Latino
Geographical mobility - Moved from different county within same state (%) - American Indian and Alaska Native
Geographical mobility - Moved from different county within same state (%) - Multirace
Geographical mobility - Moved from different county within same state (%) - Other Race
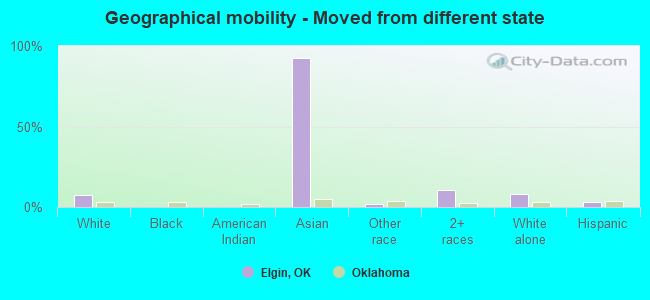
Geographical mobility - Moved from different state (%)
Geographical mobility - Moved from different state (%) - White
Geographical mobility - Moved from different state (%) - Black or African American
Geographical mobility - Moved from different state (%) - Asian
Geographical mobility - Moved from different state (%) - Hispanic or Latino
Geographical mobility - Moved from different state (%) - American Indian and Alaska Native
Geographical mobility - Moved from different state (%) - Multirace
Geographical mobility - Moved from different state (%) - Other Race
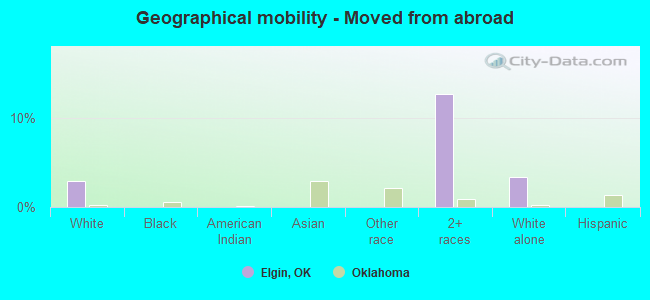
Geographical mobility - Moved from abroad (%)
Geographical mobility - Moved from abroad (%) - White
Geographical mobility - Moved from abroad (%) - Black or African American
Geographical mobility - Moved from abroad (%) - Asian
Geographical mobility - Moved from abroad (%) - Hispanic or Latino
Geographical mobility - Moved from abroad (%) - American Indian and Alaska Native
Geographical mobility - Moved from abroad (%) - Multirace
Geographical mobility - Moved from abroad (%) - Other Race
Place of birth for the foreign-born population - Ireland (%)
Place of birth for the foreign-born population - Denmark (%)
Place of birth for the foreign-born population - Norway (%)
Place of birth for the foreign-born population - Sweden (%)
Place of birth for the foreign-born population - United Kingdom (%)
Place of birth for the foreign-born population - England (%)
Place of birth for the foreign-born population - Scotland (%)
Place of birth for the foreign-born population - Other Northern Europe (%)
Place of birth for the foreign-born population - Austria (%)
Place of birth for the foreign-born population - Belgium (%)
Place of birth for the foreign-born population - France (%)
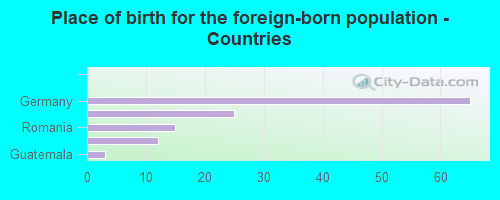
Place of birth for the foreign-born population - Germany (%)
Place of birth for the foreign-born population - Netherlands (%)
Place of birth for the foreign-born population - Switzerland (%)
Place of birth for the foreign-born population - Other Western Europe (%)
Place of birth for the foreign-born population - Greece (%)
Place of birth for the foreign-born population - Italy (%)
Place of birth for the foreign-born population - Portugal (%)
Place of birth for the foreign-born population - Spain (%)
Place of birth for the foreign-born population - Other Southern Europe (%)
Place of birth for the foreign-born population - Albania (%)
Place of birth for the foreign-born population - Belarus (%)
Place of birth for the foreign-born population - Bosnia and Herzegovina (%)
Place of birth for the foreign-born population - Bulgaria (%)
Place of birth for the foreign-born population - Croatia (%)
Place of birth for the foreign-born population - Czechoslovakia (%)
Place of birth for the foreign-born population - Hungary (%)
Place of birth for the foreign-born population - Latvia (%)
Place of birth for the foreign-born population - Lithuania (%)
Place of birth for the foreign-born population - North Macedonia (Macedonia) (%)
Place of birth for the foreign-born population - Moldova (%)
Place of birth for the foreign-born population - Poland (%)
Place of birth for the foreign-born population - Romania (%)
Place of birth for the foreign-born population - Russia (%)
Place of birth for the foreign-born population - Serbia (%)
Place of birth for the foreign-born population - Ukraine (%)
Place of birth for the foreign-born population - Other Eastern Europe (%)
Place of birth for the foreign-born population - China (%)
Place of birth for the foreign-born population - Hong Kong (%)
Place of birth for the foreign-born population - Taiwan (%)
Place of birth for the foreign-born population - Japan (%)
Place of birth for the foreign-born population - Korea (%)
Place of birth for the foreign-born population - Other Eastern Asia (%)
Place of birth for the foreign-born population - Afghanistan (%)
Place of birth for the foreign-born population - Bangladesh (%)
Place of birth for the foreign-born population - India (%)
Place of birth for the foreign-born population - Iran (%)
Place of birth for the foreign-born population - Kazakhstan (%)
Place of birth for the foreign-born population - Nepal (%)
Place of birth for the foreign-born population - Pakistan (%)
Place of birth for the foreign-born population - Sri Lanka (%)
Place of birth for the foreign-born population - Uzbekistan (%)
Place of birth for the foreign-born population - Other South Central Asia (%)
Place of birth for the foreign-born population - Burma (%)
Place of birth for the foreign-born population - Cambodia (%)
Place of birth for the foreign-born population - Indonesia (%)
Place of birth for the foreign-born population - Laos (%)
Place of birth for the foreign-born population - Malaysia (%)
Place of birth for the foreign-born population - Philippines (%)
Place of birth for the foreign-born population - Singapore (%)
Place of birth for the foreign-born population - Thailand (%)
Place of birth for the foreign-born population - Vietnam (%)
Place of birth for the foreign-born population - Other South Eastern Asia (%)
Place of birth for the foreign-born population - Armenia (%)
Place of birth for the foreign-born population - Iraq (%)
Place of birth for the foreign-born population - Israel (%)
Place of birth for the foreign-born population - Jordan (%)
Place of birth for the foreign-born population - Kuwait (%)
Place of birth for the foreign-born population - Lebanon (%)
Place of birth for the foreign-born population - Saudi Arabia (%)
Place of birth for the foreign-born population - Syria (%)
Place of birth for the foreign-born population - Turkey (%)
Place of birth for the foreign-born population - Yemen (%)
Place of birth for the foreign-born population - Other Western Asia (%)
Place of birth for the foreign-born population - Eritrea (%)
Place of birth for the foreign-born population - Ethiopia (%)
Place of birth for the foreign-born population - Kenya (%)
Place of birth for the foreign-born population - Somalia (%)
Place of birth for the foreign-born population - Uganda (%)
Place of birth for the foreign-born population - Zimbabwe (%)
Place of birth for the foreign-born population - Other Eastern Africa (%)
Place of birth for the foreign-born population - Cameroon (%)
Place of birth for the foreign-born population - Congo (%)
Place of birth for the foreign-born population - Democratic Republic of Congo (Zaire) (%)
Place of birth for the foreign-born population - Other Middle Africa (%)
Place of birth for the foreign-born population - Egypt (%)
Place of birth for the foreign-born population - Morocco (%)
Place of birth for the foreign-born population - Sudan (%)
Place of birth for the foreign-born population - Other Northern Africa (%)
Place of birth for the foreign-born population - South Africa (%)
Place of birth for the foreign-born population - Other Southern Africa (%)
Place of birth for the foreign-born population - Cabo Verde (%)
Place of birth for the foreign-born population - Ghana (%)
Place of birth for the foreign-born population - Liberia (%)
Place of birth for the foreign-born population - Nigeria (%)
Place of birth for the foreign-born population - Senegal (%)
Place of birth for the foreign-born population - Sierra Leone (%)
Place of birth for the foreign-born population - Other Western Africa (%)
Place of birth for the foreign-born population - Australia (%)
Place of birth for the foreign-born population - New Zealand (%)
Place of birth for the foreign-born population - Fiji (%)
Place of birth for the foreign-born population - Micronesia (%)
Place of birth for the foreign-born population - Bahamas (%)
Place of birth for the foreign-born population - Barbados (%)
Place of birth for the foreign-born population - Cuba (%)
Place of birth for the foreign-born population - Dominica (%)
Place of birth for the foreign-born population - Dominican Republic (%)
Place of birth for the foreign-born population - Grenada (%)
Place of birth for the foreign-born population - Haiti (%)
Place of birth for the foreign-born population - Jamaica (%)
Place of birth for the foreign-born population - St. Vincent and the Grenadines (%)
Place of birth for the foreign-born population - Trinidad and Tobago (%)
Place of birth for the foreign-born population - West Indies (%)
Place of birth for the foreign-born population - Other Caribbean (%)
Place of birth for the foreign-born population - Belize (%)
Place of birth for the foreign-born population - Costa Rica (%)
Place of birth for the foreign-born population - El Salvador (%)
Place of birth for the foreign-born population - Guatemala (%)
Place of birth for the foreign-born population - Honduras (%)
Place of birth for the foreign-born population - Mexico (%)
Place of birth for the foreign-born population - Nicaragua (%)
Place of birth for the foreign-born population - Panama (%)
Place of birth for the foreign-born population - Other Central America (%)
Place of birth for the foreign-born population - Argentina (%)
Place of birth for the foreign-born population - Bolivia (%)
Place of birth for the foreign-born population - Brazil (%)
Place of birth for the foreign-born population - Chile (%)
Place of birth for the foreign-born population - Colombia (%)
Place of birth for the foreign-born population - Ecuador (%)
Place of birth for the foreign-born population - Guyana (%)
Place of birth for the foreign-born population - Peru (%)
Place of birth for the foreign-born population - Uruguay (%)
Place of birth for the foreign-born population - Venezuela (%)
Place of birth for the foreign-born population - Other South America (%)
Place of birth for the foreign-born population - Canada (%)
Place of birth for the foreign-born population - Other Northern America (%)
Place of birth for the foreign-born population - Other (%)
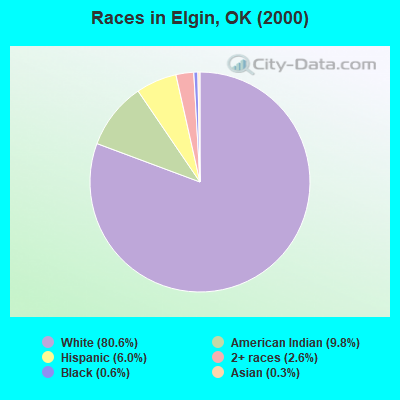
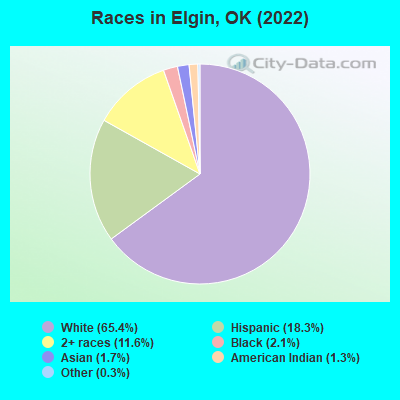
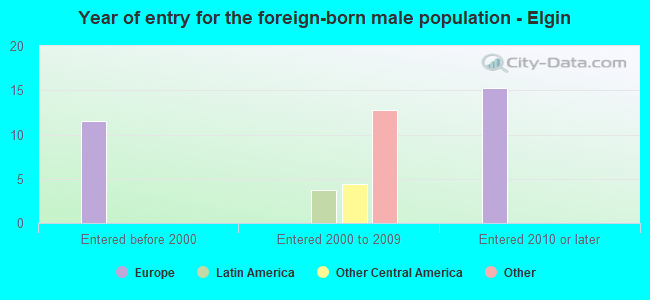
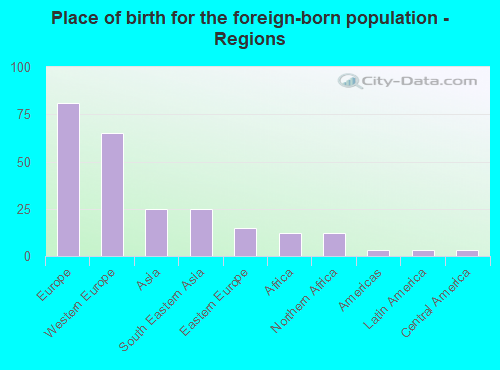
According to 2022 data, the most numerous races in Elgin, OK are White alone (2,313 residents), Hispanic (646 residents), and Two or more races (411 residents). 92.3% of Elgin residents speak English at home. 3.5% of Elgin, OK residents are foreign-born (2.3% born in Europe, 0.7% born in Asia, 0.4% born in Africa), which is 71.0% less than the foreign-born rate of 6.0% across the entire state of Oklahoma.
Race distribution in Elgin
2000 2022
2,556,368 74.1% White alone 266,158 7.7% American Indian alone 257,981 7.5% Black alone 179,304 5.2% Hispanic 140,249 4.1% Two or more races 46,172 1.3% Asian alone 2,322 0.07% Other race alone 2,100 0.06% Native Hawaiian and Other
2,517,403 62.6% White alone 486,692 12.1% Hispanic 364,453 9.1% Two or more races 273,650 6.8% American Indian alone 268,543 6.7% Black alone 92,672 2.3% Asian alone 10,786 0.3% Other race alone 5,601 0.1% Native Hawaiian and Other
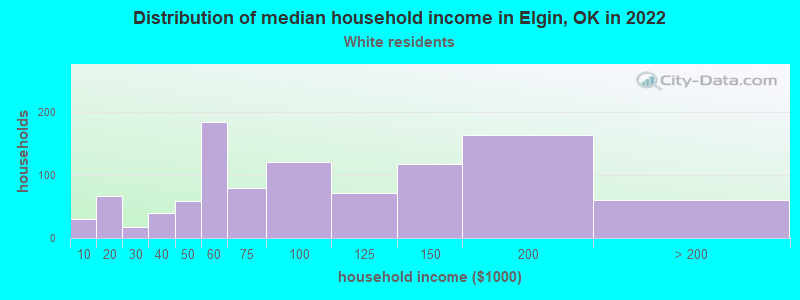
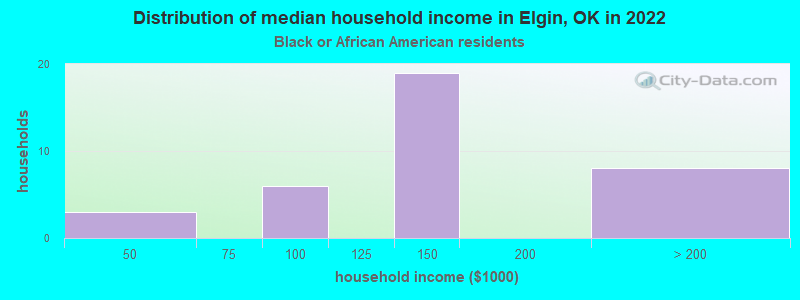
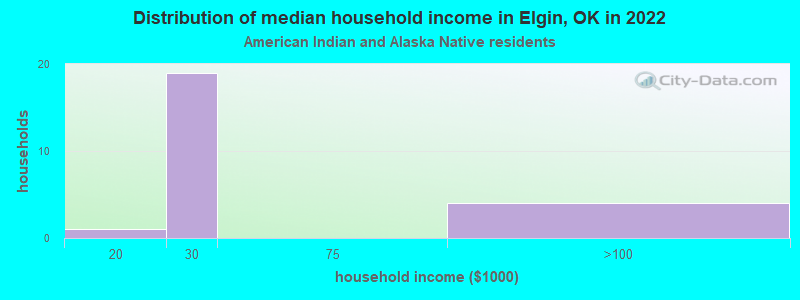
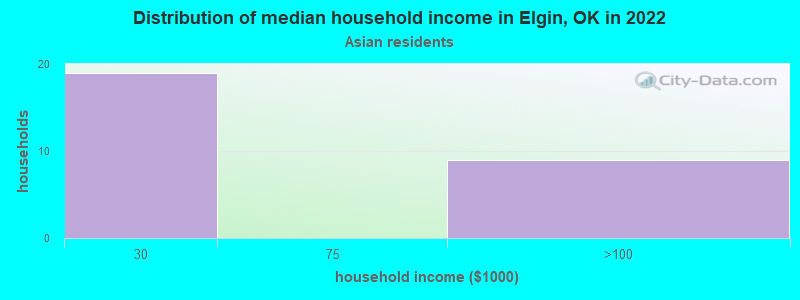
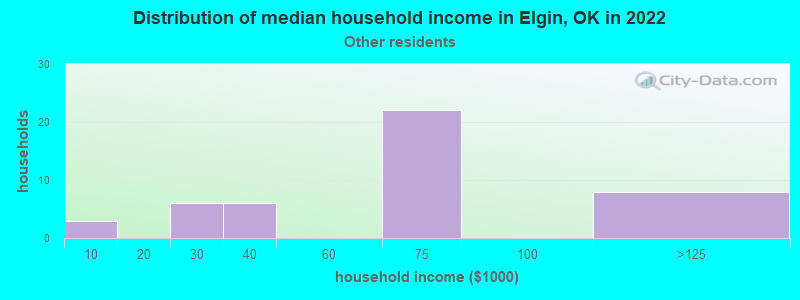
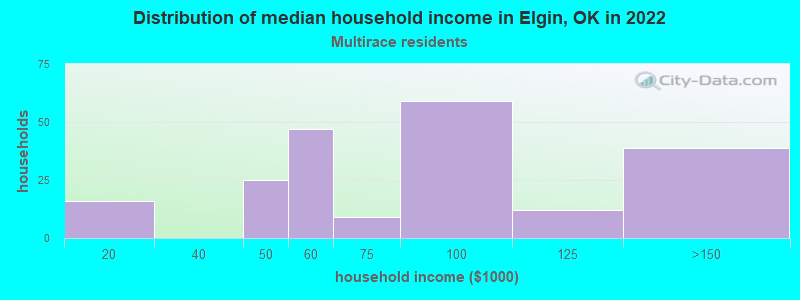
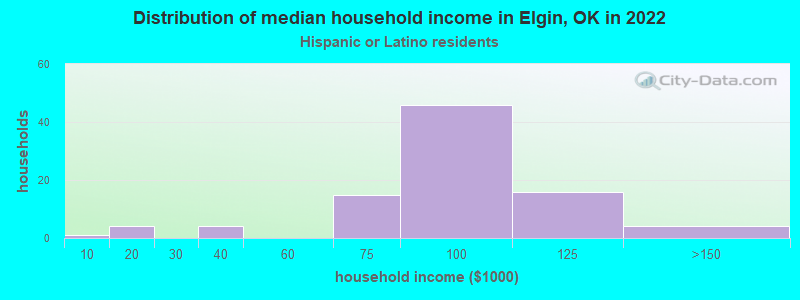
Income and house value in Elgin Median household income in 2022 $78,454 White non-Hispanic householders$124,605 Black householders$57,428 Some other race householders$77,336 Two or more races householders$73,838 Hispanic or Latino race householdersMedian 2022 house value $242,711 White Non-Hispanic householders$285,612 American Indian or Alaska Native householders$258,203 Some other race householders$218,479 Two or more races householders$258,203 Hispanic or Latino householders
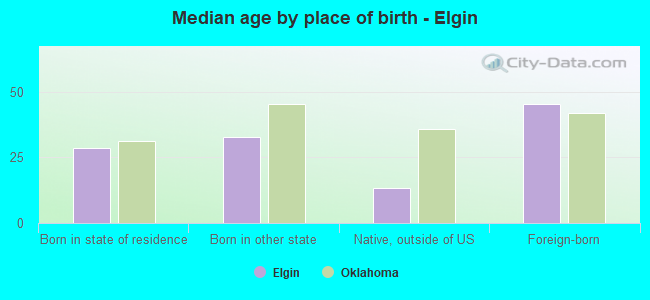
Median age by race in Elgin
33.6 Median age for White residents38.0 31.1 42.7 Median age for Black or African American residents31.5 48.2 29.6 Median age for American Indian / Alaska Native residents11.7 32.7 25.7 Median age for Asian residents-442,798,353.5 42.0 -757,396,448.9 Median age for Native Hawaiian / Pacific Islander residents-662,710,187.3 -767,251,461.2 34.3 Median age for Other race residents13.8 36.6 15.3 Median age for Two or more races residents14.5 16.3 35.2 Median age for White alone residents38.1 34.2 24.9 Median age for Hispanic or Latino residents18.9 23.3
Owner/renter occupied households by race in Elgin
House owners and renters - White residents 727 70.4% Owner occupied305 29.6% Renter occupiedHouse owners and renters - Black or African American residents 14 48.6% Owner occupied15 51.4% Renter occupiedHouse owners and renters - American Indian / Alaska Native residents 15 86.7% Owner occupied2 13.3% Renter occupiedHouse owners and renters - Asian residents 26 100.0% Renter occupiedHouse owners and renters - Other race residents 21 74.5% Owner occupied7 25.5% Renter occupiedHouse owners and renters - Two or more races residents 133 72.9% Owner occupied49 27.1% Renter occupiedHouse owners and renters - White alone residents 736 71.4% Owner occupied295 28.6% Renter occupiedHouse owners and renters - Hispanic or Latino residents 90 79.0% Owner occupied24 21.0% Renter occupied
Language usage in Elgin
English speakers - Total 92.3% of residents of Elgin speak English at home.
4.7% of residents speak Spanish at home 105 67.7% Speak English very well50 32.3% Speak English less than very well3.2% of residents speak other language at home 100 94.3% Speak English very well6 5.7% Speak English less than very well
English speakers - Born in the United States 94.7% of residents of Elgin speak English at home.
4.3% of residents speak Spanish at home 76 100.0% Speak English very well0.8% of residents speak other language at home 8 57.1% Speak English very well6 42.9% Speak English less than very well
English speakers - Native, born elsewhere 49.1% of residents of Elgin speak English at home.
44.7% of residents speak Spanish at home 9 17.6% Speak English very well42 82.4% Speak English less than very well
English speakers - Foreign-born 33.3% of residents of Elgin speak English at home.
3.1% of residents speak Spanish at home 3 100.0% Speak English very well91.7% of residents speak other language at home 88 100.0% Speak English very well
White (Caucasian) - Speak only English Native:
97.7% (2,102)Foreign-born:
25.8% (24)
White (Caucasian) - Speak another language Native:
2.2% (47)Foreign-born:
76.5% (70)
American Indian / Alaska Native - Speak another language Native:
45.5% (19)Foreign-born:
100.0% (5)
Asian - Speak only English Native:
100.0% (37)Foreign-born:
49.0% (8)
White alone - Speak only English Native:
98.6% (1,999)Foreign-born:
24.3% (25)
White alone - Speak another language Native:
1.4% (28)Foreign-born:
80.0% (83)
Hispanic or Latino - Speak another language Native:
25.7% (164)Foreign-born:
79.3% (2)
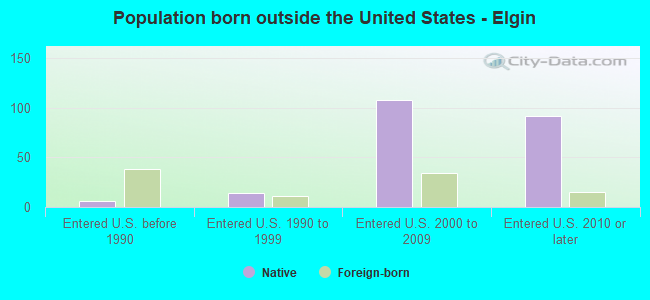
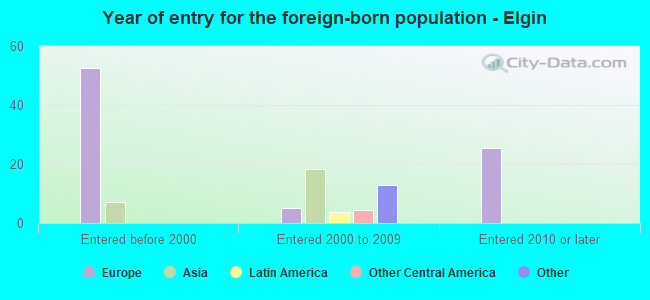
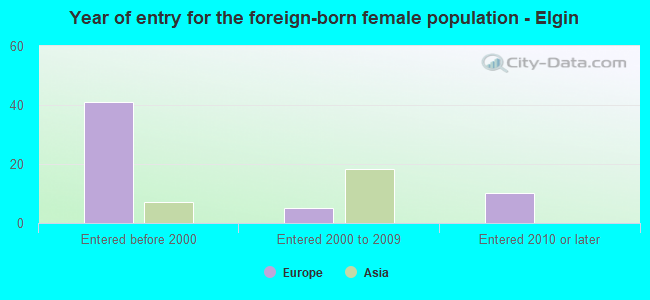
Foreign-born residents in Elgin 124 residents are foreign born (2.3% Europe , 0.7% Asia , 0.4% Africa ).
This city:
3.5%Oklahoma:
6.1%
Marital status for residents in Elgin Marital status - White (Caucasian) population 15 years and over
Males 25.2% Never married58.0% Now married3.1% Separated7.6% Widowed6.2% DivorcedFemales 18.1% Never married57.9% Now married0.5% Separated4.4% Widowed19.0% DivorcedWomen who gave birth in the past 12 months Now married:
95.6% (41)Unmarried:
4.4% (2)
Women who did not give birth in the past 12 months Now married:
55.6% (317)Unmarried:
44.4% (253)
Marital status - Black or African American population 15 years and over
Males 17.5% Never married82.5% Now married0.0% Separated0.0% Widowed0.0% DivorcedFemales 26.5% Never married73.5% Now married0.0% Separated0.0% Widowed0.0% DivorcedWomen who did not give birth in the past 12 months Now married:
50.0% (9)Unmarried:
50.0% (9)
Marital status - American Indian / Alaska Native population 15 years and over
Males 33.3% Never married66.7% Now married0.0% Separated0.0% Widowed0.0% DivorcedFemales 27.3% Never married45.5% Now married0.0% Separated0.0% Widowed27.3% DivorcedWomen who did not give birth in the past 12 months Now married:
62.5% (9)Unmarried:
37.5% (5)
Marital status - Asian population 15 years and over
Males 0.0% Never married100.0% Now married0.0% Separated0.0% Widowed0.0% DivorcedFemales 0.0% Never married100.0% Now married0.0% Separated0.0% Widowed0.0% DivorcedWomen who did not give birth in the past 12 months Now married:
100.0% (26)Unmarried:
0.0% (0)
Marital status - Other race population 15 years and over
Males 29.6% Never married70.4% Now married0.0% Separated0.0% Widowed0.0% DivorcedFemales 8.2% Never married91.8% Now married0.0% Separated0.0% Widowed0.0% DivorcedWomen who did not give birth in the past 12 months Now married:
90.7% (57)Unmarried:
9.3% (6)
Marital status - Two or more races population 15 years and over
Males 27.5% Never married63.4% Now married0.0% Separated0.0% Widowed9.2% DivorcedFemales 29.8% Never married62.9% Now married0.0% Separated0.0% Widowed7.3% DivorcedWomen who did not give birth in the past 12 months Now married:
62.3% (159)Unmarried:
37.7% (96)
Marital status - White alone, not Hispanic / Latino population 15 years and over
Males 24.5% Never married58.4% Now married3.1% Separated7.7% Widowed6.3% DivorcedFemales 11.0% Never married61.9% Now married0.6% Separated5.0% Widowed21.5% DivorcedWomen who gave birth in the past 12 months Now married:
95.6% (43)Unmarried:
4.4% (2)
Women who did not give birth in the past 12 months Now married:
61.7% (300)Unmarried:
38.3% (186)
Marital status - Hispanic or Latino population 15 years and over
Males 37.5% Never married62.5% Now married0.0% Separated0.0% Widowed0.0% DivorcedFemales 40.8% Never married59.2% Now married0.0% Separated0.0% Widowed0.0% DivorcedWomen who did not give birth in the past 12 months Now married:
58.0% (155)Unmarried:
42.0% (112)
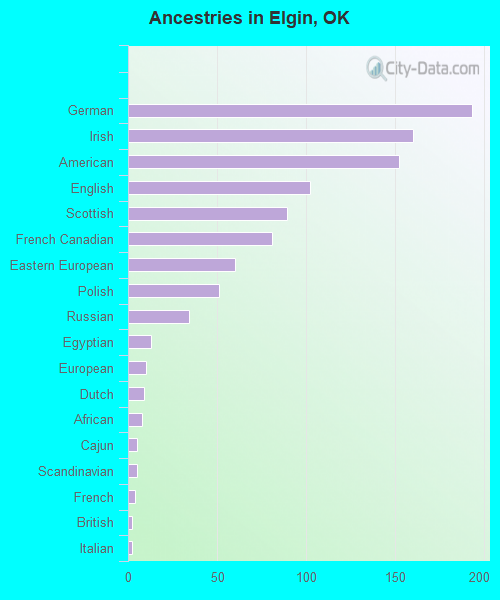
Ancestries in Elgin
193 10.9% German160 9.0% Irish152 8.6% American102 5.8% English89 5.0% Scottish81 4.6% French Canadian60 3.4% Eastern European51 2.9% Polish34 1.9% Russian13 0.7% Egyptian10 0.6% European9 0.5% Dutch8 0.5% African5 0.3% Cajun5 0.3% Scandinavian4 0.2% French2 0.1% British2 0.1% Italian
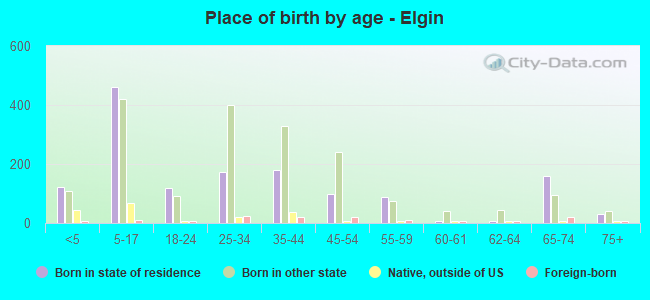
Children Nativity (place of birth) in Elgin
Children under 6 years - Living with two parents Both parents native 266 100.0% NativeBoth parents foreign-born 33 100.0% NativeOne native, one foreign-born parent 11 100.0% NativeChildren under 6 years - Living with one parent Native parent 34 100.0% NativeChildren 6 to 17 years - Living with two parents Both parents native 673 100.0% Native0 0.0% Foreign-bornBoth parents foreign-born 27 100.0% NativeOne native, one foreign-born parent 13 100.0% Foreign-bornChildren 6 to 17 years - Living with one parent Native parent 117 100.0% NativeForeign-born parent 14 49.9% Native14 50.1% Foreign-born
Grandparents responsible for own grandchildren in Elgin
Grandparents (30 to 59 years) White / Caucasian 15 100.0% Not responsible for grandchildrenWhite alone, not Hispanic / Latino 19 100.0% Not responsible for grandchildrenGrandparents (60 years and over) White / Caucasian 20 60.0% Responsible for grandchildren14 40.0% Not responsible for grandchildrenWhite alone, not Hispanic / Latino 20 57.6% Responsible for grandchildren15 42.4% Not responsible for grandchildren