Races in El Cerro Mission, New Mexico (NM) Detailed Stats
Data:
Races - White alone (%)
Races - White alone (% change since 2000)
Races - Black alone (%)
Races - Black alone (% change since 2000)
Races - American Indian alone (%)
Races - American Indian alone (% change since 2000)
Races - Asian alone (%)
Races - Asian alone (% change since 2000)
Races - Hispanic (%)
Races - Hispanic (% change since 2000)
Races - Native Hawaiian and Other Pacific Islander alone (%)
Races - Native Hawaiian and Other Pacific Islander alone (% change since 2000)
Races - Two or more races(%)
Races - Two or more races(% change since 2000)
Races - Other race alone (%)
Races - Other race alone (% change since 2000)
Racial diversity
Place of birth - Born in state of residence (%)
Place of birth - Born in state of residence (%) - White
Place of birth - Born in state of residence (%) - Black or African American
Place of birth - Born in state of residence (%) - Asian
Place of birth - Born in state of residence (%) - Hispanic or Latino
Place of birth - Born in state of residence (%) - American Indian and Alaska Native
Place of birth - Born in state of residence (%) - Multirace
Place of birth - Born in state of residence (%) - Other Race
Place of birth - Born in other state (%)
Place of birth - Born in other state (%) - White
Place of birth - Born in other state (%) - Black or African American
Place of birth - Born in other state (%) - Asian
Place of birth - Born in other state (%) - Hispanic or Latino
Place of birth - Born in other state (%) - American Indian and Alaska Native
Place of birth - Born in other state (%) - Multirace
Place of birth - Born in other state (%) - Other Race
Place of birth - Native, outside of US (%)
Place of birth - Native, outside of US (%) - White
Place of birth - Native, outside of US (%) - Black or African American
Place of birth - Native, outside of US (%) - Asian
Place of birth - Native, outside of US (%) - Hispanic or Latino
Place of birth - Native, outside of US (%) - American Indian and Alaska Native
Place of birth - Native, outside of US (%) - Multirace
Place of birth - Native, outside of US (%) - Other Race
Place of birth - Foreign born (%)
Place of birth - Foreign born (%) - White
Place of birth - Foreign born (%) - Black or African American
Place of birth - Foreign born (%) - Asian
Place of birth - Foreign born (%) - Hispanic or Latino
Place of birth - Foreign born (%) - American Indian and Alaska Native
Place of birth - Foreign born (%) - Multirace
Place of birth - Foreign born (%) - Other Race
Residents speaking English at home (%)
Residents speaking English at home - Born in the United States (%)
Residents speaking English at home - Native, born elsewhere (%)
Residents speaking English at home - Foreign born (%)
Residents speaking Spanish at home (%)
Residents speaking Spanish at home - Born in the United States (%)
Residents speaking Spanish at home - Native, born elsewhere (%)
Residents speaking Spanish at home - Foreign born (%)
Residents speaking other language at home (%)
Residents speaking other language at home - Born in the United States (%)
Residents speaking other language at home - Native, born elsewhere (%)
Residents speaking other language at home - Foreign born (%)
Marital status - Never married (%)
Marital status - Now married (%)
Marital status - Separated (%)
Marital status - Widowed (%)
Marital status - Divorced (%)
Ancestries Reported - Arab (%)
Ancestries Reported - Czech (%)
Ancestries Reported - Danish (%)
Ancestries Reported - Dutch (%)
Ancestries Reported - English (%)
Ancestries Reported - French (%)
Ancestries Reported - French Canadian (%)
Ancestries Reported - German (%)
Ancestries Reported - Greek (%)
Ancestries Reported - Hungarian (%)
Ancestries Reported - Irish (%)
Ancestries Reported - Italian (%)
Ancestries Reported - Lithuanian (%)
Ancestries Reported - Norwegian (%)
Ancestries Reported - Polish (%)
Ancestries Reported - Portuguese (%)
Ancestries Reported - Russian (%)
Ancestries Reported - Scotch-Irish (%)
Ancestries Reported - Scottish (%)
Ancestries Reported - Slovak (%)
Ancestries Reported - Subsaharan African (%)
Ancestries Reported - Swedish (%)
Ancestries Reported - Swiss (%)
Ancestries Reported - Ukrainian (%)
Ancestries Reported - United States (%)
Ancestries Reported - Welsh (%)
Ancestries Reported - West Indian (%)
Ancestries Reported - Other (%)
Geographical mobility - Same house 1 year ago (%)
Geographical mobility - Same house 1 year ago (%) - White
Geographical mobility - Same house 1 year ago (%) - Black or African American
Geographical mobility - Same house 1 year ago (%) - Asian
Geographical mobility - Same house 1 year ago (%) - Hispanic or Latino
Geographical mobility - Same house 1 year ago (%) - American Indian and Alaska Native
Geographical mobility - Same house 1 year ago (%) - Multirace
Geographical mobility - Same house 1 year ago (%) - Other Race
Geographical mobility - Moved within same county (%)
Geographical mobility - Moved within same county (%) - White
Geographical mobility - Moved within same county (%) - Black or African American
Geographical mobility - Moved within same county (%) - Asian
Geographical mobility - Moved within same county (%) - Hispanic or Latino
Geographical mobility - Moved within same county (%) - American Indian and Alaska Native
Geographical mobility - Moved within same county (%) - Multirace
Geographical mobility - Moved within same county (%) - Other Race
Geographical mobility - Moved from different county within same state (%)
Geographical mobility - Moved from different county within same state (%) - White
Geographical mobility - Moved from different county within same state (%) - Black or African American
Geographical mobility - Moved from different county within same state (%) - Asian
Geographical mobility - Moved from different county within same state (%) - Hispanic or Latino
Geographical mobility - Moved from different county within same state (%) - American Indian and Alaska Native
Geographical mobility - Moved from different county within same state (%) - Multirace
Geographical mobility - Moved from different county within same state (%) - Other Race
Geographical mobility - Moved from different state (%)
Geographical mobility - Moved from different state (%) - White
Geographical mobility - Moved from different state (%) - Black or African American
Geographical mobility - Moved from different state (%) - Asian
Geographical mobility - Moved from different state (%) - Hispanic or Latino
Geographical mobility - Moved from different state (%) - American Indian and Alaska Native
Geographical mobility - Moved from different state (%) - Multirace
Geographical mobility - Moved from different state (%) - Other Race
Geographical mobility - Moved from abroad (%)
Geographical mobility - Moved from abroad (%) - White
Geographical mobility - Moved from abroad (%) - Black or African American
Geographical mobility - Moved from abroad (%) - Asian
Geographical mobility - Moved from abroad (%) - Hispanic or Latino
Geographical mobility - Moved from abroad (%) - American Indian and Alaska Native
Geographical mobility - Moved from abroad (%) - Multirace
Geographical mobility - Moved from abroad (%) - Other Race
Place of birth for the foreign-born population - Ireland (%)
Place of birth for the foreign-born population - Denmark (%)
Place of birth for the foreign-born population - Norway (%)
Place of birth for the foreign-born population - Sweden (%)
Place of birth for the foreign-born population - United Kingdom (%)
Place of birth for the foreign-born population - England (%)
Place of birth for the foreign-born population - Scotland (%)
Place of birth for the foreign-born population - Other Northern Europe (%)
Place of birth for the foreign-born population - Austria (%)
Place of birth for the foreign-born population - Belgium (%)
Place of birth for the foreign-born population - France (%)
Place of birth for the foreign-born population - Germany (%)
Place of birth for the foreign-born population - Netherlands (%)
Place of birth for the foreign-born population - Switzerland (%)
Place of birth for the foreign-born population - Other Western Europe (%)
Place of birth for the foreign-born population - Greece (%)
Place of birth for the foreign-born population - Italy (%)
Place of birth for the foreign-born population - Portugal (%)
Place of birth for the foreign-born population - Spain (%)
Place of birth for the foreign-born population - Other Southern Europe (%)
Place of birth for the foreign-born population - Albania (%)
Place of birth for the foreign-born population - Belarus (%)
Place of birth for the foreign-born population - Bosnia and Herzegovina (%)
Place of birth for the foreign-born population - Bulgaria (%)
Place of birth for the foreign-born population - Croatia (%)
Place of birth for the foreign-born population - Czechoslovakia (%)
Place of birth for the foreign-born population - Hungary (%)
Place of birth for the foreign-born population - Latvia (%)
Place of birth for the foreign-born population - Lithuania (%)
Place of birth for the foreign-born population - North Macedonia (Macedonia) (%)
Place of birth for the foreign-born population - Moldova (%)
Place of birth for the foreign-born population - Poland (%)
Place of birth for the foreign-born population - Romania (%)
Place of birth for the foreign-born population - Russia (%)
Place of birth for the foreign-born population - Serbia (%)
Place of birth for the foreign-born population - Ukraine (%)
Place of birth for the foreign-born population - Other Eastern Europe (%)
Place of birth for the foreign-born population - China (%)
Place of birth for the foreign-born population - Hong Kong (%)
Place of birth for the foreign-born population - Taiwan (%)
Place of birth for the foreign-born population - Japan (%)
Place of birth for the foreign-born population - Korea (%)
Place of birth for the foreign-born population - Other Eastern Asia (%)
Place of birth for the foreign-born population - Afghanistan (%)
Place of birth for the foreign-born population - Bangladesh (%)
Place of birth for the foreign-born population - India (%)
Place of birth for the foreign-born population - Iran (%)
Place of birth for the foreign-born population - Kazakhstan (%)
Place of birth for the foreign-born population - Nepal (%)
Place of birth for the foreign-born population - Pakistan (%)
Place of birth for the foreign-born population - Sri Lanka (%)
Place of birth for the foreign-born population - Uzbekistan (%)
Place of birth for the foreign-born population - Other South Central Asia (%)
Place of birth for the foreign-born population - Burma (%)
Place of birth for the foreign-born population - Cambodia (%)
Place of birth for the foreign-born population - Indonesia (%)
Place of birth for the foreign-born population - Laos (%)
Place of birth for the foreign-born population - Malaysia (%)
Place of birth for the foreign-born population - Philippines (%)
Place of birth for the foreign-born population - Singapore (%)
Place of birth for the foreign-born population - Thailand (%)
Place of birth for the foreign-born population - Vietnam (%)
Place of birth for the foreign-born population - Other South Eastern Asia (%)
Place of birth for the foreign-born population - Armenia (%)
Place of birth for the foreign-born population - Iraq (%)
Place of birth for the foreign-born population - Israel (%)
Place of birth for the foreign-born population - Jordan (%)
Place of birth for the foreign-born population - Kuwait (%)
Place of birth for the foreign-born population - Lebanon (%)
Place of birth for the foreign-born population - Saudi Arabia (%)
Place of birth for the foreign-born population - Syria (%)
Place of birth for the foreign-born population - Turkey (%)
Place of birth for the foreign-born population - Yemen (%)
Place of birth for the foreign-born population - Other Western Asia (%)
Place of birth for the foreign-born population - Eritrea (%)
Place of birth for the foreign-born population - Ethiopia (%)
Place of birth for the foreign-born population - Kenya (%)
Place of birth for the foreign-born population - Somalia (%)
Place of birth for the foreign-born population - Uganda (%)
Place of birth for the foreign-born population - Zimbabwe (%)
Place of birth for the foreign-born population - Other Eastern Africa (%)
Place of birth for the foreign-born population - Cameroon (%)
Place of birth for the foreign-born population - Congo (%)
Place of birth for the foreign-born population - Democratic Republic of Congo (Zaire) (%)
Place of birth for the foreign-born population - Other Middle Africa (%)
Place of birth for the foreign-born population - Egypt (%)
Place of birth for the foreign-born population - Morocco (%)
Place of birth for the foreign-born population - Sudan (%)
Place of birth for the foreign-born population - Other Northern Africa (%)
Place of birth for the foreign-born population - South Africa (%)
Place of birth for the foreign-born population - Other Southern Africa (%)
Place of birth for the foreign-born population - Cabo Verde (%)
Place of birth for the foreign-born population - Ghana (%)
Place of birth for the foreign-born population - Liberia (%)
Place of birth for the foreign-born population - Nigeria (%)
Place of birth for the foreign-born population - Senegal (%)
Place of birth for the foreign-born population - Sierra Leone (%)
Place of birth for the foreign-born population - Other Western Africa (%)
Place of birth for the foreign-born population - Australia (%)
Place of birth for the foreign-born population - New Zealand (%)
Place of birth for the foreign-born population - Fiji (%)
Place of birth for the foreign-born population - Micronesia (%)
Place of birth for the foreign-born population - Bahamas (%)
Place of birth for the foreign-born population - Barbados (%)
Place of birth for the foreign-born population - Cuba (%)
Place of birth for the foreign-born population - Dominica (%)
Place of birth for the foreign-born population - Dominican Republic (%)
Place of birth for the foreign-born population - Grenada (%)
Place of birth for the foreign-born population - Haiti (%)
Place of birth for the foreign-born population - Jamaica (%)
Place of birth for the foreign-born population - St. Vincent and the Grenadines (%)
Place of birth for the foreign-born population - Trinidad and Tobago (%)
Place of birth for the foreign-born population - West Indies (%)
Place of birth for the foreign-born population - Other Caribbean (%)
Place of birth for the foreign-born population - Belize (%)
Place of birth for the foreign-born population - Costa Rica (%)
Place of birth for the foreign-born population - El Salvador (%)
Place of birth for the foreign-born population - Guatemala (%)
Place of birth for the foreign-born population - Honduras (%)
Place of birth for the foreign-born population - Mexico (%)
Place of birth for the foreign-born population - Nicaragua (%)
Place of birth for the foreign-born population - Panama (%)
Place of birth for the foreign-born population - Other Central America (%)
Place of birth for the foreign-born population - Argentina (%)
Place of birth for the foreign-born population - Bolivia (%)
Place of birth for the foreign-born population - Brazil (%)
Place of birth for the foreign-born population - Chile (%)
Place of birth for the foreign-born population - Colombia (%)
Place of birth for the foreign-born population - Ecuador (%)
Place of birth for the foreign-born population - Guyana (%)
Place of birth for the foreign-born population - Peru (%)
Place of birth for the foreign-born population - Uruguay (%)
Place of birth for the foreign-born population - Venezuela (%)
Place of birth for the foreign-born population - Other South America (%)
Place of birth for the foreign-born population - Canada (%)
Place of birth for the foreign-born population - Other Northern America (%)
Place of birth for the foreign-born population - Other (%)
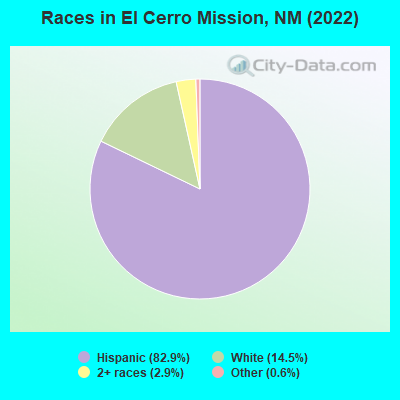
According to 2022 data, the most numerous races in El Cerro Mission, NM are Hispanic (4,146 residents), White alone (724 residents), and American Indian alone (0 residents). 44.6% of El Cerro Mission residents speak English at home.
Race distribution in El Cerro Mission 4,146 82.9% Hispanic 724 14.5% White alone 146 2.9% Two or more races 29 0.6% Other race alone
2000 2022
813,495 44.7% White alone 765,386 42.1% Hispanic 161,460 8.9% American Indian alone 30,654 1.7% Black alone 25,793 1.4% Two or more races 18,257 1.0% Asian alone 3,009 0.2% Other race alone 992 0.05% Native Hawaiian and Other
1,059,867 50.2% Hispanic 735,478 34.8% White alone 171,808 8.1% American Indian alone 65,084 3.1% Two or more races 36,870 1.7% Black alone 35,870 1.7% Asian alone 7,582 0.4% Other race alone 785 0.04% Native Hawaiian and Other
Income and house value in El Cerro Mission Median household income in 2022 $60,199 White non-Hispanic householders$82,733 Some other race householders$29,889 Two or more races householders$28,446 Hispanic or Latino race householders
Median age by race in El Cerro Mission
38.4 Median age for White residents36.8 32.8 -940,282,300.9 Median age for Black or African American residents-940,668,823.2 -670,719,350.9 -699,327,568.9 Median age for American Indian / Alaska Native residents-659,439,927.1 -712,851,404.9 -675,675,675.0 Median age for Asian residents-687,619,046.9 -661,512,026.8 -666,666,666.0 Median age for Native Hawaiian / Pacific Islander residents-666,666,666.0 -666,666,666.0 32.8 Median age for Other race residents34.6 31.5 30.7 Median age for Two or more races residents29.7 36.9 54.0 Median age for White alone residents58.6 54.4 30.7 Median age for Hispanic or Latino residents33.7 29.8
Owner/renter occupied households by race in El Cerro Mission
House owners and renters - White residents 516 82.4% Owner occupied110 17.6% Renter occupiedHouse owners and renters - Other race residents 318 100.0% Owner occupiedHouse owners and renters - Two or more races residents 936 100.0% Owner occupiedHouse owners and renters - White alone residents 181 66.4% Owner occupied92 33.6% Renter occupiedHouse owners and renters - Hispanic or Latino residents 1,190 95.9% Owner occupied50 4.1% Renter occupied
Language usage in El Cerro Mission
English speakers - Total 44.6% of residents of El Cerro Mission speak English at home.
58.6% of residents speak Spanish at home 1,534 54.7% Speak English very well1,269 45.3% Speak English less than very well
English speakers - Born in the United States 53.6% of residents of El Cerro Mission speak English at home.
40.2% of residents speak Spanish at home 360 92.8% Speak English very well28 7.2% Speak English less than very well
English speakers - Native, born elsewhere 0.0% of residents of El Cerro Mission speak English at home.
60.0% of residents speak Spanish at home 18 100.0% Speak English very well
English speakers - Foreign-born 3.5% of residents of El Cerro Mission speak English at home.
112.1% of residents speak Spanish at home 317 17.0% Speak English very well1,546 83.0% Speak English less than very well
White (Caucasian) - Speak only English Native:
69.5% (933)Foreign-born:
22.1% (41)
White (Caucasian) - Speak another language Native:
22.6% (303)Foreign-born:
100.0% (187)
Other race - Speak another language Native:
38.5% (167)Foreign-born:
100.0% (498)
Two or more races - Speak only English Native:
56.5% (1,174)Foreign-born:
2.2% (22)
Two or more races - Speak another language Native:
43.5% (905)Foreign-born:
100.0% (989)
White alone - Speak only English Native:
99.8% (633)Foreign-born:
100.0% (32)
Hispanic or Latino - Speak only English Native:
49.1% (1,262)Foreign-born:
1.7% (28)
Hispanic or Latino - Speak another language Native:
48.7% (1,253)Foreign-born:
100.0% (1,670)
Foreign-born residents in El Cerro Mission
Marital status for residents in El Cerro Mission Marital status - White (Caucasian) population 15 years and over
Males 19.0% Never married60.7% Now married0.0% Separated0.0% Widowed20.3% DivorcedFemales 29.9% Never married49.8% Now married0.0% Separated1.2% Widowed19.1% DivorcedWomen who gave birth in the past 12 months Now married:
26.2% (8)Unmarried:
73.8% (23)
Women who did not give birth in the past 12 months Now married:
35.1% (128)Unmarried:
64.9% (238)
Marital status - Other race population 15 years and over
Males 44.8% Never married32.3% Now married0.0% Separated18.0% Widowed4.9% DivorcedFemales 8.9% Never married66.7% Now married0.0% Separated0.0% Widowed24.5% DivorcedWomen who gave birth in the past 12 months Now married:
100.0% (90)Unmarried:
0.0% (0)
Women who did not give birth in the past 12 months Now married:
72.7% (81)Unmarried:
27.3% (30)
Marital status - Two or more races population 15 years and over
Males 45.6% Never married45.2% Now married0.0% Separated3.6% Widowed5.6% DivorcedFemales 26.3% Never married72.0% Now married0.0% Separated0.0% Widowed1.7% DivorcedWomen who did not give birth in the past 12 months Now married:
65.9% (532)Unmarried:
34.1% (275)
Marital status - White alone, not Hispanic / Latino population 15 years and over
Males 15.8% Never married67.2% Now married0.0% Separated0.0% Widowed17.0% DivorcedFemales 8.5% Never married67.4% Now married0.0% Separated2.9% Widowed21.1% DivorcedWomen who gave birth in the past 12 months Now married:
100.0% (11)Unmarried:
0.0% (0)
Women who did not give birth in the past 12 months Now married:
31.8% (47)Unmarried:
68.2% (102)
Marital status - Hispanic or Latino population 15 years and over
Males 34.0% Never married48.6% Now married0.0% Separated5.2% Widowed12.1% DivorcedFemales 32.2% Never married55.5% Now married0.0% Separated0.0% Widowed12.3% DivorcedWomen who gave birth in the past 12 months Now married:
66.7% (63)Unmarried:
33.3% (31)
Women who did not give birth in the past 12 months Now married:
52.6% (476)Unmarried:
47.4% (429)
Ancestries in El Cerro Mission
104 3.2% German101 3.1% Irish88 2.7% Scottish47 1.5% Czech42 1.3% English17 0.5% French12 0.4% Eastern European
Children Nativity (place of birth) in El Cerro Mission
Children under 6 years - Living with two parents Both parents native 22 100.0% NativeBoth parents foreign-born 29 100.0% NativeOne native, one foreign-born parent 35 100.0% NativeChildren under 6 years - Living with one parent Native parent 245 100.0% NativeChildren 6 to 17 years - Living with two parents Both parents native 55 95.8% Native2 4.2% Foreign-bornBoth parents foreign-born 367 72.9% Native136 27.1% Foreign-bornOne native, one foreign-born parent 136 100.0% NativeChildren 6 to 17 years - Living with one parent Native parent 409 100.0% Native
Place of birth for residents in El Cerro Mission 1,314 Americas1,314 Latin America1,314 Central America31 Europe31 Western Europe
Grandparents responsible for own grandchildren in El Cerro Mission
Grandparents (30 to 59 years) White / Caucasian 36 70.0% Responsible for grandchildren15 30.0% Not responsible for grandchildrenHispanic or Latino 33 62.8% Responsible for grandchildren19 37.2% Not responsible for grandchildren
Grandparents (60 years and over) White / Caucasian 3 100.0% Responsible for grandchildrenHispanic or Latino 99 100.0% Not responsible for grandchildren