Races in Eastgate, Washington (WA) Detailed Stats
Ancestries, Foreign-born residents, place of birth

Recent posts about races in Eastgate, Washington on our local forum with over 2,400,000 registered users:
 | The Story of the Permanent Low Barrier Men's Shelter in Eastgate neighborhood in Bellevue (15 replies) |
| Moving to Seattle worth it? (109 replies) |
| Is there a less desireable area of Bellevue? (24 replies) |
| Family with school age kids moving from Madison Wisconsin (28 replies) |
| Suburbs with Express Bus to Seattle Downtown? (7 replies) |
| How to find a rental home? (14 replies) |
Latest news about races in Eastgate, WA collected exclusively by city-data.com from local newspapers, TV, and radio stations
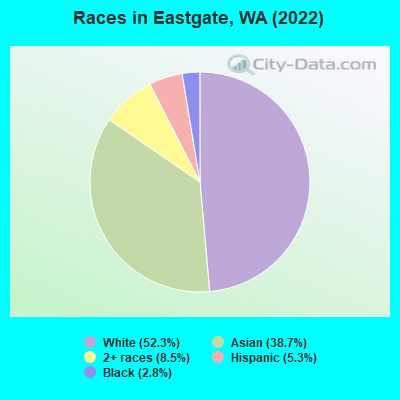
According to 2022 data, the most numerous races in Eastgate, WA are White alone (3,381 residents), Hispanic (343 residents), and Asian alone (2,503 residents). 62.3% of Eastgate residents speak English at home. 22.7% of Eastgate, WA residents are foreign-born (16.5% born in Asia, 3.9% born in Europe), which is 33.8% greater than the foreign-born rate of 15.0% across the entire state of Washington.
Race distribution in Eastgate
2000
2022

- 3,68280.8%White alone
- 4379.6%Asian alone
- 2034.5%Hispanic
- 1072.3%Two or more races
- 741.6%Black alone
- 240.5%American Indian alone
- 160.4%Other race alone
- 150.3%Native Hawaiian and Other
Pacific Islander alone

-
- 3,38152.3%White alone
- 2,50338.7%Asian alone
- 5478.5%Two or more races
- 3435.3%Hispanic
- 1792.8%Black alone
2000
2022
-
- 4,652,49078.9%White alone
- 441,5097.5%Hispanic
- 319,4015.4%Asian alone
- 184,6313.1%Black alone
- 175,9263.0%Two or more races
- 85,3961.4%American Indian alone
- 22,7790.4%Native Hawaiian and Other
Pacific Islander alone - 11,9890.2%Other race alone

-
- 4,941,45663.5%White alone
- 1,093,31314.0%Hispanic
- 755,8329.7%Asian alone
- 523,4486.7%Two or more races
- 299,5373.8%Black alone
- 69,0240.9%American Indian alone
- 52,2310.7%Native Hawaiian and Other
Pacific Islander alone - 50,9450.7%Other race alone

Income and house value in Eastgate
- Median household income in 2022
- $143,921White non-Hispanic householders
- $101,189Black householders
- over $200,000Asian householders
- over $200,000Some other race householders
- $60,278Two or more races householders
- $61,699Hispanic or Latino race householders
- Median 2022 house value
- $855,725White Non-Hispanic householders
- $799,743Black or African American householders
- $845,824Asian householders
- $602,854Two or more races householders
- $661,883Hispanic or Latino householders
Household income for White non-Hispanic householders

Household income for Black householders

Household income for Asian householders

Household income for Two or more races householders

Household income for Hispanic or Latino race householders

Median age by race in Eastgate
- 44.4Median age for White residents
- 45.5Males
- 43.3Females
- 60.9Median age for Black or African American residents
- 47.7Males
- 72.0Females
- 34.4Median age for Asian residents
- 37.5Males
- 32.7Females
- 95.0Median age for Other race residents
- 22.9Median age for Two or more races residents
- 17.9Males
- 22.9Females
- 45.0Median age for White alone residents
- 46.6Males
- 44.0Females
- 28.3Median age for Hispanic or Latino residents
- 28.6Males
- 48.6Females
Owner/renter occupied households by race in Eastgate
- House owners and renters - White residents
- 91565.0%Owner occupied
- 49335.0%Renter occupied
- House owners and renters - Black or African American residents
- 92100.0%Owner occupied
- House owners and renters - Asian residents
- 66685.0%Owner occupied
- 11815.0%Renter occupied
- House owners and renters - Two or more races residents
- 5735.9%Owner occupied
- 10264.1%Renter occupied
- House owners and renters - White alone residents
- 88265.9%Owner occupied
- 45634.1%Renter occupied
- House owners and renters - Hispanic or Latino residents
- 5446.1%Owner occupied
- 6353.9%Renter occupied
Language usage in Eastgate
- English speakers - Total
- 62.3% of residents of Eastgate speak English at home.
- 5.0% of residents speak Spanish at home
- 24078.9%Speak English very well
- 6421.1%Speak English less than very well
- 38.2% of residents speak other language at home
- 1,56667.0%Speak English very well
- 77333.0%Speak English less than very well
- English speakers - Born in the United States
- 92.1% of residents of Eastgate speak English at home.
- 1.2% of residents speak Spanish at home
- 23100.0%Speak English very well
- 5.8% of residents speak other language at home
- 9286.0%Speak English very well
- 1514.0%Speak English less than very well
- English speakers - Foreign-born
- 12.3% of residents of Eastgate speak English at home.
- 3.5% of residents speak Spanish at home
- 4767.1%Speak English very well
- 2332.9%Speak English less than very well
- 92.7% of residents speak other language at home
- 1,16963.3%Speak English very well
- 67936.7%Speak English less than very well
White (Caucasian) - Speak only English
| Native: | 93.2% (2,759) |
| Foreign-born: | 48.2% (172) |
White (Caucasian) - Speak another language
| Native: | 6.6% (197) |
| Foreign-born: | 52.1% (186) |
Asian - Speak only English
| Native: | 49.6% (372) |
| Foreign-born: | 2.0% (31) |
Asian - Speak another language
| Native: | 48.9% (367) |
| Foreign-born: | 97.4% (1,534) |
White alone - Speak only English
| Native: | 92.5% (2,584) |
| Foreign-born: | 40.2% (179) |
White alone - Speak another language
| Native: | 7.4% (207) |
| Foreign-born: | 58.3% (260) |
Foreign-born residents in Eastgate
1,466 residents are foreign born (16.5% Asia, 3.9% Europe).
| This city: | 22.7% |
| Washington: | 100.0% |


Marital status for residents in Eastgate
Marital status - White (Caucasian) population 15 years and over
- Males
- 29.0%Never married
- 56.4%Now married
- 1.3%Separated
- 6.4%Widowed
- 7.0%Divorced
- Females
- 19.7%Never married
- 64.2%Now married
- 0.0%Separated
- 2.5%Widowed
- 13.6%Divorced
Women who gave birth in the past 12 months
| Now married: | 67.4% (27) |
| Unmarried: | 32.6% (13) |
Women who did not give birth in the past 12 months
| Now married: | 59.9% (384) |
| Unmarried: | 40.1% (257) |
Marital status - Black or African American population 15 years and over
- Males
- 0.0%Never married
- 75.0%Now married
- 0.0%Separated
- 0.0%Widowed
- 25.0%Divorced
- Females
- 0.0%Never married
- 0.0%Now married
- 0.0%Separated
- 23.0%Widowed
- 77.0%Divorced
Marital status - Asian population 15 years and over
- Males
- 23.0%Never married
- 73.3%Now married
- 0.0%Separated
- 3.7%Widowed
- 0.0%Divorced
- Females
- 24.1%Never married
- 75.9%Now married
- 0.0%Separated
- 0.0%Widowed
- 0.0%Divorced
Women who gave birth in the past 12 months
| Now married: | 100.0% (73) |
| Unmarried: | 0.0% (0) |
Women who did not give birth in the past 12 months
| Now married: | 69.1% (476) |
| Unmarried: | 30.9% (213) |
Marital status - Two or more races population 15 years and over
- Males
- 71.4%Never married
- 28.6%Now married
- 0.0%Separated
- 0.0%Widowed
- 0.0%Divorced
- Females
- 63.8%Never married
- 36.2%Now married
- 0.0%Separated
- 0.0%Widowed
- 0.0%Divorced
Women who did not give birth in the past 12 months
| Now married: | 26.5% (91) |
| Unmarried: | 73.5% (251) |
Marital status - White alone, not Hispanic / Latino population 15 years and over
- Males
- 28.3%Never married
- 56.0%Now married
- 1.4%Separated
- 6.9%Widowed
- 7.5%Divorced
- Females
- 19.7%Never married
- 64.2%Now married
- 0.0%Separated
- 2.5%Widowed
- 13.6%Divorced
Women who gave birth in the past 12 months
| Now married: | 67.4% (27) |
| Unmarried: | 32.6% (13) |
Women who did not give birth in the past 12 months
| Now married: | 59.9% (386) |
| Unmarried: | 40.1% (258) |
Marital status - Hispanic or Latino population 15 years and over
- Males
- 46.8%Never married
- 53.2%Now married
- 0.0%Separated
- 0.0%Widowed
- 0.0%Divorced
- Females
- 0.0%Never married
- 42.1%Now married
- 0.0%Separated
- 57.9%Widowed
- 0.0%Divorced
Women who did not give birth in the past 12 months
| Now married: | 100.0% (24) |
| Unmarried: | 0.0% (0) |
Ancestries in Eastgate

- 2307.1%English
- 2176.7%European
- 1314.0%Irish
- 952.9%German
- 902.8%Scottish
- 702.2%Northern European
- 581.8%Romanian
- 471.4%Scotch-Irish
- 431.3%Swedish
- 311.0%American
- 280.9%British
- 270.8%Welsh
- 250.8%Canadian
- 250.8%Scandinavian
- 210.6%Greek
- 210.6%Russian
- 150.5%Norwegian
- 120.4%Lithuanian
- 110.3%Dutch
- 100.3%French Canadian
- 90.3%Icelander
- 80.2%Finnish

Geographical mobility in Eastgate

- Same house 1 year ago
- 3,01786.6%White (Caucasian)
- 224100.0%Black or African American
- 2,06382.1%Asian
- 58100.0%Other race
- 790100.0%Two or more races
- 2,93187.2%White alone, not Hispanic / Latino
- 26576.5%Hispanic or Latino

-
- Moved within same county
- 1935.6%White / Caucasian
- 27911.1%Asian
- 1770.4%Native Hawaiian / Pacific Islander
- 1985.9%White alone, not Hispanic / Latino
- 195.5%Hispanic or Latino

-
- Moved within same state
- 1022.9%White / Caucasian
- 1033.1%White alone, not Hispanic / Latino

-
- Moved from different state
- 2096.0%White / Caucasian
- 1927.6%Asian
- 1534.6%White alone, not Hispanic / Latino
- 8223.6%Hispanic or Latino

-
- Moved from abroad
- 190.8%Asian

Children Nativity (place of birth) in Eastgate
Place of birth for residents in Eastgate
![Place of birth for the foreign-born population - Regions]()
- 1,062Asia
- 725Eastern Asia
- 622China
- 250Europe
- 198South Eastern Asia
- 162Eastern Europe
- 153Americas
- 138South Central Asia
- 84Northern America
- 69Latin America
- 55Northern Europe
- 38Central America
- 32Western Europe
- 30South America

![Place of birth for the foreign-born population - Countries]()
- 356China
- 248Taiwan
- 148Vietnam
- 138India
- 84Canada
- 82Korea
- 68Belarus
- 51Romania
- 42Russia
- 38Guatemala
- 32Germany
- 30Brazil
- 25Ireland
- 25Malaysia
- 23Philippines
- 21United Kingdom
- 20Japan
- 18Hong Kong
- 8Scotland

Grandparents responsible for own grandchildren in Eastgate
Zip codes: 98006.