Races in East Tom Green, Texas (TX) Detailed Stats
Ancestries, Foreign-born residents, place of birth
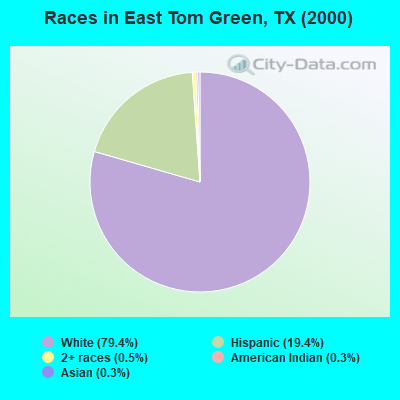
Race distribution in East Tom Green

- 3,61179.4%White alone
- 88219.4%Hispanic
- 250.5%Two or more races
- 120.3%Asian alone
- 150.3%American Indian alone
- 30.07%Other race alone
- 10.02%Black alone
2000
2022
-
- 10,933,31352.4%White alone
- 6,669,66632.0%Hispanic
- 2,364,25511.3%Black alone
- 554,4452.7%Asian alone
- 230,5671.1%Two or more races
- 68,8590.3%American Indian alone
- 19,9580.10%Other race alone
- 10,7570.05%Native Hawaiian and Other
Pacific Islander alone

-
- 12,070,64240.2%Hispanic
- 11,683,43038.9%White alone
- 3,508,70611.7%Black alone
- 1,608,1735.4%Asian alone
- 956,5603.2%Two or more races
- 125,7630.4%Other race alone
- 47,0230.2%American Indian alone
- 29,2750.10%Native Hawaiian and Other
Pacific Islander alone

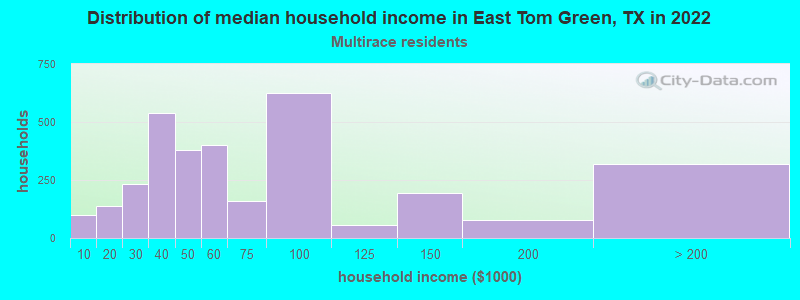
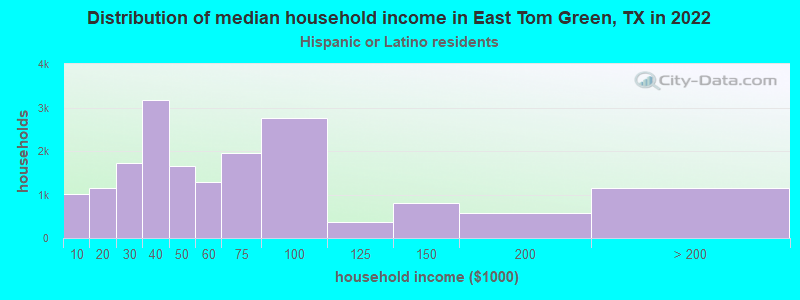
Income and house value in East Tom Green
- Median household income in 2022
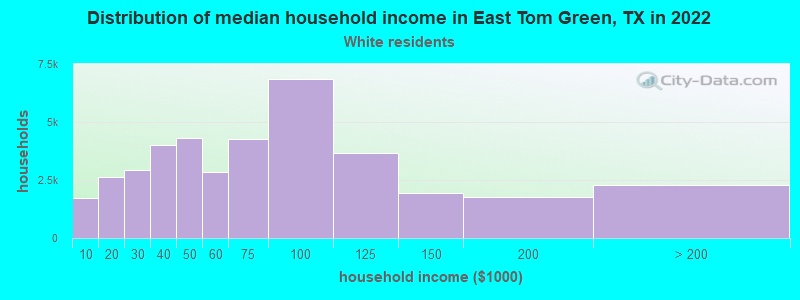
- $79,255White non-Hispanic householders
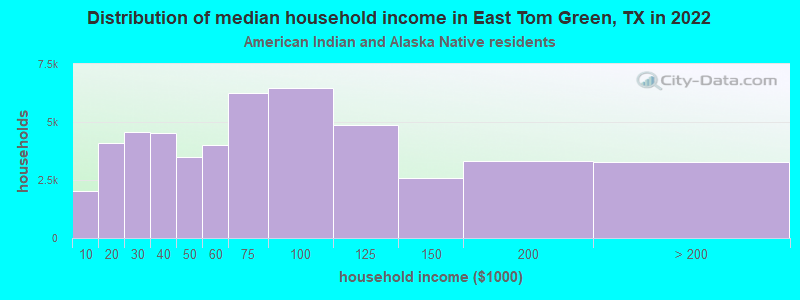
- $59,388American Indian and Alaska Native householders
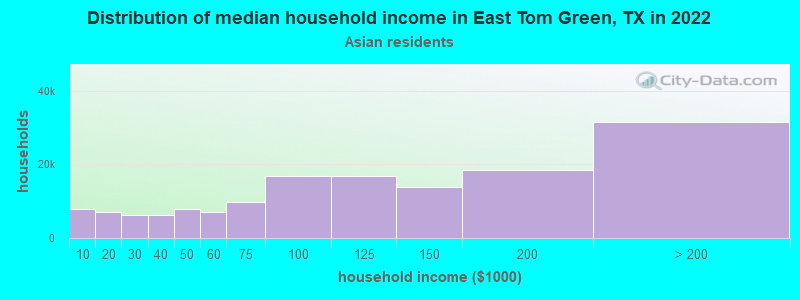
- $60,138Asian householders
- $40,714Some other race householders
- $20,835Two or more races householders
- $50,045Hispanic or Latino race householders
- Median 2022 house value
- $231,200White Non-Hispanic householders
- $200,909American Indian or Alaska Native householders
- $115,909Asian householders
- $194,727Some other race householders
- $231,818Two or more races householders
- $165,981Hispanic or Latino householders
Household income for White non-Hispanic householders
Household income for American Indian and Alaska Native householders
Household income for Asian householders
Household income for Two or more races householders
Household income for Hispanic or Latino race householders
Zip code: 76905