Races in East Providence, Rhode Island (RI) Detailed Stats
Data:
Races - White alone (%)
Races - White alone (% change since 2000)
Races - Black alone (%)
Races - Black alone (% change since 2000)
Races - American Indian alone (%)
Races - American Indian alone (% change since 2000)
Races - Asian alone (%)
Races - Asian alone (% change since 2000)
Races - Hispanic (%)
Races - Hispanic (% change since 2000)
Races - Native Hawaiian and Other Pacific Islander alone (%)
Races - Native Hawaiian and Other Pacific Islander alone (% change since 2000)
Races - Two or more races(%)
Races - Two or more races(% change since 2000)
Races - Other race alone (%)
Races - Other race alone (% change since 2000)
Racial diversity
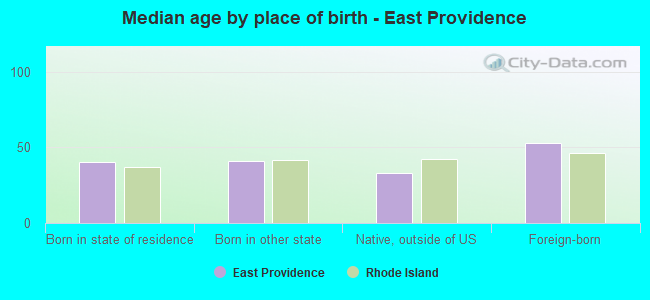
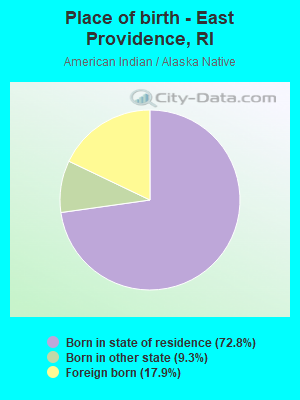
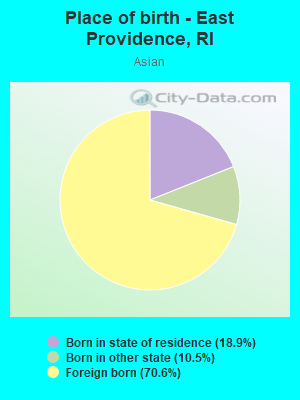
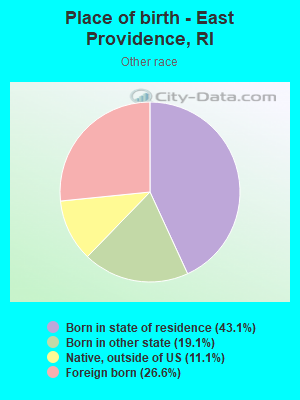
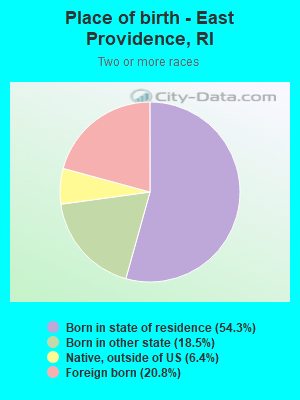
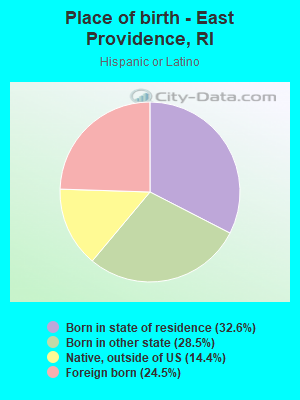
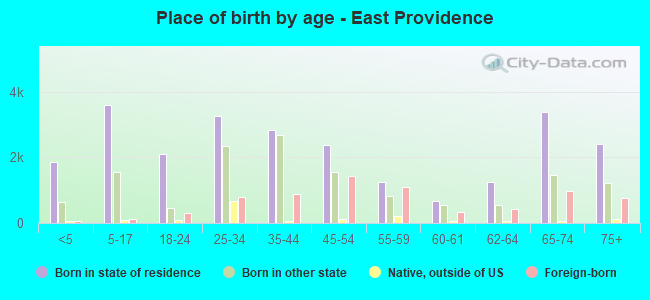
Place of birth - Born in state of residence (%)
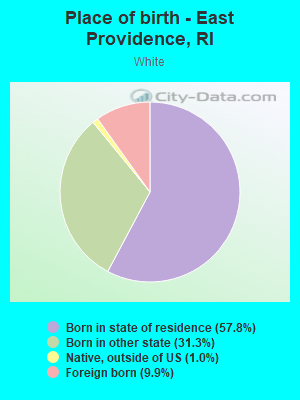
Place of birth - Born in state of residence (%) - White
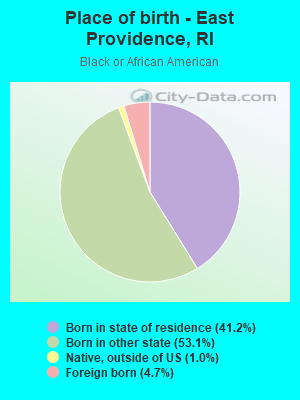
Place of birth - Born in state of residence (%) - Black or African American
Place of birth - Born in state of residence (%) - Asian
Place of birth - Born in state of residence (%) - Hispanic or Latino
Place of birth - Born in state of residence (%) - American Indian and Alaska Native
Place of birth - Born in state of residence (%) - Multirace
Place of birth - Born in state of residence (%) - Other Race
Place of birth - Born in other state (%)
Place of birth - Born in other state (%) - White
Place of birth - Born in other state (%) - Black or African American
Place of birth - Born in other state (%) - Asian
Place of birth - Born in other state (%) - Hispanic or Latino
Place of birth - Born in other state (%) - American Indian and Alaska Native
Place of birth - Born in other state (%) - Multirace
Place of birth - Born in other state (%) - Other Race
Place of birth - Native, outside of US (%)
Place of birth - Native, outside of US (%) - White
Place of birth - Native, outside of US (%) - Black or African American
Place of birth - Native, outside of US (%) - Asian
Place of birth - Native, outside of US (%) - Hispanic or Latino
Place of birth - Native, outside of US (%) - American Indian and Alaska Native
Place of birth - Native, outside of US (%) - Multirace
Place of birth - Native, outside of US (%) - Other Race
Place of birth - Foreign born (%)
Place of birth - Foreign born (%) - White
Place of birth - Foreign born (%) - Black or African American
Place of birth - Foreign born (%) - Asian
Place of birth - Foreign born (%) - Hispanic or Latino
Place of birth - Foreign born (%) - American Indian and Alaska Native
Place of birth - Foreign born (%) - Multirace
Place of birth - Foreign born (%) - Other Race
Residents speaking English at home (%)
Residents speaking English at home - Born in the United States (%)
Residents speaking English at home - Native, born elsewhere (%)
Residents speaking English at home - Foreign born (%)
Residents speaking Spanish at home (%)
Residents speaking Spanish at home - Born in the United States (%)
Residents speaking Spanish at home - Native, born elsewhere (%)
Residents speaking Spanish at home - Foreign born (%)
Residents speaking other language at home (%)
Residents speaking other language at home - Born in the United States (%)
Residents speaking other language at home - Native, born elsewhere (%)
Residents speaking other language at home - Foreign born (%)
Marital status - Never married (%)
Marital status - Now married (%)
Marital status - Separated (%)
Marital status - Widowed (%)
Marital status - Divorced (%)
Ancestries Reported - Arab (%)
Ancestries Reported - Czech (%)
Ancestries Reported - Danish (%)
Ancestries Reported - Dutch (%)
Ancestries Reported - English (%)
Ancestries Reported - French (%)
Ancestries Reported - French Canadian (%)
Ancestries Reported - German (%)
Ancestries Reported - Greek (%)
Ancestries Reported - Hungarian (%)
Ancestries Reported - Irish (%)
Ancestries Reported - Italian (%)
Ancestries Reported - Lithuanian (%)
Ancestries Reported - Norwegian (%)
Ancestries Reported - Polish (%)
Ancestries Reported - Portuguese (%)
Ancestries Reported - Russian (%)
Ancestries Reported - Scotch-Irish (%)
Ancestries Reported - Scottish (%)
Ancestries Reported - Slovak (%)
Ancestries Reported - Subsaharan African (%)
Ancestries Reported - Swedish (%)
Ancestries Reported - Swiss (%)
Ancestries Reported - Ukrainian (%)
Ancestries Reported - United States (%)
Ancestries Reported - Welsh (%)
Ancestries Reported - West Indian (%)
Ancestries Reported - Other (%)
Geographical mobility - Same house 1 year ago (%)
Geographical mobility - Same house 1 year ago (%) - White
Geographical mobility - Same house 1 year ago (%) - Black or African American
Geographical mobility - Same house 1 year ago (%) - Asian
Geographical mobility - Same house 1 year ago (%) - Hispanic or Latino
Geographical mobility - Same house 1 year ago (%) - American Indian and Alaska Native
Geographical mobility - Same house 1 year ago (%) - Multirace
Geographical mobility - Same house 1 year ago (%) - Other Race
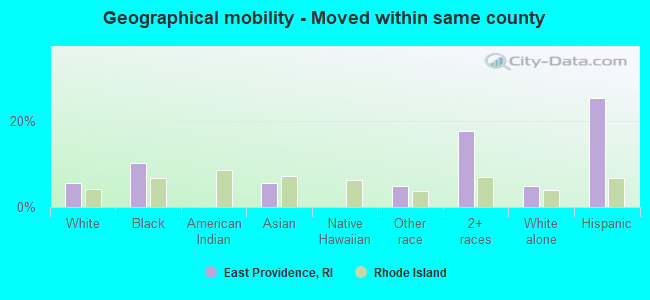
Geographical mobility - Moved within same county (%)
Geographical mobility - Moved within same county (%) - White
Geographical mobility - Moved within same county (%) - Black or African American
Geographical mobility - Moved within same county (%) - Asian
Geographical mobility - Moved within same county (%) - Hispanic or Latino
Geographical mobility - Moved within same county (%) - American Indian and Alaska Native
Geographical mobility - Moved within same county (%) - Multirace
Geographical mobility - Moved within same county (%) - Other Race
Geographical mobility - Moved from different county within same state (%)
Geographical mobility - Moved from different county within same state (%) - White
Geographical mobility - Moved from different county within same state (%) - Black or African American
Geographical mobility - Moved from different county within same state (%) - Asian
Geographical mobility - Moved from different county within same state (%) - Hispanic or Latino
Geographical mobility - Moved from different county within same state (%) - American Indian and Alaska Native
Geographical mobility - Moved from different county within same state (%) - Multirace
Geographical mobility - Moved from different county within same state (%) - Other Race
Geographical mobility - Moved from different state (%)
Geographical mobility - Moved from different state (%) - White
Geographical mobility - Moved from different state (%) - Black or African American
Geographical mobility - Moved from different state (%) - Asian
Geographical mobility - Moved from different state (%) - Hispanic or Latino
Geographical mobility - Moved from different state (%) - American Indian and Alaska Native
Geographical mobility - Moved from different state (%) - Multirace
Geographical mobility - Moved from different state (%) - Other Race
Geographical mobility - Moved from abroad (%)
Geographical mobility - Moved from abroad (%) - White
Geographical mobility - Moved from abroad (%) - Black or African American
Geographical mobility - Moved from abroad (%) - Asian
Geographical mobility - Moved from abroad (%) - Hispanic or Latino
Geographical mobility - Moved from abroad (%) - American Indian and Alaska Native
Geographical mobility - Moved from abroad (%) - Multirace
Geographical mobility - Moved from abroad (%) - Other Race
Place of birth for the foreign-born population - Ireland (%)
Place of birth for the foreign-born population - Denmark (%)
Place of birth for the foreign-born population - Norway (%)
Place of birth for the foreign-born population - Sweden (%)
Place of birth for the foreign-born population - United Kingdom (%)
Place of birth for the foreign-born population - England (%)
Place of birth for the foreign-born population - Scotland (%)
Place of birth for the foreign-born population - Other Northern Europe (%)
Place of birth for the foreign-born population - Austria (%)
Place of birth for the foreign-born population - Belgium (%)
Place of birth for the foreign-born population - France (%)
Place of birth for the foreign-born population - Germany (%)
Place of birth for the foreign-born population - Netherlands (%)
Place of birth for the foreign-born population - Switzerland (%)
Place of birth for the foreign-born population - Other Western Europe (%)
Place of birth for the foreign-born population - Greece (%)
Place of birth for the foreign-born population - Italy (%)
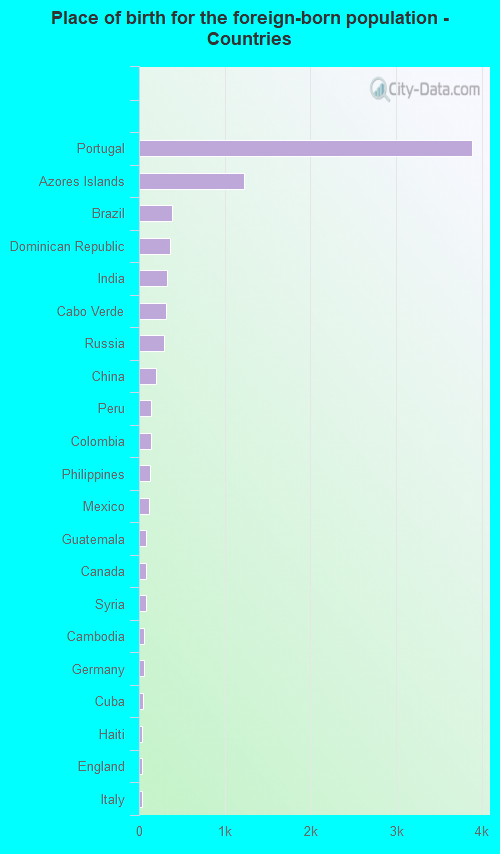
Place of birth for the foreign-born population - Portugal (%)
Place of birth for the foreign-born population - Spain (%)
Place of birth for the foreign-born population - Other Southern Europe (%)
Place of birth for the foreign-born population - Albania (%)
Place of birth for the foreign-born population - Belarus (%)
Place of birth for the foreign-born population - Bosnia and Herzegovina (%)
Place of birth for the foreign-born population - Bulgaria (%)
Place of birth for the foreign-born population - Croatia (%)
Place of birth for the foreign-born population - Czechoslovakia (%)
Place of birth for the foreign-born population - Hungary (%)
Place of birth for the foreign-born population - Latvia (%)
Place of birth for the foreign-born population - Lithuania (%)
Place of birth for the foreign-born population - North Macedonia (Macedonia) (%)
Place of birth for the foreign-born population - Moldova (%)
Place of birth for the foreign-born population - Poland (%)
Place of birth for the foreign-born population - Romania (%)
Place of birth for the foreign-born population - Russia (%)
Place of birth for the foreign-born population - Serbia (%)
Place of birth for the foreign-born population - Ukraine (%)
Place of birth for the foreign-born population - Other Eastern Europe (%)
Place of birth for the foreign-born population - China (%)
Place of birth for the foreign-born population - Hong Kong (%)
Place of birth for the foreign-born population - Taiwan (%)
Place of birth for the foreign-born population - Japan (%)
Place of birth for the foreign-born population - Korea (%)
Place of birth for the foreign-born population - Other Eastern Asia (%)
Place of birth for the foreign-born population - Afghanistan (%)
Place of birth for the foreign-born population - Bangladesh (%)
Place of birth for the foreign-born population - India (%)
Place of birth for the foreign-born population - Iran (%)
Place of birth for the foreign-born population - Kazakhstan (%)
Place of birth for the foreign-born population - Nepal (%)
Place of birth for the foreign-born population - Pakistan (%)
Place of birth for the foreign-born population - Sri Lanka (%)
Place of birth for the foreign-born population - Uzbekistan (%)
Place of birth for the foreign-born population - Other South Central Asia (%)
Place of birth for the foreign-born population - Burma (%)
Place of birth for the foreign-born population - Cambodia (%)
Place of birth for the foreign-born population - Indonesia (%)
Place of birth for the foreign-born population - Laos (%)
Place of birth for the foreign-born population - Malaysia (%)
Place of birth for the foreign-born population - Philippines (%)
Place of birth for the foreign-born population - Singapore (%)
Place of birth for the foreign-born population - Thailand (%)
Place of birth for the foreign-born population - Vietnam (%)
Place of birth for the foreign-born population - Other South Eastern Asia (%)
Place of birth for the foreign-born population - Armenia (%)
Place of birth for the foreign-born population - Iraq (%)
Place of birth for the foreign-born population - Israel (%)
Place of birth for the foreign-born population - Jordan (%)
Place of birth for the foreign-born population - Kuwait (%)
Place of birth for the foreign-born population - Lebanon (%)
Place of birth for the foreign-born population - Saudi Arabia (%)
Place of birth for the foreign-born population - Syria (%)
Place of birth for the foreign-born population - Turkey (%)
Place of birth for the foreign-born population - Yemen (%)
Place of birth for the foreign-born population - Other Western Asia (%)
Place of birth for the foreign-born population - Eritrea (%)
Place of birth for the foreign-born population - Ethiopia (%)
Place of birth for the foreign-born population - Kenya (%)
Place of birth for the foreign-born population - Somalia (%)
Place of birth for the foreign-born population - Uganda (%)
Place of birth for the foreign-born population - Zimbabwe (%)
Place of birth for the foreign-born population - Other Eastern Africa (%)
Place of birth for the foreign-born population - Cameroon (%)
Place of birth for the foreign-born population - Congo (%)
Place of birth for the foreign-born population - Democratic Republic of Congo (Zaire) (%)
Place of birth for the foreign-born population - Other Middle Africa (%)
Place of birth for the foreign-born population - Egypt (%)
Place of birth for the foreign-born population - Morocco (%)
Place of birth for the foreign-born population - Sudan (%)
Place of birth for the foreign-born population - Other Northern Africa (%)
Place of birth for the foreign-born population - South Africa (%)
Place of birth for the foreign-born population - Other Southern Africa (%)
Place of birth for the foreign-born population - Cabo Verde (%)
Place of birth for the foreign-born population - Ghana (%)
Place of birth for the foreign-born population - Liberia (%)
Place of birth for the foreign-born population - Nigeria (%)
Place of birth for the foreign-born population - Senegal (%)
Place of birth for the foreign-born population - Sierra Leone (%)
Place of birth for the foreign-born population - Other Western Africa (%)
Place of birth for the foreign-born population - Australia (%)
Place of birth for the foreign-born population - New Zealand (%)
Place of birth for the foreign-born population - Fiji (%)
Place of birth for the foreign-born population - Micronesia (%)
Place of birth for the foreign-born population - Bahamas (%)
Place of birth for the foreign-born population - Barbados (%)
Place of birth for the foreign-born population - Cuba (%)
Place of birth for the foreign-born population - Dominica (%)
Place of birth for the foreign-born population - Dominican Republic (%)
Place of birth for the foreign-born population - Grenada (%)
Place of birth for the foreign-born population - Haiti (%)
Place of birth for the foreign-born population - Jamaica (%)
Place of birth for the foreign-born population - St. Vincent and the Grenadines (%)
Place of birth for the foreign-born population - Trinidad and Tobago (%)
Place of birth for the foreign-born population - West Indies (%)
Place of birth for the foreign-born population - Other Caribbean (%)
Place of birth for the foreign-born population - Belize (%)
Place of birth for the foreign-born population - Costa Rica (%)
Place of birth for the foreign-born population - El Salvador (%)
Place of birth for the foreign-born population - Guatemala (%)
Place of birth for the foreign-born population - Honduras (%)
Place of birth for the foreign-born population - Mexico (%)
Place of birth for the foreign-born population - Nicaragua (%)
Place of birth for the foreign-born population - Panama (%)
Place of birth for the foreign-born population - Other Central America (%)
Place of birth for the foreign-born population - Argentina (%)
Place of birth for the foreign-born population - Bolivia (%)
Place of birth for the foreign-born population - Brazil (%)
Place of birth for the foreign-born population - Chile (%)
Place of birth for the foreign-born population - Colombia (%)
Place of birth for the foreign-born population - Ecuador (%)
Place of birth for the foreign-born population - Guyana (%)
Place of birth for the foreign-born population - Peru (%)
Place of birth for the foreign-born population - Uruguay (%)
Place of birth for the foreign-born population - Venezuela (%)
Place of birth for the foreign-born population - Other South America (%)
Place of birth for the foreign-born population - Canada (%)
Place of birth for the foreign-born population - Other Northern America (%)
Place of birth for the foreign-born population - Other (%)
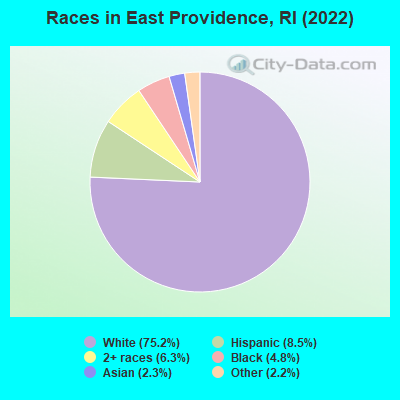
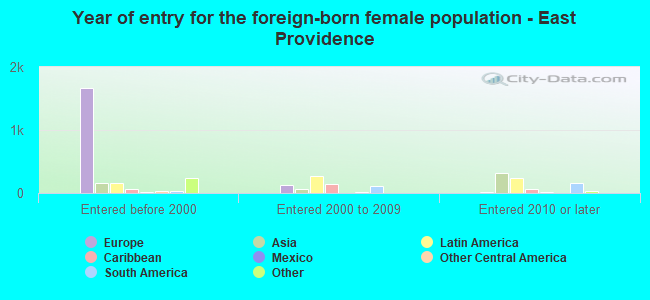
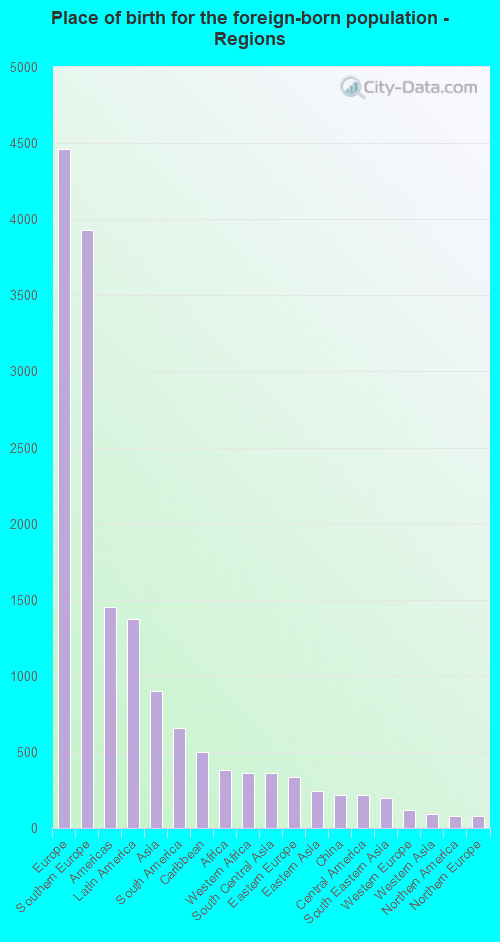
According to 2022 data, the most numerous races in East Providence, RI are White alone (35,309 residents), Hispanic (4,004 residents), and Two or more races (2,958 residents). 77.3% of East Providence residents speak English at home. 15.4% of East Providence, RI residents are foreign-born (9.3% born in Europe, 2.9% born in Latin America, 1.9% born in Asia), which is 8.8% greater than the foreign-born rate of 14.0% across the entire state of Rhode Island.
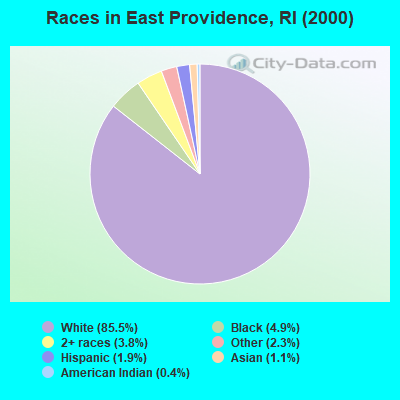
Race distribution in East Providence
2000 2022
41,630 85.5% White alone 2,391 4.9% Black alone 1,835 3.8% Two or more races 1,121 2.3% Other race alone 922 1.9% Hispanic 555 1.1% Asian alone 212 0.4% American Indian alone 22 0.05% Native Hawaiian and Other
35,309 75.2% White alone 4,004 8.5% Hispanic 2,958 6.3% Two or more races 2,259 4.8% Black alone 1,060 2.3% Asian alone 1,026 2.2% Other race alone 33 0.07% American Indian alone 22 0.05% Native Hawaiian and Other
2000 2022
858,433 81.9% White alone 90,820 8.7% Hispanic 41,922 4.0% Black alone 23,416 2.2% Asian alone 20,816 2.0% Two or more races 8,411 0.8% Other race alone 4,181 0.4% American Indian alone 320 0.03% Native Hawaiian and Other
745,825 68.2% White alone 191,979 17.6% Hispanic 56,738 5.2% Two or more races 51,326 4.7% Black alone 37,234 3.4% Asian alone 9,514 0.9% Other race alone 978 0.09% American Indian alone 140 0.01% Native Hawaiian and Other
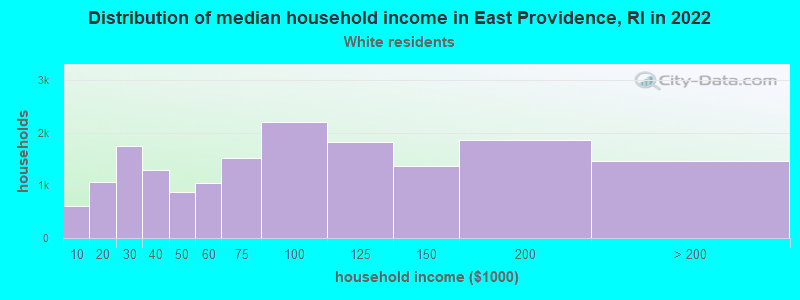
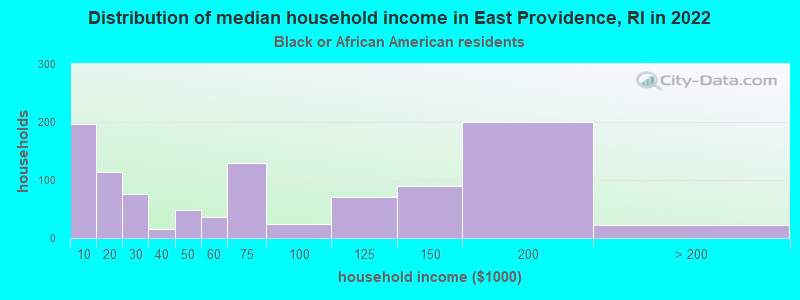
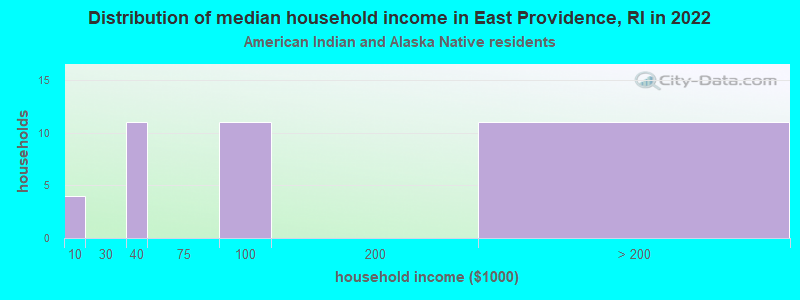
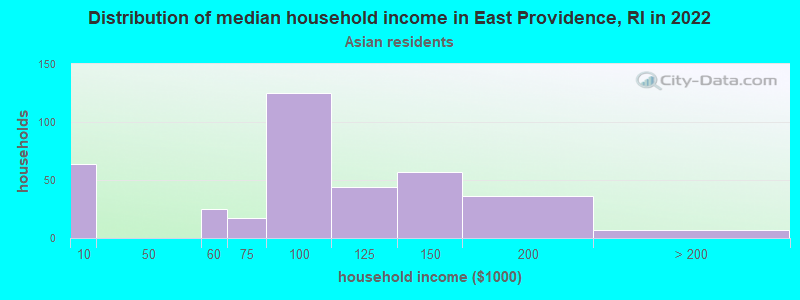
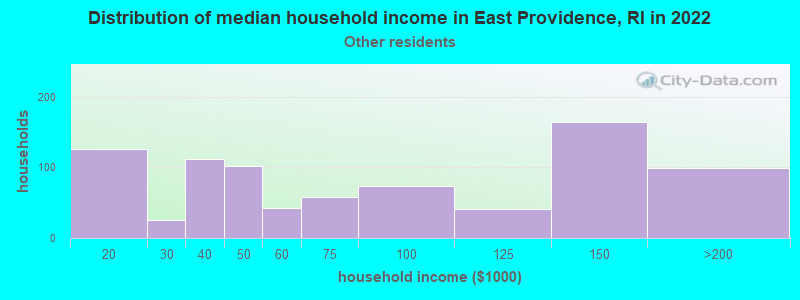
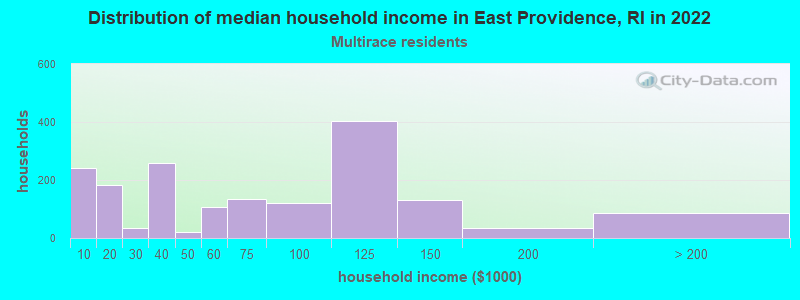
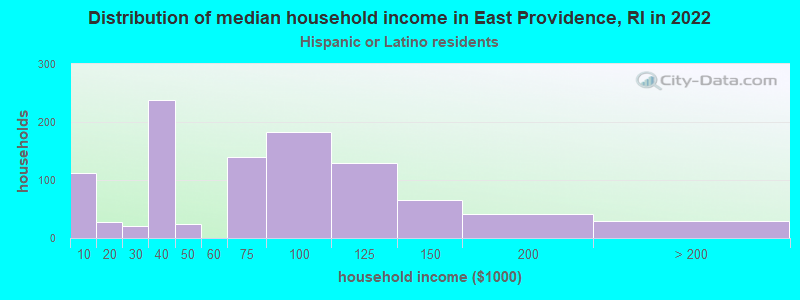
Income and house value in East Providence Median household income in 2022 $74,490 White non-Hispanic householders$79,373 Asian householders$53,524 Some other race householders$60,442 Two or more races householders$75,553 Hispanic or Latino race householdersMedian 2022 house value $332,051 White Non-Hispanic householders$317,212 Black or African American householders$312,173 American Indian or Alaska Native householders $331,771 Asian householders$301,814 Some other race householders$304,613 Two or more races householders$251,138 Hispanic or Latino householders
Median age by race in East Providence
47.4 Median age for White residents43.9 50.6 36.5 Median age for Black or African American residents43.7 33.9 51.7 Median age for American Indian / Alaska Native residents61.0 68.7 35.4 Median age for Asian residents32.5 34.8 -713,991,768.8 Median age for Native Hawaiian / Pacific Islander residents-668,724,279.2 -670,599,802.7 39.4 Median age for Other race residents32.3 55.5 32.1 Median age for Two or more races residents32.5 35.9 47.3 Median age for White alone residents44.9 50.1 27.4 Median age for Hispanic or Latino residents23.2 29.2
Owner/renter occupied households by race in East Providence
House owners and renters - White residents 10,920 64.4% Owner occupied6,028 35.6% Renter occupiedHouse owners and renters - Black or African American residents 511 51.3% Owner occupied486 48.7% Renter occupiedHouse owners and renters - American Indian / Alaska Native residents 38 85.6% Owner occupied6 14.4% Renter occupiedHouse owners and renters - Asian residents 156 44.1% Owner occupied198 55.9% Renter occupiedHouse owners and renters - Other race residents 423 54.6% Owner occupied351 45.4% Renter occupiedHouse owners and renters - Two or more races residents 469 27.7% Owner occupied1,220 72.3% Renter occupiedHouse owners and renters - White alone residents 11,156 63.8% Owner occupied6,322 36.2% Renter occupiedHouse owners and renters - Hispanic or Latino residents 220 21.4% Owner occupied807 78.6% Renter occupied
Language usage in East Providence
English speakers - Total 77.3% of residents of East Providence speak English at home.
6.0% of residents speak Spanish at home 1,919 72.1% Speak English very well744 27.9% Speak English less than very well16.4% of residents speak other language at home 4,731 64.8% Speak English very well2,569 35.2% Speak English less than very well
English speakers - Born in the United States 89.7% of residents of East Providence speak English at home.
4.4% of residents speak Spanish at home 472 82.4% Speak English very well101 17.6% Speak English less than very well6.0% of residents speak other language at home 726 93.6% Speak English very well50 6.4% Speak English less than very well
English speakers - Native, born elsewhere 45.6% of residents of East Providence speak English at home.
30.8% of residents speak Spanish at home 241 64.6% Speak English very well132 35.4% Speak English less than very well31.5% of residents speak other language at home 377 99.0% Speak English very well4 1.0% Speak English less than very well
English speakers - Foreign-born 14.0% of residents of East Providence speak English at home.
13.2% of residents speak Spanish at home 528 55.9% Speak English very well416 44.1% Speak English less than very well68.6% of residents speak other language at home 2,457 50.0% Speak English very well2,456 50.0% Speak English less than very well
White (Caucasian) - Speak only English Native:
92.8% (27,206)Foreign-born:
12.2% (405)
White (Caucasian) - Speak another language Native:
7.0% (2,051)Foreign-born:
88.4% (2,925)
Black or African American - Speak only English Native:
93.1% (1,928)Foreign-born:
86.6% (108)
Black or African American - Speak another language Native:
6.8% (140)Foreign-born:
30.6% (38)
American Indian / Alaska Native - Speak another language Native:
14.2% (11)Foreign-born:
100.0% (20)
Asian - Speak only English Native:
86.4% (152)Foreign-born:
12.1% (88)
Asian - Speak another language Native:
20.0% (35)Foreign-born:
87.6% (636)
Other race - Speak only English Native:
80.5% (1,186)Foreign-born:
11.7% (65)
Other race - Speak another language Native:
28.8% (425)Foreign-born:
89.8% (498)
Two or more races - Speak only English Native:
81.7% (3,019)Foreign-born:
12.8% (137)
Two or more races - Speak another language Native:
15.7% (581)Foreign-born:
88.8% (948)
White alone - Speak only English Native:
92.4% (27,348)Foreign-born:
11.6% (449)
White alone - Speak another language Native:
7.4% (2,182)Foreign-born:
90.7% (3,504)
Hispanic or Latino - Speak only English Native:
43.7% (1,105)Foreign-born:
7.6% (76)
Hispanic or Latino - Speak another language Native:
57.5% (1,452)Foreign-born:
92.5% (926)
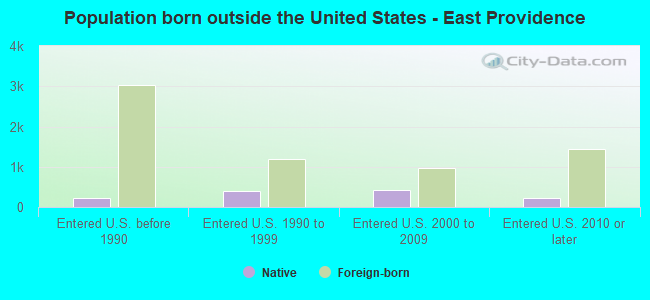
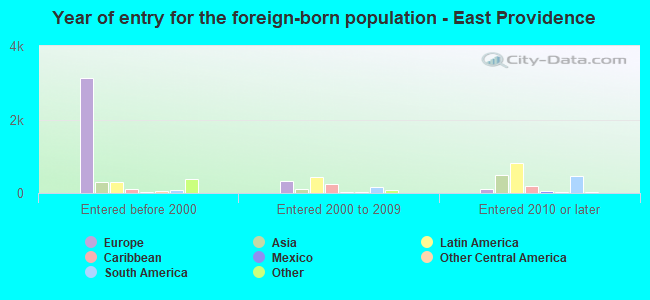
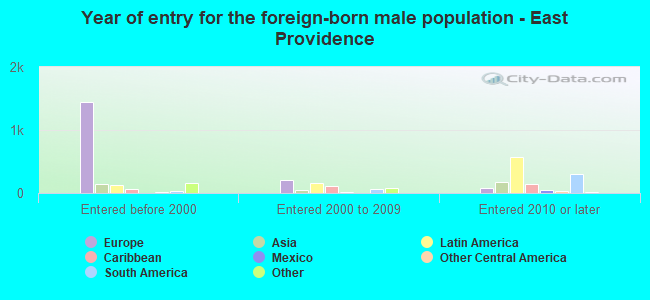
Foreign-born residents in East Providence 7,209 residents are foreign born (9.3% Europe , 2.9% Latin America , 1.9% Asia ).
This city:
15.4%Rhode Island:
14.4%
Marital status for residents in East Providence Marital status - White (Caucasian) population 15 years and over
Males 37.9% Never married47.7% Now married0.4% Separated3.8% Widowed10.3% DivorcedFemales 26.8% Never married46.2% Now married1.7% Separated11.4% Widowed13.8% DivorcedWomen who gave birth in the past 12 months Now married:
77.4% (281)Unmarried:
22.6% (82)
Women who did not give birth in the past 12 months Now married:
44.5% (2,921)Unmarried:
55.5% (3,640)
Marital status - Black or African American population 15 years and over
Males 52.8% Never married37.4% Now married0.0% Separated3.8% Widowed6.0% DivorcedFemales 40.0% Never married27.1% Now married1.2% Separated20.6% Widowed11.1% DivorcedWomen who gave birth in the past 12 months Now married:
63.2% (12)Unmarried:
36.8% (7)
Women who did not give birth in the past 12 months Now married:
23.0% (114)Unmarried:
77.0% (383)
Marital status - American Indian / Alaska Native population 15 years and over
Males 51.4% Never married44.3% Now married0.0% Separated0.0% Widowed4.3% DivorcedFemales 0.0% Never married0.0% Now married0.0% Separated100.0% Widowed0.0% DivorcedMarital status - Asian population 15 years and over
Males 37.0% Never married63.0% Now married0.0% Separated0.0% Widowed0.0% DivorcedFemales 18.5% Never married72.6% Now married0.0% Separated8.9% Widowed0.0% DivorcedWomen who gave birth in the past 12 months Now married:
100.0% (29)Unmarried:
0.0% (0)
Women who did not give birth in the past 12 months Now married:
72.0% (235)Unmarried:
28.0% (91)
Marital status - Other race population 15 years and over
Males 48.9% Never married35.2% Now married0.0% Separated0.0% Widowed15.9% DivorcedFemales 38.1% Never married32.7% Now married3.0% Separated10.2% Widowed16.0% DivorcedWomen who gave birth in the past 12 months Now married:
0.0% (0)Unmarried:
100.0% (58)
Women who did not give birth in the past 12 months Now married:
36.6% (135)Unmarried:
63.4% (234)
Marital status - Two or more races population 15 years and over
Males 54.5% Never married35.8% Now married0.0% Separated1.2% Widowed8.5% DivorcedFemales 44.5% Never married30.1% Now married6.4% Separated10.8% Widowed8.3% DivorcedWomen who gave birth in the past 12 months Now married:
58.9% (92)Unmarried:
41.1% (64)
Women who did not give birth in the past 12 months Now married:
31.9% (319)Unmarried:
68.1% (680)
Marital status - White alone, not Hispanic / Latino population 15 years and over
Males 37.2% Never married47.9% Now married0.4% Separated3.9% Widowed10.6% DivorcedFemales 26.1% Never married46.5% Now married1.7% Separated11.6% Widowed14.2% DivorcedWomen who gave birth in the past 12 months Now married:
77.4% (306)Unmarried:
22.6% (89)
Women who did not give birth in the past 12 months Now married:
45.2% (3,076)Unmarried:
54.8% (3,727)
Marital status - Hispanic or Latino population 15 years and over
Males 66.4% Never married29.9% Now married0.0% Separated0.0% Widowed3.6% DivorcedFemales 55.9% Never married31.8% Now married7.8% Separated1.5% Widowed3.0% DivorcedWomen who gave birth in the past 12 months Now married:
40.7% (68)Unmarried:
59.3% (99)
Women who did not give birth in the past 12 months Now married:
33.1% (273)Unmarried:
66.9% (552)
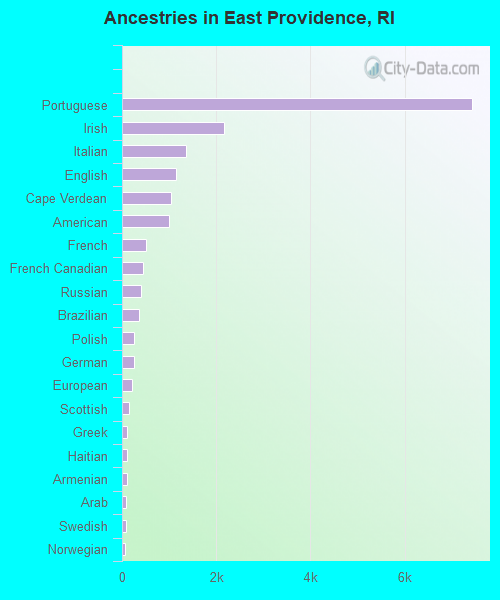
Ancestries in East Providence
7,422 31.6% Portuguese2,161 9.2% Irish1,363 5.8% Italian1,145 4.9% English1,041 4.4% Cape Verdean998 4.2% American501 2.1% French441 1.9% French Canadian396 1.7% Russian352 1.5% Brazilian258 1.1% Polish246 1.0% German220 0.9% European141 0.6% Scottish113 0.5% Greek104 0.4% Haitian99 0.4% Armenian91 0.4% Arab90 0.4% Swedish73 0.3% Norwegian52 0.2% Syrian48 0.2% Jamaican41 0.2% Lebanese35 0.1% Hungarian33 0.1% Scotch-Irish31 0.1% Dutch30 0.1% Barbadian25 0.1% Nigerian23 0.10% Canadian20 0.09% British18 0.08% Danish17 0.07% German Russian17 0.07% Iranian12 0.05% West Indian11 0.05% Liberian10 0.04% Welsh8 0.03% British West Indian7 0.03% Eastern European7 0.03% Northern European7 0.03% Swiss6 0.03% Lithuanian6 0.03% African
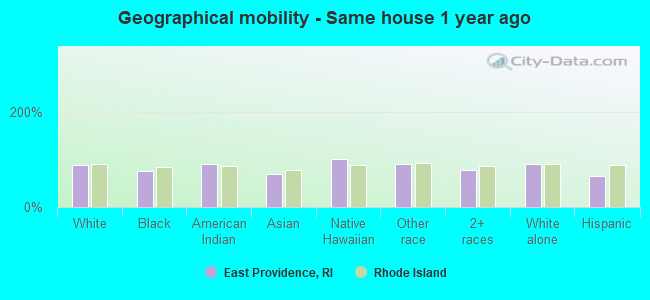
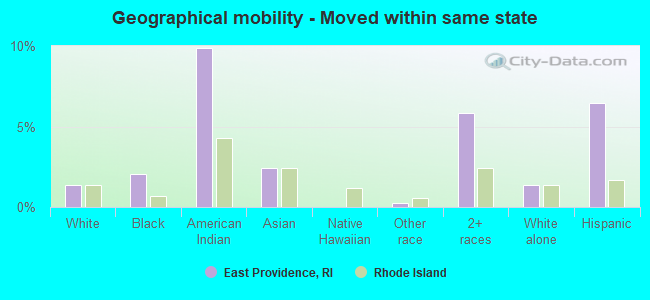
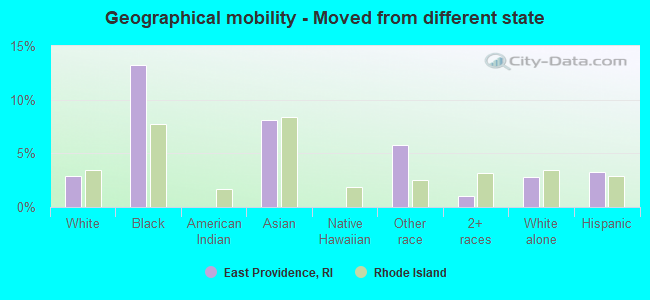
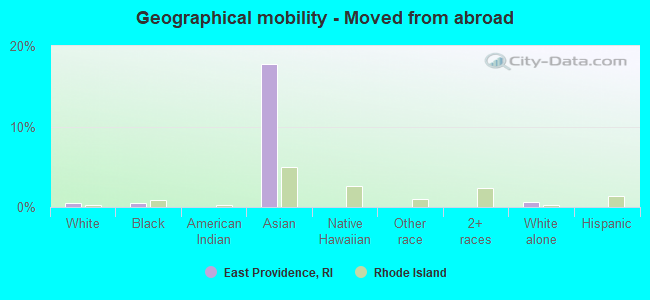
Geographical mobility in East Providence Same house 1 year ago 30,584 89.2% White (Caucasian)1,748 76.3% Black or African American93 91.5% American Indian / Alaska Native747 70.1% Asian23 100.0% Native Hawaiian / Pacific Islander1,790 90.3% Other race3,917 76.8% Two or more races31,557 89.9% White alone, not Hispanic / Latino2,492 64.6% Hispanic or LatinoMoved within same county 1,909 5.6% White / Caucasian237 10.3% Black or African American60 5.7% Asian95 4.8% Other race902 17.7% Two or more races1,737 4.9% White alone, not Hispanic / Latino977 25.3% Hispanic or LatinoMoved within same state 470 1.4% White / Caucasian47 2.0% Black or African American10 9.9% American Indian / Alaska Native26 2.4% Asian5 0.2% Other race298 5.8% Two or more races479 1.4% White alone, not Hispanic / Latino249 6.4% Hispanic or LatinoMoved from different state 1,001 2.9% White / Caucasian303 13.2% Black or African American86 8.1% Asian115 5.8% Other race53 1.0% Two or more races974 2.8% White alone, not Hispanic / Latino125 3.2% Hispanic or LatinoMoved from abroad 159 0.5% White10 0.4% Black or African American189 17.7% Asian204 0.6% White alone, not Hispanic / Latino
Children Nativity (place of birth) in East Providence
Children under 6 years - Living with two parents Both parents native 1,308 99.8% Native2 0.2% Foreign-bornBoth parents foreign-born 260 86.6% Native40 13.4% Foreign-bornOne native, one foreign-born parent 225 100.0% NativeChildren under 6 years - Living with one parent Native parent 741 100.0% NativeForeign-born parent 114 100.0% NativeChildren 6 to 17 years - Living with two parents Both parents native 2,671 99.3% Native18 0.7% Foreign-bornBoth parents foreign-born 306 90.7% Native31 9.3% Foreign-bornOne native, one foreign-born parent 241 100.0% NativeChildren 6 to 17 years - Living with one parent Native parent 1,238 100.0% NativeForeign-born parent 193 63.1% Native113 36.9% Foreign-born
Grandparents responsible for own grandchildren in East Providence
Grandparents (30 to 59 years) White / Caucasian 5 4.1% Responsible for grandchildren128 95.9% Not responsible for grandchildrenBlack or African American 11 100.0% Not responsible for grandchildrenTwo or more races 51 100.0% Not responsible for grandchildrenWhite alone, not Hispanic / Latino 9 5.4% Responsible for grandchildren152 94.6% Not responsible for grandchildrenGrandparents (60 years and over) White / Caucasian 16 12.9% Responsible for grandchildren111 87.1% Not responsible for grandchildrenBlack or African American 17 100.0% Not responsible for grandchildrenTwo or more races 52 100.0% Not responsible for grandchildrenWhite alone, not Hispanic / Latino 19 13.6% Responsible for grandchildren117 86.4% Not responsible for grandchildren