Races in East Murray, Oklahoma (OK) Detailed Stats
Ancestries, Foreign-born residents, place of birth
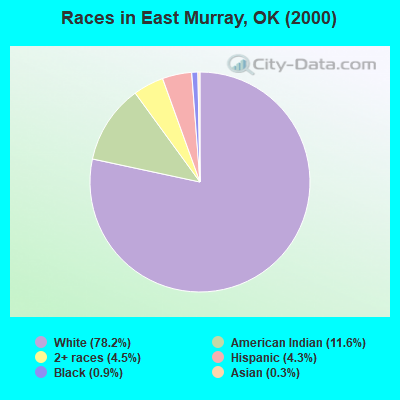
Race distribution in East Murray

- 5,94878.2%White alone
- 88311.6%American Indian alone
- 3394.5%Two or more races
- 3304.3%Hispanic
- 710.9%Black alone
- 260.3%Asian alone
- 50.07%Other race alone
- 20.03%Native Hawaiian and Other
Pacific Islander alone
2000
2022
-
- 2,556,36874.1%White alone
- 266,1587.7%American Indian alone
- 257,9817.5%Black alone
- 179,3045.2%Hispanic
- 140,2494.1%Two or more races
- 46,1721.3%Asian alone
- 2,3220.07%Other race alone
- 2,1000.06%Native Hawaiian and Other
Pacific Islander alone

-
- 2,517,40362.6%White alone
- 486,69212.1%Hispanic
- 364,4539.1%Two or more races
- 273,6506.8%American Indian alone
- 268,5436.7%Black alone
- 92,6722.3%Asian alone
- 10,7860.3%Other race alone
- 5,6010.1%Native Hawaiian and Other
Pacific Islander alone

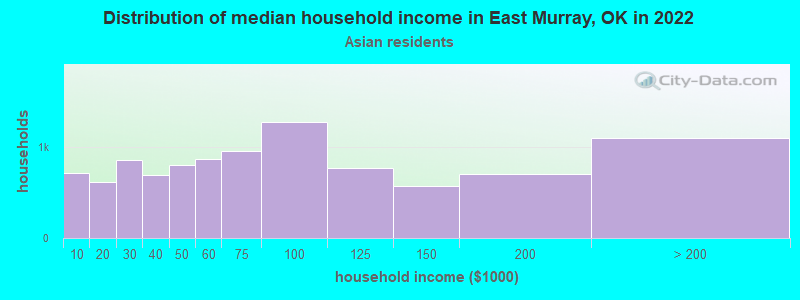
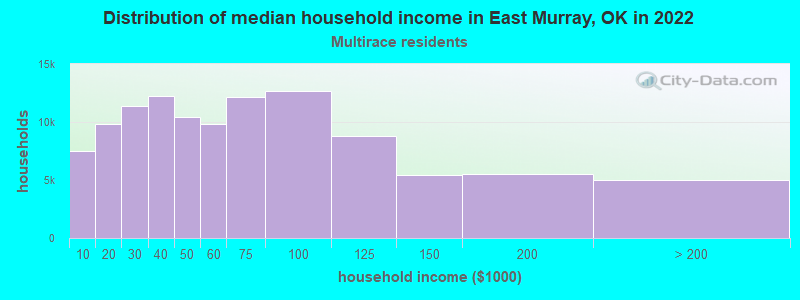
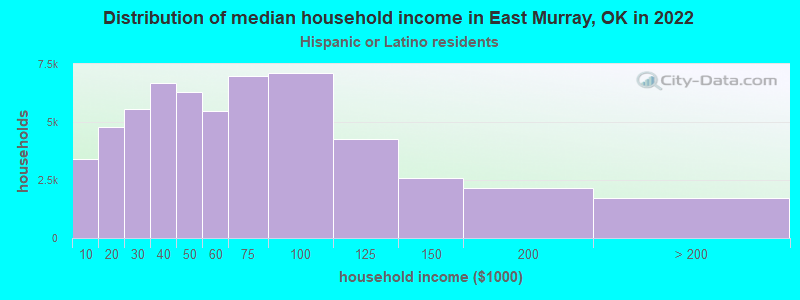
Income and house value in East Murray
- Median household income in 2022
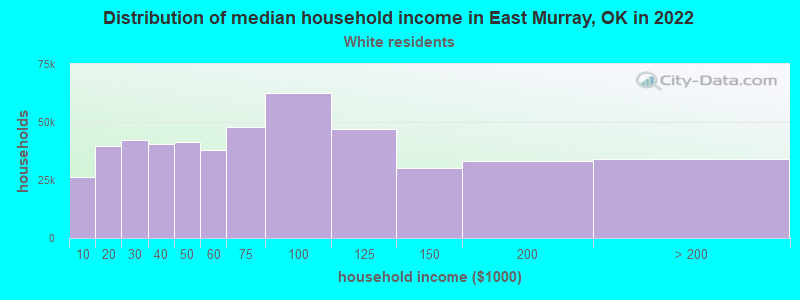
- $56,294White non-Hispanic householders
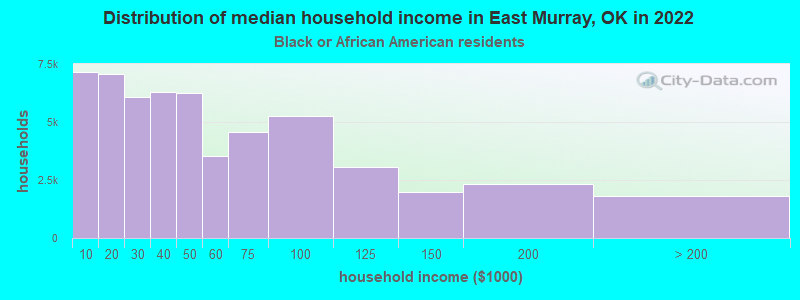
- $47,219Black householders
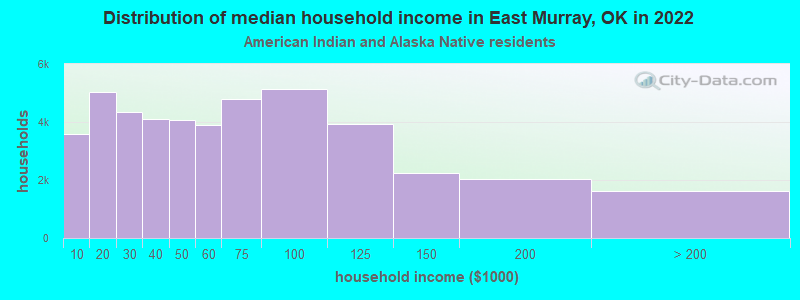
- $47,820American Indian and Alaska Native householders
- $36,680Asian householders
- $82,272Some other race householders
- $67,485Two or more races householders
- $48,032Hispanic or Latino race householders
- Median 2022 house value
- $170,833White Non-Hispanic householders
- $88,975Black or African American householders
- $137,831American Indian or Alaska Native householders
- $177,951Asian householders
- $175,363Some other race householders
- $132,007Two or more races householders
- $183,451Hispanic or Latino householders
Household income for White non-Hispanic householders
Household income for Black householders
Household income for American Indian and Alaska Native householders
Household income for Asian householders
Household income for Two or more races householders
Household income for Hispanic or Latino race householders
Zip code: 73086