Races in East Mayes, Oklahoma (OK) Detailed Stats
Ancestries, Foreign-born residents, place of birth
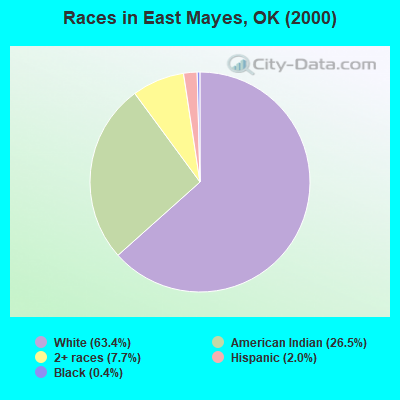
Race distribution in East Mayes

- 4,96463.4%White alone
- 2,07426.5%American Indian alone
- 6037.7%Two or more races
- 1532.0%Hispanic
- 300.4%Black alone
- 70.09%Asian alone
- 40.05%Other race alone
2000
2022
-
- 2,556,36874.1%White alone
- 266,1587.7%American Indian alone
- 257,9817.5%Black alone
- 179,3045.2%Hispanic
- 140,2494.1%Two or more races
- 46,1721.3%Asian alone
- 2,3220.07%Other race alone
- 2,1000.06%Native Hawaiian and Other
Pacific Islander alone

-
- 2,517,40362.6%White alone
- 486,69212.1%Hispanic
- 364,4539.1%Two or more races
- 273,6506.8%American Indian alone
- 268,5436.7%Black alone
- 92,6722.3%Asian alone
- 10,7860.3%Other race alone
- 5,6010.1%Native Hawaiian and Other
Pacific Islander alone

Income and house value in East Mayes
- Median household income in 2022
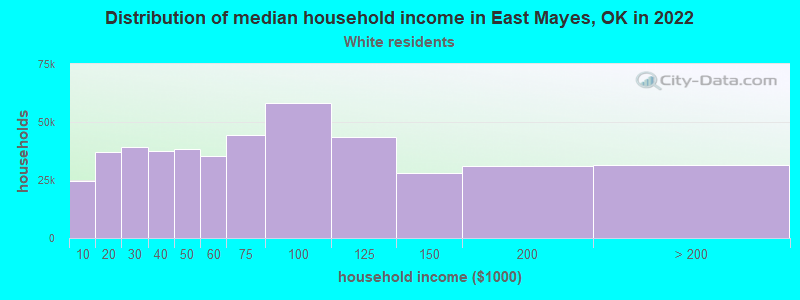
- $52,938White non-Hispanic householders
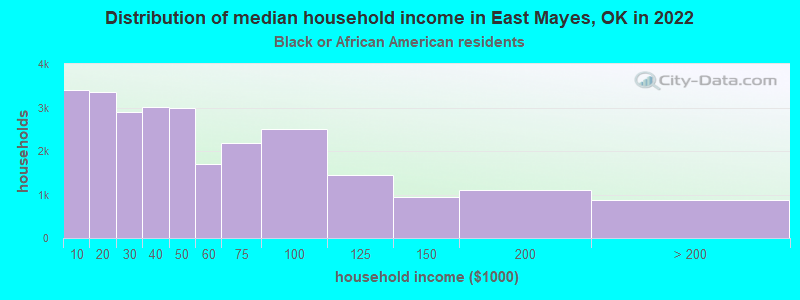
- $25,769Black householders
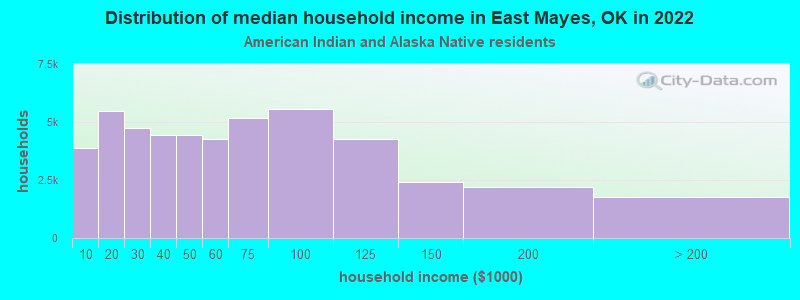
- $52,190American Indian and Alaska Native householders
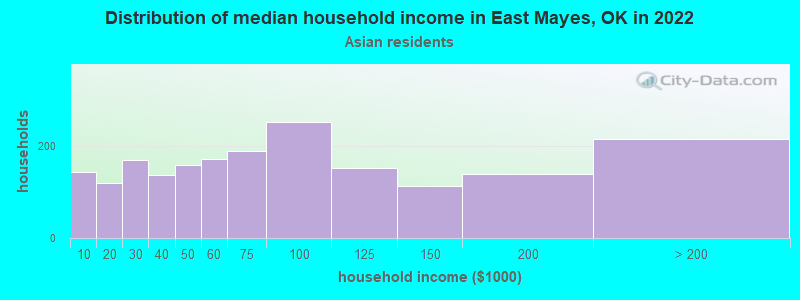
- $6,217Asian householders
- $58,198Some other race householders
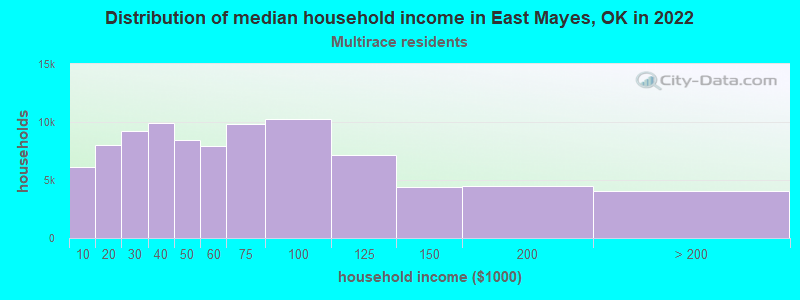
- $54,928Two or more races householders
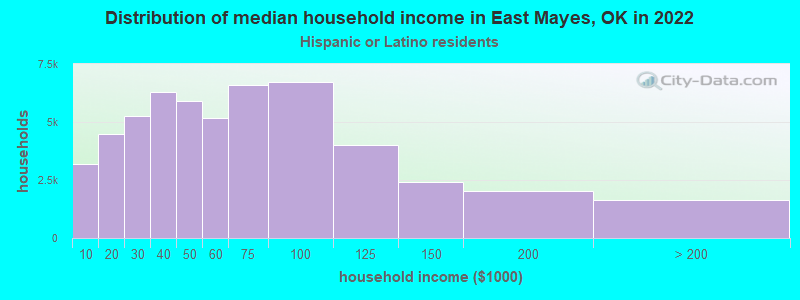
- $50,288Hispanic or Latino race householders
- Median 2022 house value
- $166,634White Non-Hispanic householders
- over $1,000,000Black or African American householders
- $129,845American Indian or Alaska Native householders
- $65,463Some other race householders
- $145,264Two or more races householders
- $137,149Hispanic or Latino householders
Household income for White non-Hispanic householders
Household income for Black householders
Household income for American Indian and Alaska Native householders
Household income for Asian householders
Household income for Two or more races householders
Household income for Hispanic or Latino race householders
Zip code: 74366