Races in East Fishkill, New York (NY) Detailed Stats
Ancestries, Foreign-born residents, place of birth

Recent posts about races in East Fishkill, New York on our local forum with over 2,400,000 registered users:
 | smaller Upstate NY cities and towns/African American communities (5987 replies) |
| Upper Middle class african-american communities in ny (2049 replies) |
| commuting from poughkeepsie to times square (30 replies) |
| Hopewell Junction, East Fishkill Commute To NYC (17 replies) |
| Up and coming towns in Dutchess and Putnam? (3 replies) |
| Is East Fishkill a transient area? (3 replies) |
7.1% of East Fishkill, NY residents are foreign-born (3.4% born in Europe, 2.3% born in Asia, 0.9% born in Latin America), which is 209.1% less than the foreign-born rate of 22.0% across the entire state of New York.
Race distribution in East Fishkill

- 22,94589.7%White alone
- 1,0354.0%Hispanic
- 7132.8%Asian alone
- 5632.2%Black alone
- 2731.1%Two or more races
- 310.1%American Indian alone
- 230.09%Other race alone
- 60.02%Native Hawaiian and Other
Pacific Islander alone
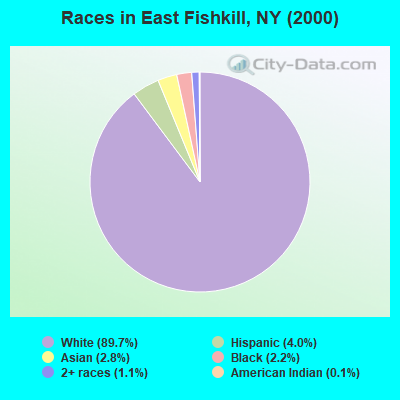
2000
2022
-
- 11,760,98162.0%White alone
- 2,867,58315.1%Hispanic
- 2,812,62314.8%Black alone
- 1,035,9265.5%Asian alone
- 366,1161.9%Two or more races
- 75,4990.4%Other race alone
- 52,4990.3%American Indian alone
- 5,2300.03%Native Hawaiian and Other
Pacific Islander alone

-
- 10,408,93352.9%White alone
- 3,867,29919.7%Hispanic
- 2,633,84013.4%Black alone
- 1,776,2869.0%Asian alone
- 732,6703.7%Two or more races
- 216,1101.1%Other race alone
- 35,0820.2%American Indian alone
- 6,9310.04%Native Hawaiian and Other
Pacific Islander alone

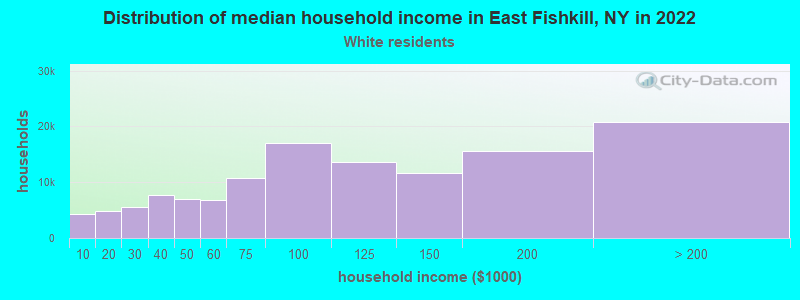
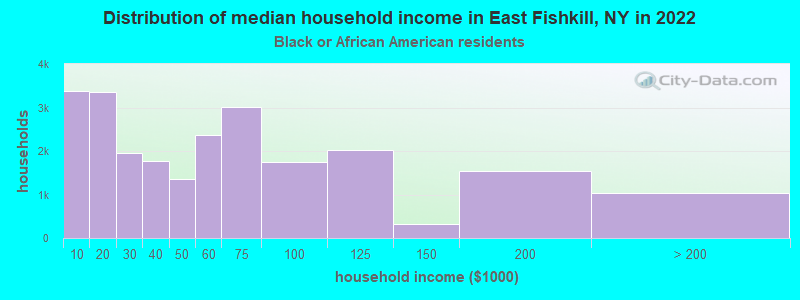
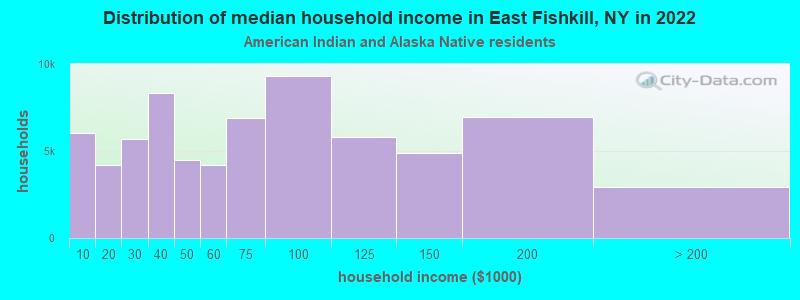
Income and house value in East Fishkill
- Median household income in 2022
- $138,288White non-Hispanic householders
- $115,225Black householders
- $197,417American Indian and Alaska Native householders
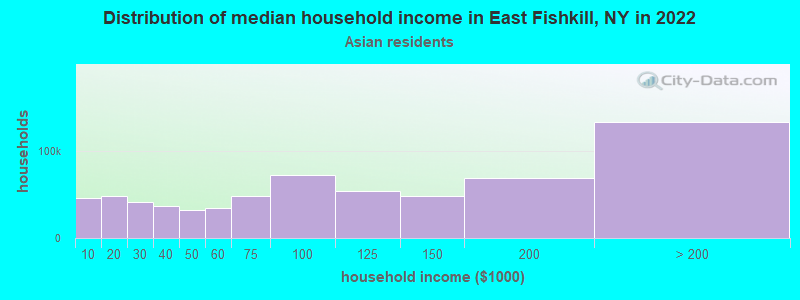
- $194,739Asian householders
- $61,385Some other race householders
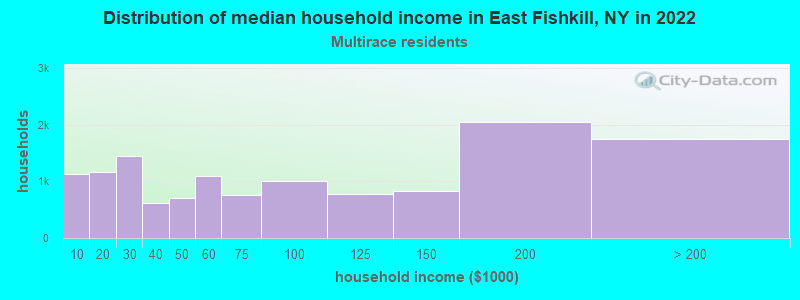
- $120,408Two or more races householders
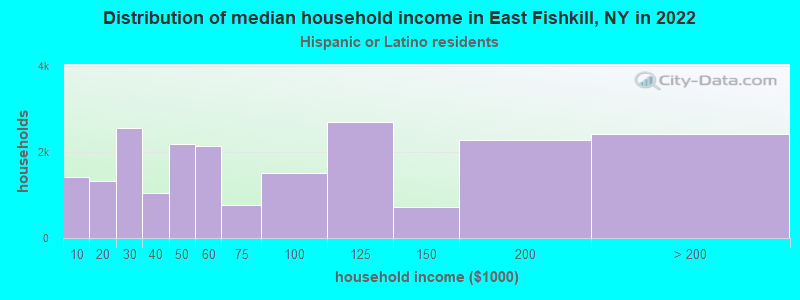
- $98,866Hispanic or Latino race householders
- Median 2022 house value
- $492,359White Non-Hispanic householders
- $444,142Black or African American householders
- $385,238American Indian or Alaska Native householders
- $602,712Asian householders
- $434,946Some other race householders
- $770,477Two or more races householders
- $477,696Hispanic or Latino householders
Household income for White non-Hispanic householders
Household income for Black householders
Household income for American Indian and Alaska Native householders
Household income for Asian householders
Household income for Two or more races householders
Household income for Hispanic or Latino race householders
Foreign-born residents in East Fishkill
1,821 residents are foreign born (3.4% Europe, 2.3% Asia, 0.9% Latin America).
| This city: | 7.1% |
| New York: | 20.4% |
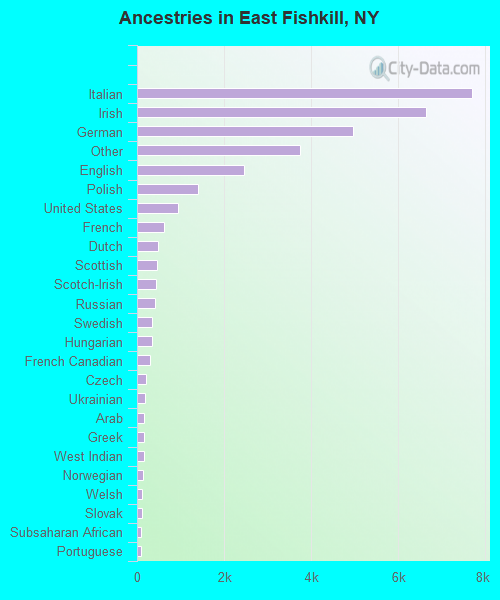
Ancestries in East Fishkill

- 7,70523.4%Italian
- 6,64020.2%Irish
- 4,97115.1%German
- 3,73911.4%Other
- 2,4667.5%English
- 1,3974.2%Polish
- 9532.9%United States
- 6151.9%French
- 4861.5%Dutch
- 4571.4%Scottish
- 4341.3%Scotch-Irish
- 4121.3%Russian
- 3541.1%Swedish
- 3461.1%Hungarian
- 2900.9%French Canadian
- 2050.6%Czech
- 1870.6%Ukrainian
- 1630.5%Arab
- 1590.5%Greek
- 1590.5%West Indian
- 1330.4%Norwegian
- 1150.3%Welsh
- 1090.3%Slovak
- 970.3%Subsaharan African
- 890.3%Portuguese
- 880.3%Danish
- 840.3%Lithuanian
- 610.2%Swiss
Zip codes: 12533.