Races in East De Baca, New Mexico (NM) Detailed Stats
Ancestries, Foreign-born residents, place of birth
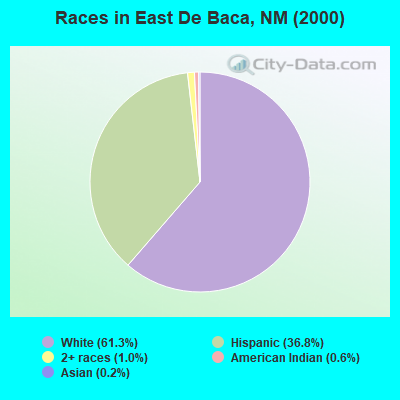
Race distribution in East De Baca

- 1,25061.3%White alone
- 75036.8%Hispanic
- 201.0%Two or more races
- 130.6%American Indian alone
- 40.2%Asian alone
- 10.05%Black alone
- 10.05%Other race alone
2000
2022
-
- 813,49544.7%White alone
- 765,38642.1%Hispanic
- 161,4608.9%American Indian alone
- 30,6541.7%Black alone
- 25,7931.4%Two or more races
- 18,2571.0%Asian alone
- 3,0090.2%Other race alone
- 9920.05%Native Hawaiian and Other
Pacific Islander alone

-
- 1,059,86750.2%Hispanic
- 735,47834.8%White alone
- 171,8088.1%American Indian alone
- 65,0843.1%Two or more races
- 36,8701.7%Black alone
- 35,8701.7%Asian alone
- 7,5820.4%Other race alone
- 7850.04%Native Hawaiian and Other
Pacific Islander alone

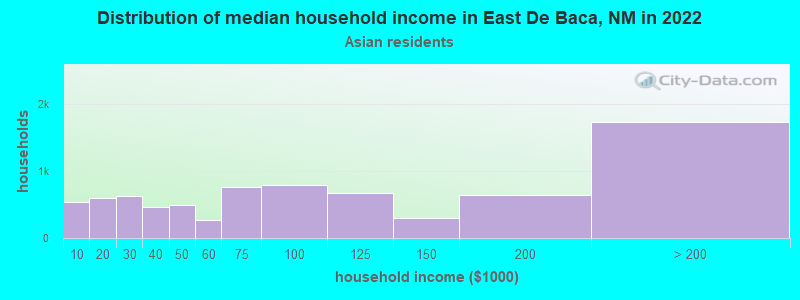
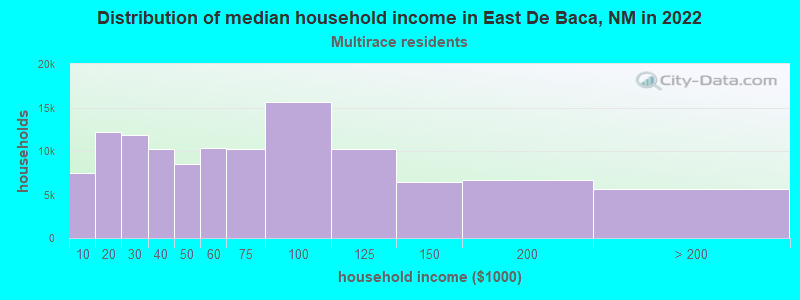
Income and house value in East De Baca
- Median household income in 2022
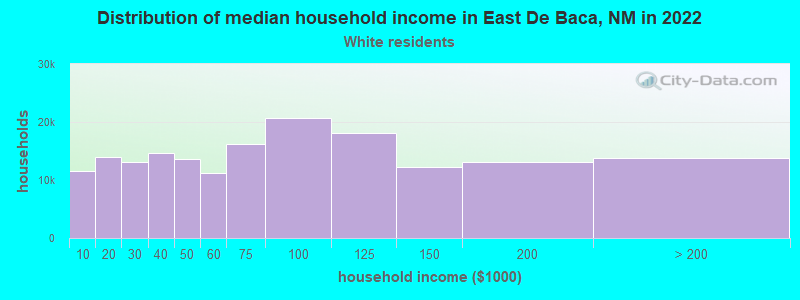
- $52,091White non-Hispanic householders
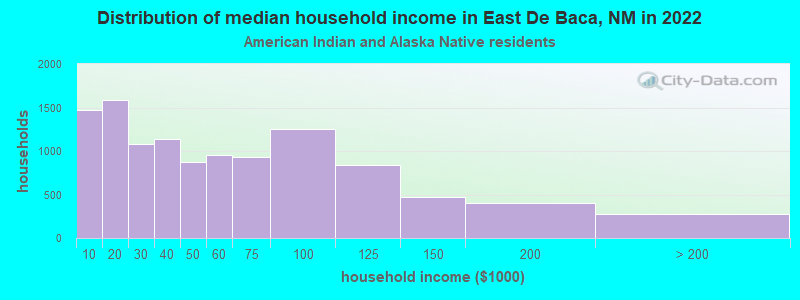
- $15,520American Indian and Alaska Native householders
- $36,422Asian householders
- $30,373Some other race householders
- $65,051Two or more races householders
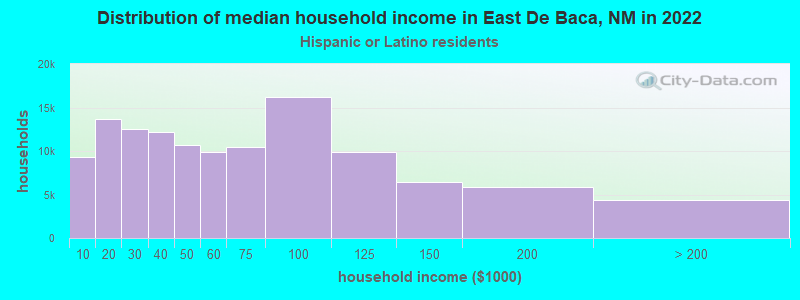
- $36,306Hispanic or Latino race householders
- Median 2022 house value
- $262,090White Non-Hispanic householders
- $264,494American Indian or Alaska Native householders
- $132,247Some other race householders
- $204,382Two or more races householders
- $164,467Hispanic or Latino householders
Household income for White non-Hispanic householders
Household income for American Indian and Alaska Native householders
Household income for Asian householders
Household income for Two or more races householders
Household income for Hispanic or Latino race householders