Races in Eagle Mountain, Texas (TX) Detailed Stats
Ancestries, Foreign-born residents, place of birth

Recent posts about races in Eagle Mountain, Texas on our local forum with over 2,400,000 registered users:
 | No Richland Hills apartment (4 replies) |
| Ft. Worth a good place to live? (49 replies) |
| 46 yr old, divorced female moving to Fort Worth (24 replies) |
| Looking at houses/suburbs next week for Chicago to Dallas move (14 replies) |
| Best FTW area restaurants (19 replies) |
| Who has the best fried catfish in Fort Worth? (32 replies) |
2.8% of Eagle Mountain, TX residents are foreign-born (0.7% born in Europe, 0.7% born in Asia, 0.6% born in Latin America, 0.6% born in North America), which is 496.7% less than the foreign-born rate of 17.0% across the entire state of Texas.
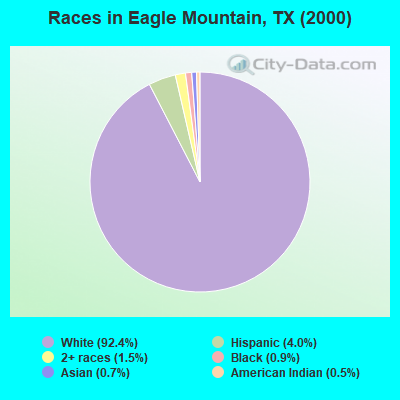
Race distribution in Eagle Mountain

- 6,09892.4%White alone
- 2634.0%Hispanic
- 961.5%Two or more races
- 600.9%Black alone
- 460.7%Asian alone
- 340.5%American Indian alone
- 20.03%Native Hawaiian and Other
Pacific Islander alone
2000
2022
-
- 10,933,31352.4%White alone
- 6,669,66632.0%Hispanic
- 2,364,25511.3%Black alone
- 554,4452.7%Asian alone
- 230,5671.1%Two or more races
- 68,8590.3%American Indian alone
- 19,9580.10%Other race alone
- 10,7570.05%Native Hawaiian and Other
Pacific Islander alone

-
- 12,070,64240.2%Hispanic
- 11,683,43038.9%White alone
- 3,508,70611.7%Black alone
- 1,608,1735.4%Asian alone
- 956,5603.2%Two or more races
- 125,7630.4%Other race alone
- 47,0230.2%American Indian alone
- 29,2750.10%Native Hawaiian and Other
Pacific Islander alone

Income and house value in Eagle Mountain
- Median household income in 2022
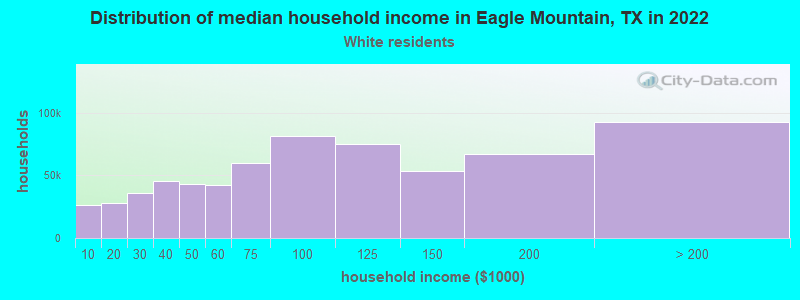
- $134,835White non-Hispanic householders
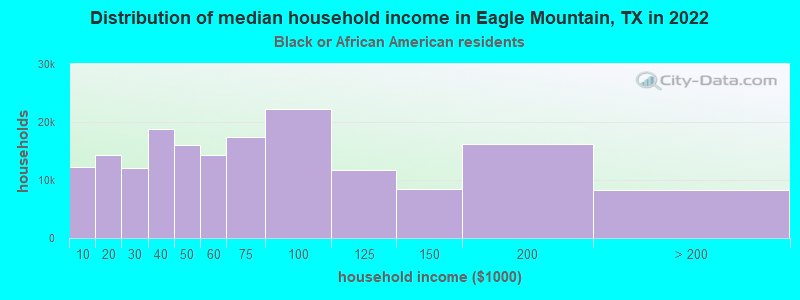
- $71,066Black householders
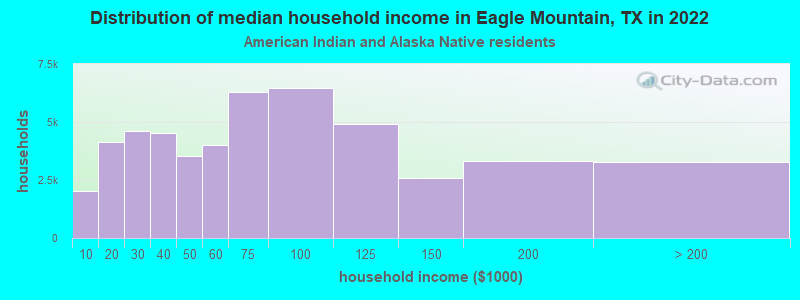
- $91,559American Indian and Alaska Native householders
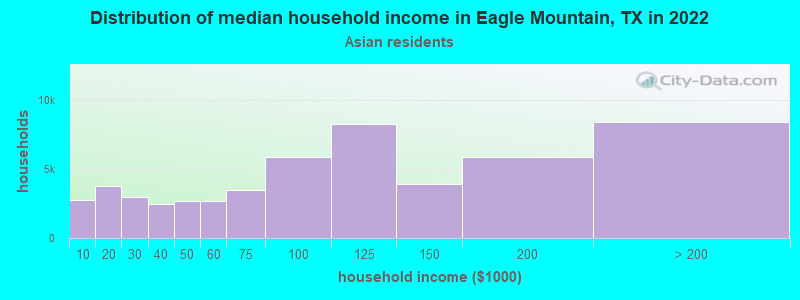
- $125,426Asian householders
- $149,042Some other race householders
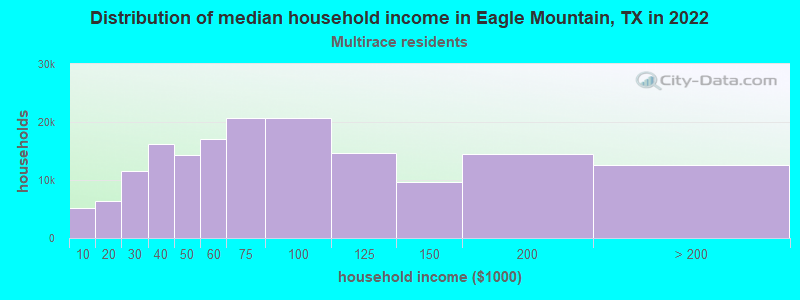
- $86,138Two or more races householders
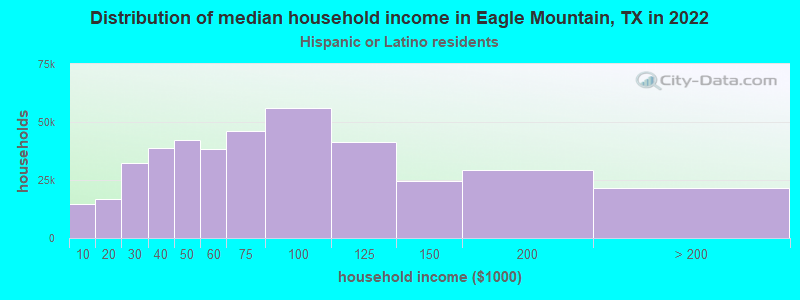
- $141,375Hispanic or Latino race householders
- Median 2022 house value
- $584,724White Non-Hispanic householders
- over $1,000,000Asian householders
- $572,051Some other race householders
- $566,418Two or more races householders
- $506,221Hispanic or Latino householders
Household income for White non-Hispanic householders
Household income for Black householders
Household income for American Indian and Alaska Native householders
Household income for Asian householders
Household income for Two or more races householders
Household income for Hispanic or Latino race householders
Foreign-born residents in Eagle Mountain
188 residents are foreign born (0.7% Europe, 0.7% Asia, 0.6% Latin America, 0.6% North America).
| This city: | 2.8% |
| Texas: | 13.9% |
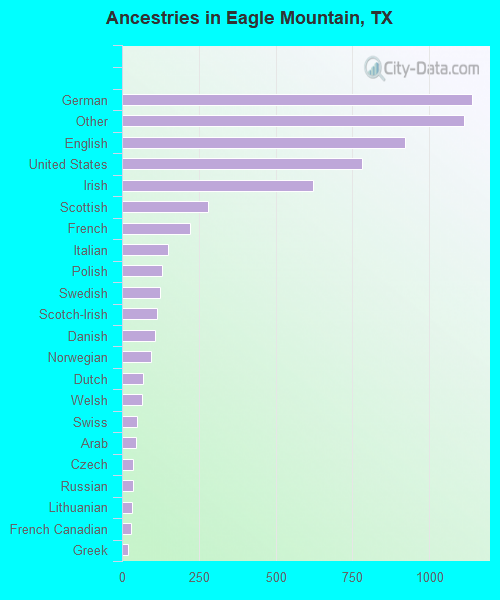
Ancestries in Eagle Mountain

- 1,13818.4%German
- 1,11418.0%Other
- 92114.9%English
- 78212.7%United States
- 62310.1%Irish
- 2804.5%Scottish
- 2203.6%French
- 1502.4%Italian
- 1302.1%Polish
- 1252.0%Swedish
- 1131.8%Scotch-Irish
- 1061.7%Danish
- 931.5%Norwegian
- 671.1%Dutch
- 661.1%Welsh
- 480.8%Swiss
- 440.7%Arab
- 360.6%Czech
- 350.6%Russian
- 310.5%Lithuanian
- 290.5%French Canadian
- 210.3%Greek
- 80.1%Slovak
Zip codes: 76179.