Races in Dunedin, Florida (FL) Detailed Stats
Data:
Races - White alone (%)
Races - White alone (% change since 2000)
Races - Black alone (%)
Races - Black alone (% change since 2000)
Races - American Indian alone (%)
Races - American Indian alone (% change since 2000)
Races - Asian alone (%)
Races - Asian alone (% change since 2000)
Races - Hispanic (%)
Races - Hispanic (% change since 2000)
Races - Native Hawaiian and Other Pacific Islander alone (%)
Races - Native Hawaiian and Other Pacific Islander alone (% change since 2000)
Races - Two or more races(%)
Races - Two or more races(% change since 2000)
Races - Other race alone (%)
Races - Other race alone (% change since 2000)
Racial diversity
Place of birth - Born in state of residence (%)
Place of birth - Born in state of residence (%) - White
Place of birth - Born in state of residence (%) - Black or African American
Place of birth - Born in state of residence (%) - Asian
Place of birth - Born in state of residence (%) - Hispanic or Latino
Place of birth - Born in state of residence (%) - American Indian and Alaska Native
Place of birth - Born in state of residence (%) - Multirace
Place of birth - Born in state of residence (%) - Other Race
Place of birth - Born in other state (%)
Place of birth - Born in other state (%) - White
Place of birth - Born in other state (%) - Black or African American
Place of birth - Born in other state (%) - Asian
Place of birth - Born in other state (%) - Hispanic or Latino
Place of birth - Born in other state (%) - American Indian and Alaska Native
Place of birth - Born in other state (%) - Multirace
Place of birth - Born in other state (%) - Other Race
Place of birth - Native, outside of US (%)
Place of birth - Native, outside of US (%) - White
Place of birth - Native, outside of US (%) - Black or African American
Place of birth - Native, outside of US (%) - Asian
Place of birth - Native, outside of US (%) - Hispanic or Latino
Place of birth - Native, outside of US (%) - American Indian and Alaska Native
Place of birth - Native, outside of US (%) - Multirace
Place of birth - Native, outside of US (%) - Other Race
Place of birth - Foreign born (%)
Place of birth - Foreign born (%) - White
Place of birth - Foreign born (%) - Black or African American
Place of birth - Foreign born (%) - Asian
Place of birth - Foreign born (%) - Hispanic or Latino
Place of birth - Foreign born (%) - American Indian and Alaska Native
Place of birth - Foreign born (%) - Multirace
Place of birth - Foreign born (%) - Other Race
Residents speaking English at home (%)
Residents speaking English at home - Born in the United States (%)
Residents speaking English at home - Native, born elsewhere (%)
Residents speaking English at home - Foreign born (%)
Residents speaking Spanish at home (%)
Residents speaking Spanish at home - Born in the United States (%)
Residents speaking Spanish at home - Native, born elsewhere (%)
Residents speaking Spanish at home - Foreign born (%)
Residents speaking other language at home (%)
Residents speaking other language at home - Born in the United States (%)
Residents speaking other language at home - Native, born elsewhere (%)
Residents speaking other language at home - Foreign born (%)
Marital status - Never married (%)
Marital status - Now married (%)
Marital status - Separated (%)
Marital status - Widowed (%)
Marital status - Divorced (%)
Ancestries Reported - Arab (%)
Ancestries Reported - Czech (%)
Ancestries Reported - Danish (%)
Ancestries Reported - Dutch (%)
Ancestries Reported - English (%)
Ancestries Reported - French (%)
Ancestries Reported - French Canadian (%)
Ancestries Reported - German (%)
Ancestries Reported - Greek (%)
Ancestries Reported - Hungarian (%)
Ancestries Reported - Irish (%)
Ancestries Reported - Italian (%)
Ancestries Reported - Lithuanian (%)
Ancestries Reported - Norwegian (%)
Ancestries Reported - Polish (%)
Ancestries Reported - Portuguese (%)
Ancestries Reported - Russian (%)
Ancestries Reported - Scotch-Irish (%)
Ancestries Reported - Scottish (%)
Ancestries Reported - Slovak (%)
Ancestries Reported - Subsaharan African (%)
Ancestries Reported - Swedish (%)
Ancestries Reported - Swiss (%)
Ancestries Reported - Ukrainian (%)
Ancestries Reported - United States (%)
Ancestries Reported - Welsh (%)
Ancestries Reported - West Indian (%)
Ancestries Reported - Other (%)
Geographical mobility - Same house 1 year ago (%)
Geographical mobility - Same house 1 year ago (%) - White
Geographical mobility - Same house 1 year ago (%) - Black or African American
Geographical mobility - Same house 1 year ago (%) - Asian
Geographical mobility - Same house 1 year ago (%) - Hispanic or Latino
Geographical mobility - Same house 1 year ago (%) - American Indian and Alaska Native
Geographical mobility - Same house 1 year ago (%) - Multirace
Geographical mobility - Same house 1 year ago (%) - Other Race
Geographical mobility - Moved within same county (%)
Geographical mobility - Moved within same county (%) - White
Geographical mobility - Moved within same county (%) - Black or African American
Geographical mobility - Moved within same county (%) - Asian
Geographical mobility - Moved within same county (%) - Hispanic or Latino
Geographical mobility - Moved within same county (%) - American Indian and Alaska Native
Geographical mobility - Moved within same county (%) - Multirace
Geographical mobility - Moved within same county (%) - Other Race
Geographical mobility - Moved from different county within same state (%)
Geographical mobility - Moved from different county within same state (%) - White
Geographical mobility - Moved from different county within same state (%) - Black or African American
Geographical mobility - Moved from different county within same state (%) - Asian
Geographical mobility - Moved from different county within same state (%) - Hispanic or Latino
Geographical mobility - Moved from different county within same state (%) - American Indian and Alaska Native
Geographical mobility - Moved from different county within same state (%) - Multirace
Geographical mobility - Moved from different county within same state (%) - Other Race
Geographical mobility - Moved from different state (%)
Geographical mobility - Moved from different state (%) - White
Geographical mobility - Moved from different state (%) - Black or African American
Geographical mobility - Moved from different state (%) - Asian
Geographical mobility - Moved from different state (%) - Hispanic or Latino
Geographical mobility - Moved from different state (%) - American Indian and Alaska Native
Geographical mobility - Moved from different state (%) - Multirace
Geographical mobility - Moved from different state (%) - Other Race
Geographical mobility - Moved from abroad (%)
Geographical mobility - Moved from abroad (%) - White
Geographical mobility - Moved from abroad (%) - Black or African American
Geographical mobility - Moved from abroad (%) - Asian
Geographical mobility - Moved from abroad (%) - Hispanic or Latino
Geographical mobility - Moved from abroad (%) - American Indian and Alaska Native
Geographical mobility - Moved from abroad (%) - Multirace
Geographical mobility - Moved from abroad (%) - Other Race
Place of birth for the foreign-born population - Ireland (%)
Place of birth for the foreign-born population - Denmark (%)
Place of birth for the foreign-born population - Norway (%)
Place of birth for the foreign-born population - Sweden (%)
Place of birth for the foreign-born population - United Kingdom (%)
Place of birth for the foreign-born population - England (%)
Place of birth for the foreign-born population - Scotland (%)
Place of birth for the foreign-born population - Other Northern Europe (%)
Place of birth for the foreign-born population - Austria (%)
Place of birth for the foreign-born population - Belgium (%)
Place of birth for the foreign-born population - France (%)
Place of birth for the foreign-born population - Germany (%)
Place of birth for the foreign-born population - Netherlands (%)
Place of birth for the foreign-born population - Switzerland (%)
Place of birth for the foreign-born population - Other Western Europe (%)
Place of birth for the foreign-born population - Greece (%)
Place of birth for the foreign-born population - Italy (%)
Place of birth for the foreign-born population - Portugal (%)
Place of birth for the foreign-born population - Spain (%)
Place of birth for the foreign-born population - Other Southern Europe (%)
Place of birth for the foreign-born population - Albania (%)
Place of birth for the foreign-born population - Belarus (%)
Place of birth for the foreign-born population - Bosnia and Herzegovina (%)
Place of birth for the foreign-born population - Bulgaria (%)
Place of birth for the foreign-born population - Croatia (%)
Place of birth for the foreign-born population - Czechoslovakia (%)
Place of birth for the foreign-born population - Hungary (%)
Place of birth for the foreign-born population - Latvia (%)
Place of birth for the foreign-born population - Lithuania (%)
Place of birth for the foreign-born population - North Macedonia (Macedonia) (%)
Place of birth for the foreign-born population - Moldova (%)
Place of birth for the foreign-born population - Poland (%)
Place of birth for the foreign-born population - Romania (%)
Place of birth for the foreign-born population - Russia (%)
Place of birth for the foreign-born population - Serbia (%)
Place of birth for the foreign-born population - Ukraine (%)
Place of birth for the foreign-born population - Other Eastern Europe (%)
Place of birth for the foreign-born population - China (%)
Place of birth for the foreign-born population - Hong Kong (%)
Place of birth for the foreign-born population - Taiwan (%)
Place of birth for the foreign-born population - Japan (%)
Place of birth for the foreign-born population - Korea (%)
Place of birth for the foreign-born population - Other Eastern Asia (%)
Place of birth for the foreign-born population - Afghanistan (%)
Place of birth for the foreign-born population - Bangladesh (%)
Place of birth for the foreign-born population - India (%)
Place of birth for the foreign-born population - Iran (%)
Place of birth for the foreign-born population - Kazakhstan (%)
Place of birth for the foreign-born population - Nepal (%)
Place of birth for the foreign-born population - Pakistan (%)
Place of birth for the foreign-born population - Sri Lanka (%)
Place of birth for the foreign-born population - Uzbekistan (%)
Place of birth for the foreign-born population - Other South Central Asia (%)
Place of birth for the foreign-born population - Burma (%)
Place of birth for the foreign-born population - Cambodia (%)
Place of birth for the foreign-born population - Indonesia (%)
Place of birth for the foreign-born population - Laos (%)
Place of birth for the foreign-born population - Malaysia (%)
Place of birth for the foreign-born population - Philippines (%)
Place of birth for the foreign-born population - Singapore (%)
Place of birth for the foreign-born population - Thailand (%)
Place of birth for the foreign-born population - Vietnam (%)
Place of birth for the foreign-born population - Other South Eastern Asia (%)
Place of birth for the foreign-born population - Armenia (%)
Place of birth for the foreign-born population - Iraq (%)
Place of birth for the foreign-born population - Israel (%)
Place of birth for the foreign-born population - Jordan (%)
Place of birth for the foreign-born population - Kuwait (%)
Place of birth for the foreign-born population - Lebanon (%)
Place of birth for the foreign-born population - Saudi Arabia (%)
Place of birth for the foreign-born population - Syria (%)
Place of birth for the foreign-born population - Turkey (%)
Place of birth for the foreign-born population - Yemen (%)
Place of birth for the foreign-born population - Other Western Asia (%)
Place of birth for the foreign-born population - Eritrea (%)
Place of birth for the foreign-born population - Ethiopia (%)
Place of birth for the foreign-born population - Kenya (%)
Place of birth for the foreign-born population - Somalia (%)
Place of birth for the foreign-born population - Uganda (%)
Place of birth for the foreign-born population - Zimbabwe (%)
Place of birth for the foreign-born population - Other Eastern Africa (%)
Place of birth for the foreign-born population - Cameroon (%)
Place of birth for the foreign-born population - Congo (%)
Place of birth for the foreign-born population - Democratic Republic of Congo (Zaire) (%)
Place of birth for the foreign-born population - Other Middle Africa (%)
Place of birth for the foreign-born population - Egypt (%)
Place of birth for the foreign-born population - Morocco (%)
Place of birth for the foreign-born population - Sudan (%)
Place of birth for the foreign-born population - Other Northern Africa (%)
Place of birth for the foreign-born population - South Africa (%)
Place of birth for the foreign-born population - Other Southern Africa (%)
Place of birth for the foreign-born population - Cabo Verde (%)
Place of birth for the foreign-born population - Ghana (%)
Place of birth for the foreign-born population - Liberia (%)
Place of birth for the foreign-born population - Nigeria (%)
Place of birth for the foreign-born population - Senegal (%)
Place of birth for the foreign-born population - Sierra Leone (%)
Place of birth for the foreign-born population - Other Western Africa (%)
Place of birth for the foreign-born population - Australia (%)
Place of birth for the foreign-born population - New Zealand (%)
Place of birth for the foreign-born population - Fiji (%)
Place of birth for the foreign-born population - Micronesia (%)
Place of birth for the foreign-born population - Bahamas (%)
Place of birth for the foreign-born population - Barbados (%)
Place of birth for the foreign-born population - Cuba (%)
Place of birth for the foreign-born population - Dominica (%)
Place of birth for the foreign-born population - Dominican Republic (%)
Place of birth for the foreign-born population - Grenada (%)
Place of birth for the foreign-born population - Haiti (%)
Place of birth for the foreign-born population - Jamaica (%)
Place of birth for the foreign-born population - St. Vincent and the Grenadines (%)
Place of birth for the foreign-born population - Trinidad and Tobago (%)
Place of birth for the foreign-born population - West Indies (%)
Place of birth for the foreign-born population - Other Caribbean (%)
Place of birth for the foreign-born population - Belize (%)
Place of birth for the foreign-born population - Costa Rica (%)
Place of birth for the foreign-born population - El Salvador (%)
Place of birth for the foreign-born population - Guatemala (%)
Place of birth for the foreign-born population - Honduras (%)
Place of birth for the foreign-born population - Mexico (%)
Place of birth for the foreign-born population - Nicaragua (%)
Place of birth for the foreign-born population - Panama (%)
Place of birth for the foreign-born population - Other Central America (%)
Place of birth for the foreign-born population - Argentina (%)
Place of birth for the foreign-born population - Bolivia (%)
Place of birth for the foreign-born population - Brazil (%)
Place of birth for the foreign-born population - Chile (%)
Place of birth for the foreign-born population - Colombia (%)
Place of birth for the foreign-born population - Ecuador (%)
Place of birth for the foreign-born population - Guyana (%)
Place of birth for the foreign-born population - Peru (%)
Place of birth for the foreign-born population - Uruguay (%)
Place of birth for the foreign-born population - Venezuela (%)
Place of birth for the foreign-born population - Other South America (%)
Place of birth for the foreign-born population - Canada (%)
Place of birth for the foreign-born population - Other Northern America (%)
Place of birth for the foreign-born population - Other (%)
Latest news about races in Dunedin, FL collected exclusively by city-data.com from local newspapers, TV, and radio stations
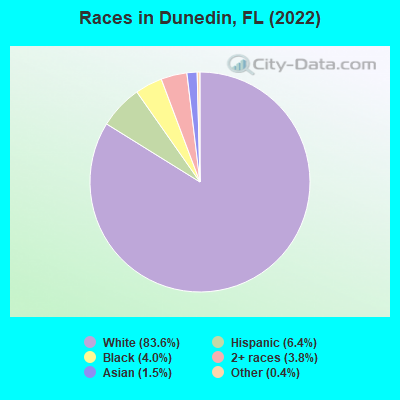
According to 2022 data, the most numerous races in Dunedin, FL are White alone (30,227 residents), Hispanic (2,319 residents), and Black alone (1,433 residents). 90.7% of Dunedin residents speak English at home. 9.9% of Dunedin, FL residents are foreign-born (4.0% born in Europe, 2.2% born in Latin America, 1.7% born in North America, 1.4% born in Asia), which is 111.7% less than the foreign-born rate of 21.0% across the entire state of Florida.
Race distribution in Dunedin
2000 2022
10,458,509 65.4% White alone 2,682,715 16.8% Hispanic 2,264,268 14.2% Black alone 261,693 1.6% Asian alone 236,954 1.5% Two or more races 42,358 0.3% American Indian alone 28,994 0.2% Other race alone 6,887 0.04% Native Hawaiian and Other
11,309,403 50.8% White alone 6,025,039 27.1% Hispanic 3,241,015 14.6% Black alone 861,630 3.9% Two or more races 623,692 2.8% Asian alone 152,054 0.7% Other race alone 22,504 0.1% American Indian alone 9,486 0.04% Native Hawaiian and Other
Income and house value in Dunedin Median household income in 2022 $62,120 White non-Hispanic householders$134,348 Asian householders$64,402 Two or more races householders$52,913 Hispanic or Latino race householdersMedian 2022 house value $408,201 White Non-Hispanic householders$297,957 Black or African American householders over $1,000,000 Asian householders$612,089 Some other race householders$370,743 Two or more races householders$463,110 Hispanic or Latino householders
Median age by race in Dunedin
60.5 Median age for White residents59.6 61.5 36.4 Median age for Black or African American residents33.1 43.0 -323,450,134.4 Median age for American Indian / Alaska Native residents-535,303,776.1 -323,863,636.0 54.6 Median age for Asian residents56.0 51.9 15.3 Median age for Native Hawaiian / Pacific Islander residents-663,446,054.1 -373,522,458.3 38.2 Median age for Other race residents40.2 37.7 26.8 Median age for Two or more races residents26.4 27.5 60.6 Median age for White alone residents59.8 61.4 35.7 Median age for Hispanic or Latino residents34.7 38.9
Owner/renter occupied households by race in Dunedin
House owners and renters - White residents 11,561 71.4% Owner occupied4,632 28.6% Renter occupiedHouse owners and renters - Black or African American residents 158 39.8% Owner occupied239 60.2% Renter occupiedHouse owners and renters - American Indian / Alaska Native residents 5 100.0% Renter occupiedHouse owners and renters - Asian residents 123 89.8% Owner occupied14 10.2% Renter occupiedHouse owners and renters - Other race residents 48 59.6% Owner occupied33 40.4% Renter occupiedHouse owners and renters - Two or more races residents 365 49.2% Owner occupied378 50.8% Renter occupiedHouse owners and renters - White alone residents 11,602 71.9% Owner occupied4,544 28.1% Renter occupiedHouse owners and renters - Hispanic or Latino residents 249 31.2% Owner occupied550 68.8% Renter occupied
Language usage in Dunedin
English speakers - Total 90.7% of residents of Dunedin speak English at home.
3.2% of residents speak Spanish at home 679 60.6% Speak English very well441 39.4% Speak English less than very well5.7% of residents speak other language at home 1,360 67.8% Speak English very well646 32.2% Speak English less than very well
English speakers - Born in the United States 98.0% of residents of Dunedin speak English at home.
0.8% of residents speak Spanish at home 167 90.8% Speak English very well17 9.2% Speak English less than very well1.1% of residents speak other language at home 206 81.1% Speak English very well48 18.9% Speak English less than very well
English speakers - Native, born elsewhere 62.2% of residents of Dunedin speak English at home.
40.7% of residents speak Spanish at home 80 51.6% Speak English very well75 48.4% Speak English less than very well
English speakers - Foreign-born 34.6% of residents of Dunedin speak English at home.
15.2% of residents speak Spanish at home 211 39.7% Speak English very well320 60.3% Speak English less than very well48.4% of residents speak other language at home 1,093 64.7% Speak English very well596 35.3% Speak English less than very well
White (Caucasian) - Speak only English Native:
98.7% (27,002)Foreign-born:
45.4% (925)
White (Caucasian) - Speak another language Native:
1.9% (511)Foreign-born:
54.8% (1,118)
Asian - Speak only English Native:
66.7% (77)Foreign-born:
35.1% (143)
Asian - Speak another language Native:
32.6% (37)Foreign-born:
65.2% (266)
Native Hawaiian / Pacific Islander - Speak only English Native:
87.6% (13)Foreign-born:
100.0% (6)
Other race - Speak only English Native:
53.2% (89)Foreign-born:
15.5% (39)
Other race - Speak another language Native:
46.8% (78)Foreign-born:
83.6% (211)
Two or more races - Speak only English Native:
88.6% (1,988)Foreign-born:
12.4% (91)
Two or more races - Speak another language Native:
12.2% (274)Foreign-born:
87.4% (643)
White alone - Speak only English Native:
99.1% (26,809)Foreign-born:
41.9% (960)
White alone - Speak another language Native:
1.2% (318)Foreign-born:
57.8% (1,324)
Hispanic or Latino - Speak only English Native:
64.3% (1,089)Foreign-born:
1.7% (9)
Hispanic or Latino - Speak another language Native:
34.7% (587)Foreign-born:
100.0% (517)
Foreign-born residents in Dunedin 3,586 residents are foreign born (4.0% Europe , 2.2% Latin America , 1.7% North America , 1.4% Asia ).
This city:
9.9%Florida:
21.1%
Marital status for residents in Dunedin Marital status - White (Caucasian) population 15 years and over
Males 22.4% Never married56.8% Now married1.0% Separated5.2% Widowed14.5% DivorcedFemales 17.1% Never married46.1% Now married1.1% Separated17.2% Widowed18.4% DivorcedWomen who gave birth in the past 12 months Now married:
100.0% (96)Unmarried:
0.0% (0)
Women who did not give birth in the past 12 months Now married:
47.0% (1,910)Unmarried:
53.0% (2,150)
Marital status - Black or African American population 15 years and over
Males 55.8% Never married40.0% Now married0.0% Separated1.4% Widowed2.8% DivorcedFemales 15.3% Never married24.6% Now married11.2% Separated6.2% Widowed42.7% DivorcedWomen who did not give birth in the past 12 months Now married:
47.9% (139)Unmarried:
52.1% (151)
Marital status - American Indian / Alaska Native population 15 years and over
Males 0.0% Never married0.0% Now married0.0% Separated0.0% Widowed100.0% DivorcedFemales 0.0% Never married100.0% Now married0.0% Separated0.0% Widowed0.0% DivorcedMarital status - Asian population 15 years and over
Males 32.3% Never married63.4% Now married0.0% Separated4.3% Widowed0.0% DivorcedFemales 37.4% Never married58.1% Now married0.0% Separated0.8% Widowed3.7% DivorcedWomen who gave birth in the past 12 months Now married:
100.0% (11)Unmarried:
0.0% (0)
Women who did not give birth in the past 12 months Now married:
18.2% (26)Unmarried:
81.8% (118)
Marital status - Native Hawaiian / Pacific Islander population 15 years and over
Males 100.0% Never married0.0% Now married0.0% Separated0.0% Widowed0.0% DivorcedFemales 0.0% Never married100.0% Now married0.0% Separated0.0% Widowed0.0% DivorcedMarital status - Other race population 15 years and over
Males 0.0% Never married100.0% Now married0.0% Separated0.0% Widowed0.0% DivorcedFemales 36.2% Never married58.9% Now married0.0% Separated4.8% Widowed0.0% DivorcedWomen who gave birth in the past 12 months Now married:
100.0% (61)Unmarried:
0.0% (0)
Women who did not give birth in the past 12 months Now married:
39.8% (48)Unmarried:
60.2% (73)
Marital status - Two or more races population 15 years and over
Males 72.3% Never married18.1% Now married0.0% Separated0.8% Widowed8.7% DivorcedFemales 51.3% Never married35.3% Now married0.0% Separated6.8% Widowed6.5% DivorcedWomen who did not give birth in the past 12 months Now married:
31.2% (205)Unmarried:
68.8% (453)
Marital status - White alone, not Hispanic / Latino population 15 years and over
Males 22.7% Never married56.1% Now married1.0% Separated5.3% Widowed14.9% DivorcedFemales 16.4% Never married46.3% Now married1.1% Separated17.5% Widowed18.6% DivorcedWomen who gave birth in the past 12 months Now married:
100.0% (101)Unmarried:
0.0% (0)
Women who did not give birth in the past 12 months Now married:
47.1% (1,866)Unmarried:
52.9% (2,096)
Marital status - Hispanic or Latino population 15 years and over
Males 33.3% Never married54.8% Now married1.0% Separated1.4% Widowed9.6% DivorcedFemales 48.1% Never married40.3% Now married0.0% Separated2.7% Widowed8.8% DivorcedWomen who gave birth in the past 12 months Now married:
100.0% (10)Unmarried:
0.0% (0)
Women who did not give birth in the past 12 months Now married:
37.1% (256)Unmarried:
62.9% (435)
Ancestries in Dunedin
2,096 12.4% American1,934 11.4% German1,802 10.6% English1,676 9.9% Italian1,439 8.5% Irish547 3.2% European487 2.9% Portuguese423 2.5% Polish350 2.1% Scottish306 1.8% Scotch-Irish303 1.8% Swedish276 1.6% Greek252 1.5% French173 1.0% Slovak172 1.0% French Canadian171 1.0% British168 1.0% Lithuanian141 0.8% Belgian125 0.7% Russian109 0.6% Hungarian84 0.5% Canadian79 0.5% Dutch73 0.4% Albanian73 0.4% Belizean57 0.3% Armenian53 0.3% Norwegian53 0.3% Egyptian52 0.3% Swiss50 0.3% Welsh35 0.2% Lebanese33 0.2% Scandinavian25 0.1% Danish17 0.1% Finnish12 0.07% Serbian11 0.06% Macedonian10 0.06% Arab10 0.06% Yugoslavian8 0.05% Pennsylvania German4 0.02% Czech3 0.02% Czechoslovakian
Geographical mobility in Dunedin Same house 1 year ago 25,792 85.4% White (Caucasian)1,245 90.1% Black or African American47 100.0% American Indian / Alaska Native537 100.0% Asian36 100.0% Native Hawaiian / Pacific Islander393 93.1% Other race2,586 84.3% Two or more races26,019 86.3% White alone, not Hispanic / Latino1,817 78.7% Hispanic or LatinoMoved within same county 1,660 5.5% White / Caucasian72 5.2% Black or African American6 1.3% Other race44 1.4% Two or more races1,472 4.9% White alone, not Hispanic / Latino182 7.9% Hispanic or LatinoMoved within same state 696 2.3% White / Caucasian70 5.0% Black or African American205 6.7% Two or more races692 2.3% White alone, not Hispanic / Latino46 2.0% Hispanic or LatinoMoved from different state 1,800 6.0% White / Caucasian88 2.9% Two or more races1,777 5.9% White alone, not Hispanic / Latino32 1.4% Hispanic or LatinoMoved from abroad 480 1.6% White57 13.6% Other race332 10.8% Two or more races369 1.2% White alone, not Hispanic / Latino229 9.9% Hispanic or Latino
Children Nativity (place of birth) in Dunedin
Children under 6 years - Living with two parents Both parents native 689 100.0% NativeBoth parents foreign-born 58 53.7% Native50 46.3% Foreign-bornOne native, one foreign-born parent 114 100.0% NativeChildren under 6 years - Living with one parent Native parent 355 100.0% NativeForeign-born parent 44 100.0% NativeChildren 6 to 17 years - Living with two parents Both parents native 1,479 100.0% NativeBoth parents foreign-born 82 22.7% Native279 77.3% Foreign-bornOne native, one foreign-born parent 98 100.0% NativeChildren 6 to 17 years - Living with one parent Native parent 741 99.1% Native7 0.9% Foreign-bornForeign-born parent 51 68.2% Native24 31.8% Foreign-born
Grandparents responsible for own grandchildren in Dunedin
Grandparents (30 to 59 years) White / Caucasian 40 100.0% Not responsible for grandchildrenBlack or African American 31 100.0% Not responsible for grandchildrenWhite alone, not Hispanic / Latino 41 100.0% Not responsible for grandchildrenGrandparents (60 years and over) White / Caucasian 53 22.3% Responsible for grandchildren183 77.7% Not responsible for grandchildrenWhite alone, not Hispanic / Latino 51 22.1% Responsible for grandchildren178 77.9% Not responsible for grandchildren