Races in Draper, Utah (UT) Detailed Stats
Data:
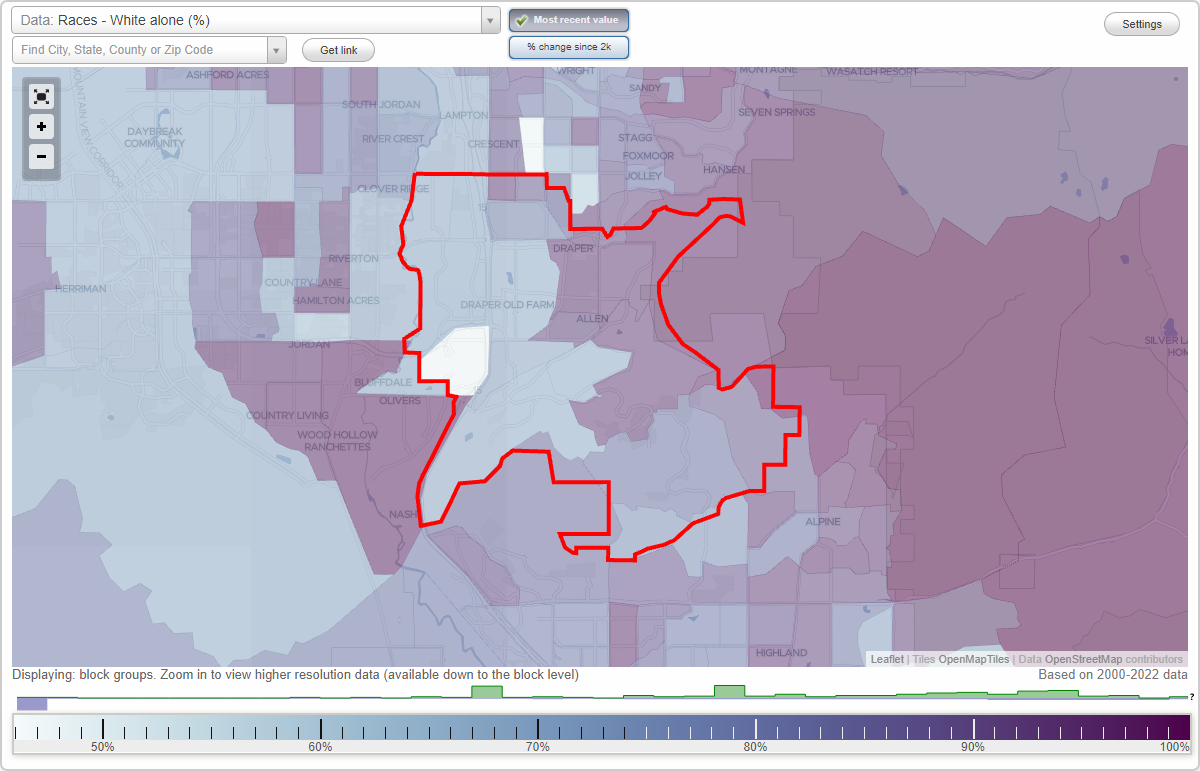
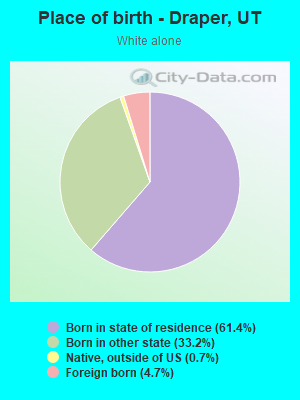
Races - White alone (%)
Races - White alone (% change since 2000)
Races - Black alone (%)
Races - Black alone (% change since 2000)
Races - American Indian alone (%)
Races - American Indian alone (% change since 2000)
Races - Asian alone (%)
Races - Asian alone (% change since 2000)
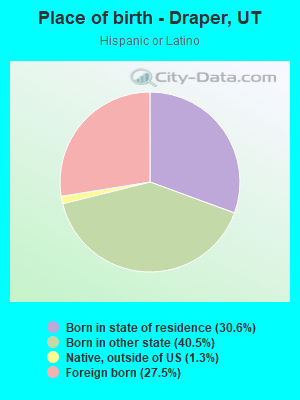
Races - Hispanic (%)
Races - Hispanic (% change since 2000)
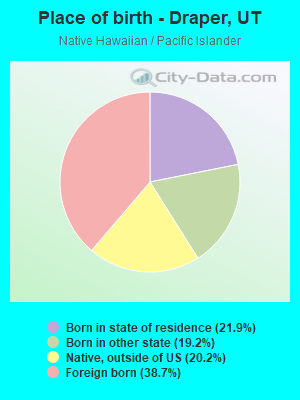
Races - Native Hawaiian and Other Pacific Islander alone (%)
Races - Native Hawaiian and Other Pacific Islander alone (% change since 2000)
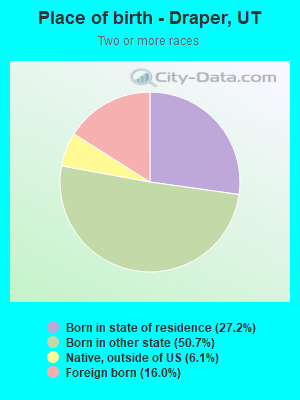
Races - Two or more races(%)
Races - Two or more races(% change since 2000)
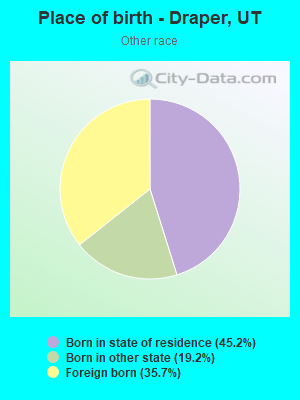
Races - Other race alone (%)
Races - Other race alone (% change since 2000)
Racial diversity
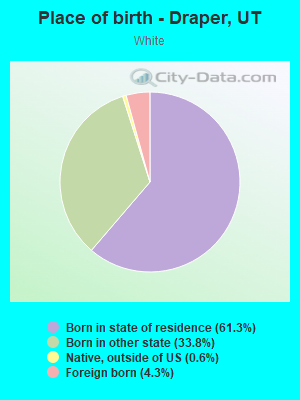
Place of birth - Born in state of residence (%)
Place of birth - Born in state of residence (%) - White
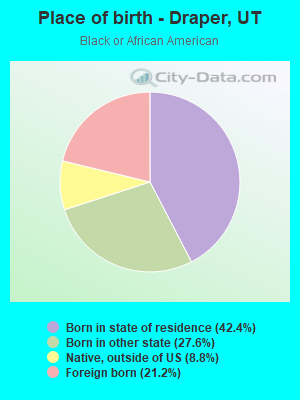
Place of birth - Born in state of residence (%) - Black or African American
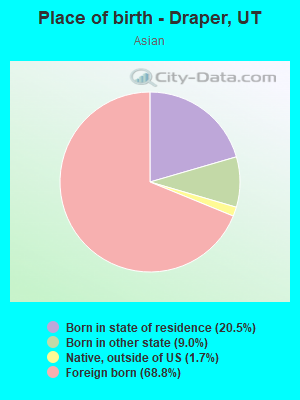
Place of birth - Born in state of residence (%) - Asian
Place of birth - Born in state of residence (%) - Hispanic or Latino
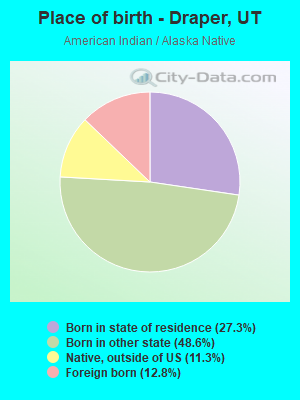
Place of birth - Born in state of residence (%) - American Indian and Alaska Native
Place of birth - Born in state of residence (%) - Multirace
Place of birth - Born in state of residence (%) - Other Race
Place of birth - Born in other state (%)
Place of birth - Born in other state (%) - White
Place of birth - Born in other state (%) - Black or African American
Place of birth - Born in other state (%) - Asian
Place of birth - Born in other state (%) - Hispanic or Latino
Place of birth - Born in other state (%) - American Indian and Alaska Native
Place of birth - Born in other state (%) - Multirace
Place of birth - Born in other state (%) - Other Race
Place of birth - Native, outside of US (%)
Place of birth - Native, outside of US (%) - White
Place of birth - Native, outside of US (%) - Black or African American
Place of birth - Native, outside of US (%) - Asian
Place of birth - Native, outside of US (%) - Hispanic or Latino
Place of birth - Native, outside of US (%) - American Indian and Alaska Native
Place of birth - Native, outside of US (%) - Multirace
Place of birth - Native, outside of US (%) - Other Race
Place of birth - Foreign born (%)
Place of birth - Foreign born (%) - White
Place of birth - Foreign born (%) - Black or African American
Place of birth - Foreign born (%) - Asian
Place of birth - Foreign born (%) - Hispanic or Latino
Place of birth - Foreign born (%) - American Indian and Alaska Native
Place of birth - Foreign born (%) - Multirace
Place of birth - Foreign born (%) - Other Race
Residents speaking English at home (%)
Residents speaking English at home - Born in the United States (%)
Residents speaking English at home - Native, born elsewhere (%)
Residents speaking English at home - Foreign born (%)
Residents speaking Spanish at home (%)
Residents speaking Spanish at home - Born in the United States (%)
Residents speaking Spanish at home - Native, born elsewhere (%)
Residents speaking Spanish at home - Foreign born (%)
Residents speaking other language at home (%)
Residents speaking other language at home - Born in the United States (%)
Residents speaking other language at home - Native, born elsewhere (%)
Residents speaking other language at home - Foreign born (%)
Marital status - Never married (%)
Marital status - Now married (%)
Marital status - Separated (%)
Marital status - Widowed (%)
Marital status - Divorced (%)
Ancestries Reported - Arab (%)
Ancestries Reported - Czech (%)
Ancestries Reported - Danish (%)
Ancestries Reported - Dutch (%)
Ancestries Reported - English (%)
Ancestries Reported - French (%)
Ancestries Reported - French Canadian (%)
Ancestries Reported - German (%)
Ancestries Reported - Greek (%)
Ancestries Reported - Hungarian (%)
Ancestries Reported - Irish (%)
Ancestries Reported - Italian (%)
Ancestries Reported - Lithuanian (%)
Ancestries Reported - Norwegian (%)
Ancestries Reported - Polish (%)
Ancestries Reported - Portuguese (%)
Ancestries Reported - Russian (%)
Ancestries Reported - Scotch-Irish (%)
Ancestries Reported - Scottish (%)
Ancestries Reported - Slovak (%)
Ancestries Reported - Subsaharan African (%)
Ancestries Reported - Swedish (%)
Ancestries Reported - Swiss (%)
Ancestries Reported - Ukrainian (%)
Ancestries Reported - United States (%)
Ancestries Reported - Welsh (%)
Ancestries Reported - West Indian (%)
Ancestries Reported - Other (%)
Geographical mobility - Same house 1 year ago (%)
Geographical mobility - Same house 1 year ago (%) - White
Geographical mobility - Same house 1 year ago (%) - Black or African American
Geographical mobility - Same house 1 year ago (%) - Asian
Geographical mobility - Same house 1 year ago (%) - Hispanic or Latino
Geographical mobility - Same house 1 year ago (%) - American Indian and Alaska Native
Geographical mobility - Same house 1 year ago (%) - Multirace
Geographical mobility - Same house 1 year ago (%) - Other Race
Geographical mobility - Moved within same county (%)
Geographical mobility - Moved within same county (%) - White
Geographical mobility - Moved within same county (%) - Black or African American
Geographical mobility - Moved within same county (%) - Asian
Geographical mobility - Moved within same county (%) - Hispanic or Latino
Geographical mobility - Moved within same county (%) - American Indian and Alaska Native
Geographical mobility - Moved within same county (%) - Multirace
Geographical mobility - Moved within same county (%) - Other Race
Geographical mobility - Moved from different county within same state (%)
Geographical mobility - Moved from different county within same state (%) - White
Geographical mobility - Moved from different county within same state (%) - Black or African American
Geographical mobility - Moved from different county within same state (%) - Asian
Geographical mobility - Moved from different county within same state (%) - Hispanic or Latino
Geographical mobility - Moved from different county within same state (%) - American Indian and Alaska Native
Geographical mobility - Moved from different county within same state (%) - Multirace
Geographical mobility - Moved from different county within same state (%) - Other Race
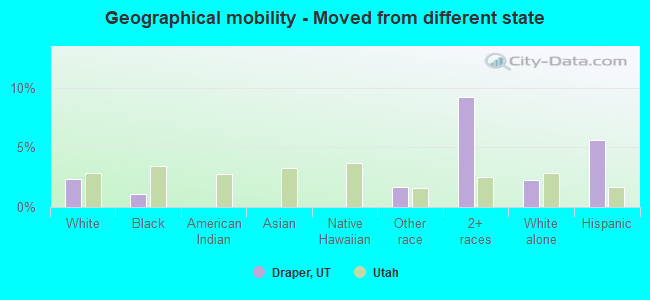
Geographical mobility - Moved from different state (%)
Geographical mobility - Moved from different state (%) - White
Geographical mobility - Moved from different state (%) - Black or African American
Geographical mobility - Moved from different state (%) - Asian
Geographical mobility - Moved from different state (%) - Hispanic or Latino
Geographical mobility - Moved from different state (%) - American Indian and Alaska Native
Geographical mobility - Moved from different state (%) - Multirace
Geographical mobility - Moved from different state (%) - Other Race
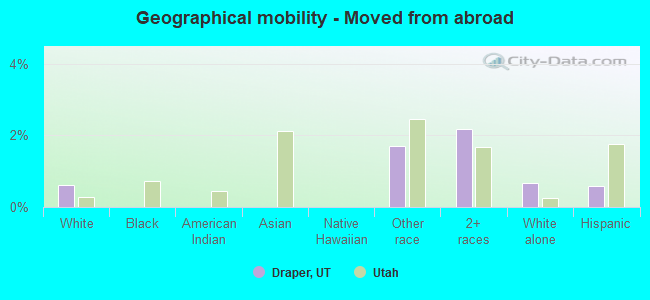
Geographical mobility - Moved from abroad (%)
Geographical mobility - Moved from abroad (%) - White
Geographical mobility - Moved from abroad (%) - Black or African American
Geographical mobility - Moved from abroad (%) - Asian
Geographical mobility - Moved from abroad (%) - Hispanic or Latino
Geographical mobility - Moved from abroad (%) - American Indian and Alaska Native
Geographical mobility - Moved from abroad (%) - Multirace
Geographical mobility - Moved from abroad (%) - Other Race
Place of birth for the foreign-born population - Ireland (%)
Place of birth for the foreign-born population - Denmark (%)
Place of birth for the foreign-born population - Norway (%)
Place of birth for the foreign-born population - Sweden (%)
Place of birth for the foreign-born population - United Kingdom (%)
Place of birth for the foreign-born population - England (%)
Place of birth for the foreign-born population - Scotland (%)
Place of birth for the foreign-born population - Other Northern Europe (%)
Place of birth for the foreign-born population - Austria (%)
Place of birth for the foreign-born population - Belgium (%)
Place of birth for the foreign-born population - France (%)
Place of birth for the foreign-born population - Germany (%)
Place of birth for the foreign-born population - Netherlands (%)
Place of birth for the foreign-born population - Switzerland (%)
Place of birth for the foreign-born population - Other Western Europe (%)
Place of birth for the foreign-born population - Greece (%)
Place of birth for the foreign-born population - Italy (%)
Place of birth for the foreign-born population - Portugal (%)
Place of birth for the foreign-born population - Spain (%)
Place of birth for the foreign-born population - Other Southern Europe (%)
Place of birth for the foreign-born population - Albania (%)
Place of birth for the foreign-born population - Belarus (%)
Place of birth for the foreign-born population - Bosnia and Herzegovina (%)
Place of birth for the foreign-born population - Bulgaria (%)
Place of birth for the foreign-born population - Croatia (%)
Place of birth for the foreign-born population - Czechoslovakia (%)
Place of birth for the foreign-born population - Hungary (%)
Place of birth for the foreign-born population - Latvia (%)
Place of birth for the foreign-born population - Lithuania (%)
Place of birth for the foreign-born population - North Macedonia (Macedonia) (%)
Place of birth for the foreign-born population - Moldova (%)
Place of birth for the foreign-born population - Poland (%)
Place of birth for the foreign-born population - Romania (%)
Place of birth for the foreign-born population - Russia (%)
Place of birth for the foreign-born population - Serbia (%)
Place of birth for the foreign-born population - Ukraine (%)
Place of birth for the foreign-born population - Other Eastern Europe (%)
Place of birth for the foreign-born population - China (%)
Place of birth for the foreign-born population - Hong Kong (%)
Place of birth for the foreign-born population - Taiwan (%)
Place of birth for the foreign-born population - Japan (%)
Place of birth for the foreign-born population - Korea (%)
Place of birth for the foreign-born population - Other Eastern Asia (%)
Place of birth for the foreign-born population - Afghanistan (%)
Place of birth for the foreign-born population - Bangladesh (%)
Place of birth for the foreign-born population - India (%)
Place of birth for the foreign-born population - Iran (%)
Place of birth for the foreign-born population - Kazakhstan (%)
Place of birth for the foreign-born population - Nepal (%)
Place of birth for the foreign-born population - Pakistan (%)
Place of birth for the foreign-born population - Sri Lanka (%)
Place of birth for the foreign-born population - Uzbekistan (%)
Place of birth for the foreign-born population - Other South Central Asia (%)
Place of birth for the foreign-born population - Burma (%)
Place of birth for the foreign-born population - Cambodia (%)
Place of birth for the foreign-born population - Indonesia (%)
Place of birth for the foreign-born population - Laos (%)
Place of birth for the foreign-born population - Malaysia (%)
Place of birth for the foreign-born population - Philippines (%)
Place of birth for the foreign-born population - Singapore (%)
Place of birth for the foreign-born population - Thailand (%)
Place of birth for the foreign-born population - Vietnam (%)
Place of birth for the foreign-born population - Other South Eastern Asia (%)
Place of birth for the foreign-born population - Armenia (%)
Place of birth for the foreign-born population - Iraq (%)
Place of birth for the foreign-born population - Israel (%)
Place of birth for the foreign-born population - Jordan (%)
Place of birth for the foreign-born population - Kuwait (%)
Place of birth for the foreign-born population - Lebanon (%)
Place of birth for the foreign-born population - Saudi Arabia (%)
Place of birth for the foreign-born population - Syria (%)
Place of birth for the foreign-born population - Turkey (%)
Place of birth for the foreign-born population - Yemen (%)
Place of birth for the foreign-born population - Other Western Asia (%)
Place of birth for the foreign-born population - Eritrea (%)
Place of birth for the foreign-born population - Ethiopia (%)
Place of birth for the foreign-born population - Kenya (%)
Place of birth for the foreign-born population - Somalia (%)
Place of birth for the foreign-born population - Uganda (%)
Place of birth for the foreign-born population - Zimbabwe (%)
Place of birth for the foreign-born population - Other Eastern Africa (%)
Place of birth for the foreign-born population - Cameroon (%)
Place of birth for the foreign-born population - Congo (%)
Place of birth for the foreign-born population - Democratic Republic of Congo (Zaire) (%)
Place of birth for the foreign-born population - Other Middle Africa (%)
Place of birth for the foreign-born population - Egypt (%)
Place of birth for the foreign-born population - Morocco (%)
Place of birth for the foreign-born population - Sudan (%)
Place of birth for the foreign-born population - Other Northern Africa (%)
Place of birth for the foreign-born population - South Africa (%)
Place of birth for the foreign-born population - Other Southern Africa (%)
Place of birth for the foreign-born population - Cabo Verde (%)
Place of birth for the foreign-born population - Ghana (%)
Place of birth for the foreign-born population - Liberia (%)
Place of birth for the foreign-born population - Nigeria (%)
Place of birth for the foreign-born population - Senegal (%)
Place of birth for the foreign-born population - Sierra Leone (%)
Place of birth for the foreign-born population - Other Western Africa (%)
Place of birth for the foreign-born population - Australia (%)
Place of birth for the foreign-born population - New Zealand (%)
Place of birth for the foreign-born population - Fiji (%)
Place of birth for the foreign-born population - Micronesia (%)
Place of birth for the foreign-born population - Bahamas (%)
Place of birth for the foreign-born population - Barbados (%)
Place of birth for the foreign-born population - Cuba (%)
Place of birth for the foreign-born population - Dominica (%)
Place of birth for the foreign-born population - Dominican Republic (%)
Place of birth for the foreign-born population - Grenada (%)
Place of birth for the foreign-born population - Haiti (%)
Place of birth for the foreign-born population - Jamaica (%)
Place of birth for the foreign-born population - St. Vincent and the Grenadines (%)
Place of birth for the foreign-born population - Trinidad and Tobago (%)
Place of birth for the foreign-born population - West Indies (%)
Place of birth for the foreign-born population - Other Caribbean (%)
Place of birth for the foreign-born population - Belize (%)
Place of birth for the foreign-born population - Costa Rica (%)
Place of birth for the foreign-born population - El Salvador (%)
Place of birth for the foreign-born population - Guatemala (%)
Place of birth for the foreign-born population - Honduras (%)
Place of birth for the foreign-born population - Mexico (%)
Place of birth for the foreign-born population - Nicaragua (%)
Place of birth for the foreign-born population - Panama (%)
Place of birth for the foreign-born population - Other Central America (%)
Place of birth for the foreign-born population - Argentina (%)
Place of birth for the foreign-born population - Bolivia (%)
Place of birth for the foreign-born population - Brazil (%)
Place of birth for the foreign-born population - Chile (%)
Place of birth for the foreign-born population - Colombia (%)
Place of birth for the foreign-born population - Ecuador (%)
Place of birth for the foreign-born population - Guyana (%)
Place of birth for the foreign-born population - Peru (%)
Place of birth for the foreign-born population - Uruguay (%)
Place of birth for the foreign-born population - Venezuela (%)
Place of birth for the foreign-born population - Other South America (%)
Place of birth for the foreign-born population - Canada (%)
Place of birth for the foreign-born population - Other Northern America (%)
Place of birth for the foreign-born population - Other (%)
Latest news about races in Draper, UT collected exclusively by city-data.com from local newspapers, TV, and radio stations
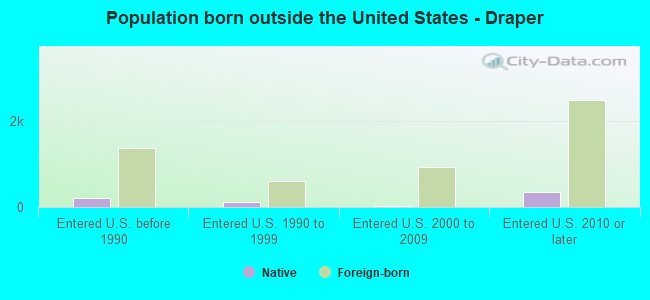
According to 2022 data, the most numerous races in Draper, UT are White alone (40,545 residents), Hispanic (3,768 residents), and Two or more races (2,170 residents). 84.9% of Draper residents speak English at home. 10.6% of Draper, UT residents are foreign-born (3.0% born in Latin America, 3.0% born in Asia, 2.2% born in Europe), which is 24.3% greater than the foreign-born rate of 8.0% across the entire state of Utah.
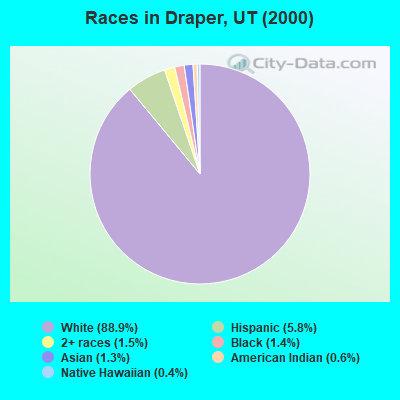
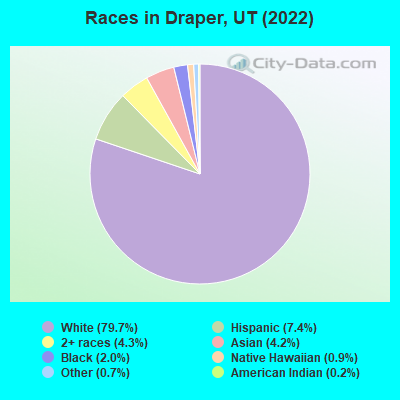
Race distribution in Draper
2000 2022
1,904,265 85.3% White alone 201,559 9.0% Hispanic 36,483 1.6% Asian alone 31,308 1.4% Two or more races 26,663 1.2% American Indian alone 14,806 0.7% Native Hawaiian and Other 16,137 0.7% Black alone 1,948 0.09% Other race alone
2,557,466 75.6% White alone 512,086 15.1% Hispanic 119,308 3.5% Two or more races 82,388 2.4% Asian alone 36,978 1.1% Native Hawaiian and Other 34,873 1.0% Black alone 22,803 0.7% American Indian alone 14,898 0.4% Other race alone
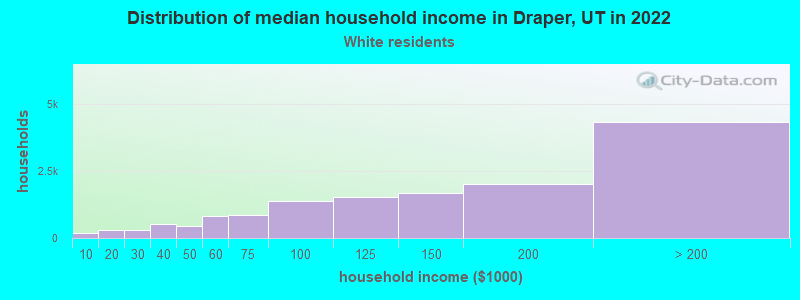
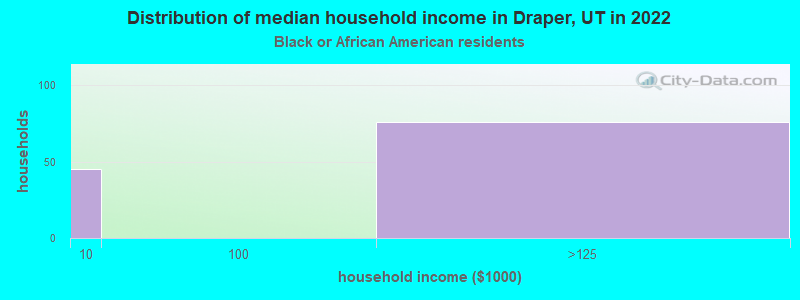
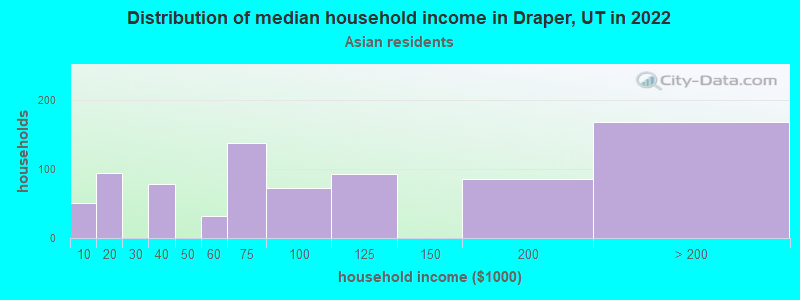
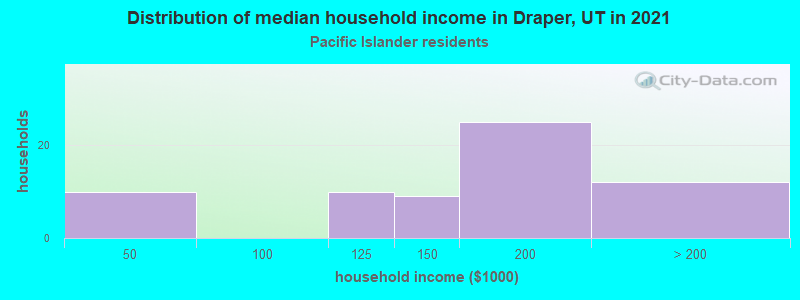
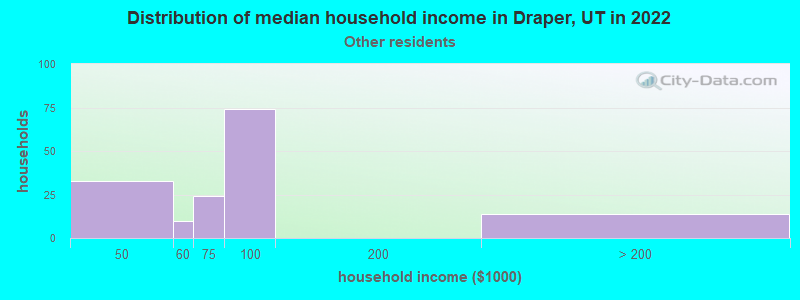
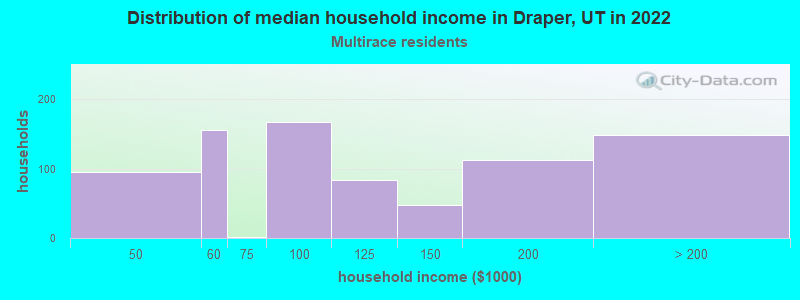
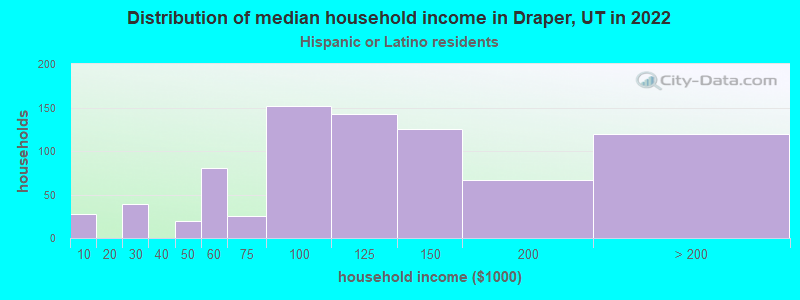
Income and house value in Draper Median household income in 2022 $135,024 White non-Hispanic householders$93,759 Asian householders$78,603 Some other race householders$87,460 Two or more races householders$120,222 Hispanic or Latino race householdersMedian 2022 house value $810,781 White Non-Hispanic householders$616,020 Black or African American householders $644,081 Asian householders$707,220 Native Hawaiian and other Pacific Islander householders$565,909 Some other race householders$910,333 Two or more races householders$883,942 Hispanic or Latino householders
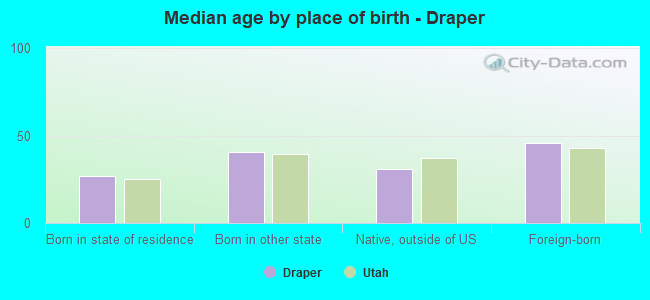
Median age by race in Draper
36.1 Median age for White residents35.1 37.4 21.4 Median age for Black or African American residents24.8 18.9 43.8 Median age for American Indian / Alaska Native residents44.5 -660,587,638.7 35.7 Median age for Asian residents32.4 38.6 39.1 Median age for Native Hawaiian / Pacific Islander residents30.4 56.2 34.0 Median age for Other race residents38.0 24.6 22.1 Median age for Two or more races residents21.3 24.4 36.6 Median age for White alone residents35.6 37.4 31.3 Median age for Hispanic or Latino residents31.2 32.3
Owner/renter occupied households by race in Draper
House owners and renters - White residents 10,868 76.4% Owner occupied3,348 23.6% Renter occupiedHouse owners and renters - Black or African American residents 138 90.9% Owner occupied14 9.1% Renter occupiedHouse owners and renters - American Indian / Alaska Native residents 13 100.0% Owner occupiedHouse owners and renters - Asian residents 461 59.1% Owner occupied319 40.9% Renter occupiedHouse owners and renters - Native Hawaiian / Pacific Islander residents 57 30.4% Owner occupied132 69.6% Renter occupiedHouse owners and renters - Other race residents 57 34.1% Owner occupied110 65.9% Renter occupiedHouse owners and renters - Two or more races residents 277 34.5% Owner occupied526 65.5% Renter occupiedHouse owners and renters - White alone residents 10,613 76.0% Owner occupied3,353 24.0% Renter occupiedHouse owners and renters - Hispanic or Latino residents 566 73.5% Owner occupied204 26.5% Renter occupied
Language usage in Draper
English speakers - Total 84.9% of residents of Draper speak English at home.
4.6% of residents speak Spanish at home 1,802 82.5% Speak English very well383 17.5% Speak English less than very well10.3% of residents speak other language at home 4,017 82.0% Speak English very well881 18.0% Speak English less than very well
English speakers - Born in the United States 92.8% of residents of Draper speak English at home.
4.3% of residents speak Spanish at home 671 94.6% Speak English very well38 5.4% Speak English less than very well2.6% of residents speak other language at home 346 81.2% Speak English very well80 18.8% Speak English less than very well
English speakers - Native, born elsewhere 59.2% of residents of Draper speak English at home.
4.2% of residents speak Spanish at home 25 83.3% Speak English very well5 16.7% Speak English less than very well42.9% of residents speak other language at home 304 100.0% Speak English very well
English speakers - Foreign-born 22.3% of residents of Draper speak English at home.
15.4% of residents speak Spanish at home 528 64.6% Speak English very well289 35.4% Speak English less than very well61.0% of residents speak other language at home 2,476 76.3% Speak English very well768 23.7% Speak English less than very well
White (Caucasian) - Speak only English Native:
95.8% (35,159)Foreign-born:
42.2% (733)
White (Caucasian) - Speak another language Native:
4.2% (1,538)Foreign-born:
59.9% (1,039)
Black or African American - Speak only English Native:
84.4% (541)Foreign-born:
2.7% (6)
Black or African American - Speak another language Native:
1.1% (7)Foreign-born:
90.9% (189)
American Indian / Alaska Native - Speak another language Native:
72.5% (125)Foreign-born:
94.0% (25)
Asian - Speak only English Native:
72.6% (389)Foreign-born:
10.8% (166)
Asian - Speak another language Native:
22.1% (118)Foreign-born:
88.6% (1,356)
Native Hawaiian / Pacific Islander - Speak another language Native:
67.4% (176)Foreign-born:
100.0% (181)
Other race - Speak only English Native:
58.9% (499)Foreign-born:
23.8% (125)
Other race - Speak another language Native:
34.0% (287)Foreign-born:
82.9% (435)
Two or more races - Speak only English Native:
85.2% (2,354)Foreign-born:
12.1% (78)
Two or more races - Speak another language Native:
14.7% (407)Foreign-born:
85.4% (550)
White alone - Speak only English Native:
95.7% (34,797)Foreign-born:
39.0% (751)
White alone - Speak another language Native:
4.3% (1,568)Foreign-born:
60.9% (1,172)
Hispanic or Latino - Speak only English Native:
73.2% (1,757)Foreign-born:
13.6% (141)
Hispanic or Latino - Speak another language Native:
28.2% (678)Foreign-born:
87.7% (908)
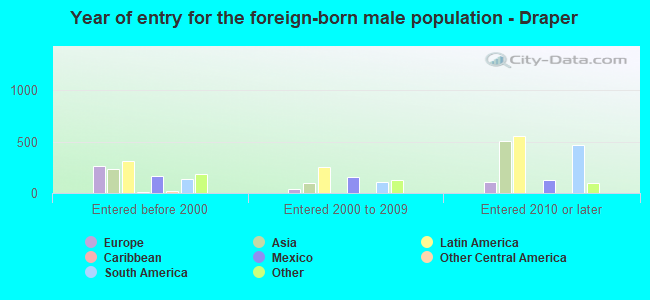
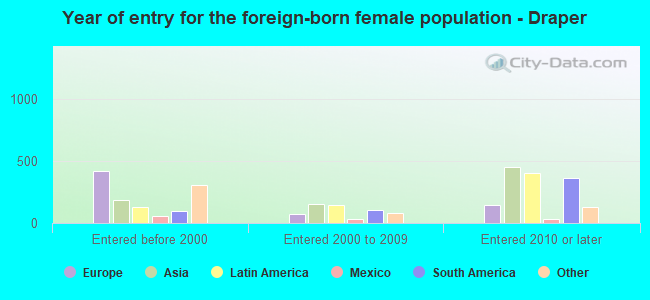
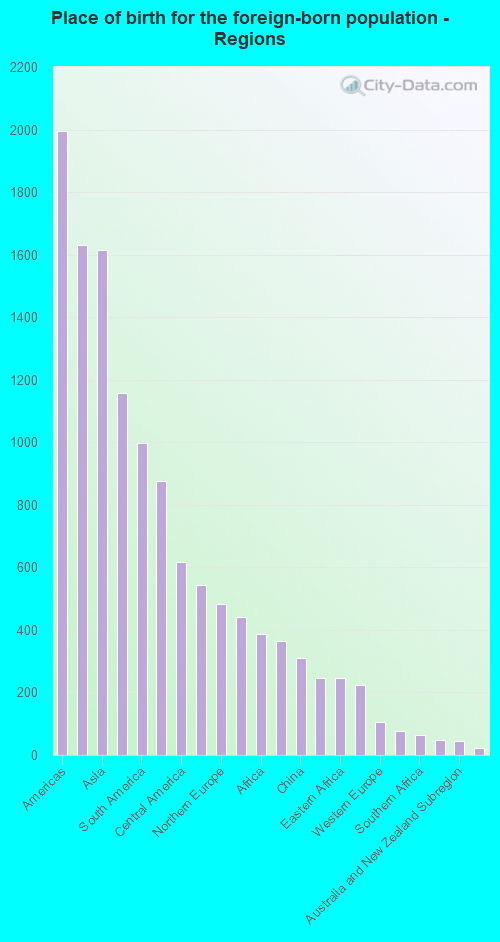
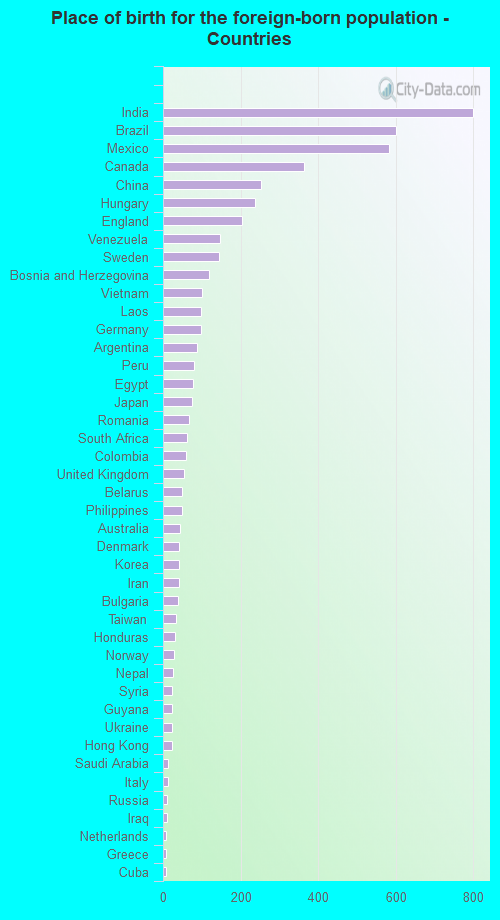
Foreign-born residents in Draper 5,380 residents are foreign born (3.0% Latin America , 3.0% Asia , 2.2% Europe ).
Marital status for residents in Draper Marital status - White (Caucasian) population 15 years and over
Males 32.0% Never married59.6% Now married0.8% Separated0.8% Widowed6.8% DivorcedFemales 24.7% Never married61.8% Now married0.7% Separated4.2% Widowed8.7% DivorcedWomen who gave birth in the past 12 months Now married:
97.9% (413)Unmarried:
2.1% (9)
Women who did not give birth in the past 12 months Now married:
56.0% (5,528)Unmarried:
44.0% (4,341)
Marital status - Black or African American population 15 years and over
Males 21.1% Never married67.1% Now married10.6% Separated0.0% Widowed1.2% DivorcedFemales 26.5% Never married68.7% Now married0.0% Separated0.0% Widowed4.8% DivorcedWomen who did not give birth in the past 12 months Now married:
63.8% (154)Unmarried:
36.2% (87)
Marital status - American Indian / Alaska Native population 15 years and over
Males 29.3% Never married48.7% Now married22.0% Separated0.0% Widowed0.0% DivorcedFemales 17.6% Never married82.4% Now married0.0% Separated0.0% Widowed0.0% DivorcedWomen who did not give birth in the past 12 months Now married:
0.0% (0)Unmarried:
100.0% (4)
Marital status - Asian population 15 years and over
Males 37.8% Never married56.3% Now married0.0% Separated1.9% Widowed4.1% DivorcedFemales 17.3% Never married67.6% Now married0.0% Separated8.8% Widowed6.3% DivorcedWomen who gave birth in the past 12 months Now married:
100.0% (13)Unmarried:
0.0% (0)
Women who did not give birth in the past 12 months Now married:
67.3% (396)Unmarried:
32.7% (192)
Marital status - Native Hawaiian / Pacific Islander population 15 years and over
Males 39.7% Never married47.5% Now married0.0% Separated0.0% Widowed12.8% DivorcedFemales 17.0% Never married44.8% Now married0.0% Separated31.3% Widowed7.0% DivorcedWomen who did not give birth in the past 12 months Now married:
63.2% (77)Unmarried:
36.8% (45)
Marital status - Other race population 15 years and over
Males 44.6% Never married38.6% Now married4.8% Separated0.0% Widowed12.0% DivorcedFemales 16.2% Never married66.1% Now married0.0% Separated5.5% Widowed12.3% DivorcedWomen who gave birth in the past 12 months Now married:
100.0% (14)Unmarried:
0.0% (0)
Women who did not give birth in the past 12 months Now married:
62.7% (167)Unmarried:
37.3% (100)
Marital status - Two or more races population 15 years and over
Males 60.9% Never married30.4% Now married1.6% Separated0.0% Widowed7.0% DivorcedFemales 44.2% Never married46.5% Now married0.3% Separated0.4% Widowed8.5% DivorcedWomen who gave birth in the past 12 months Now married:
100.0% (147)Unmarried:
0.0% (0)
Women who did not give birth in the past 12 months Now married:
25.1% (201)Unmarried:
74.9% (599)
Marital status - White alone, not Hispanic / Latino population 15 years and over
Males 31.3% Never married60.1% Now married0.9% Separated0.8% Widowed7.0% DivorcedFemales 24.9% Never married61.9% Now married0.7% Separated4.1% Widowed8.4% DivorcedWomen who gave birth in the past 12 months Now married:
97.8% (398)Unmarried:
2.2% (9)
Women who did not give birth in the past 12 months Now married:
56.0% (5,511)Unmarried:
44.0% (4,326)
Marital status - Hispanic or Latino population 15 years and over
Males 45.0% Never married42.7% Now married4.5% Separated0.4% Widowed7.4% DivorcedFemales 24.8% Never married56.5% Now married0.0% Separated4.8% Widowed13.8% DivorcedWomen who gave birth in the past 12 months Now married:
100.0% (27)Unmarried:
0.0% (0)
Women who did not give birth in the past 12 months Now married:
48.0% (259)Unmarried:
52.0% (281)
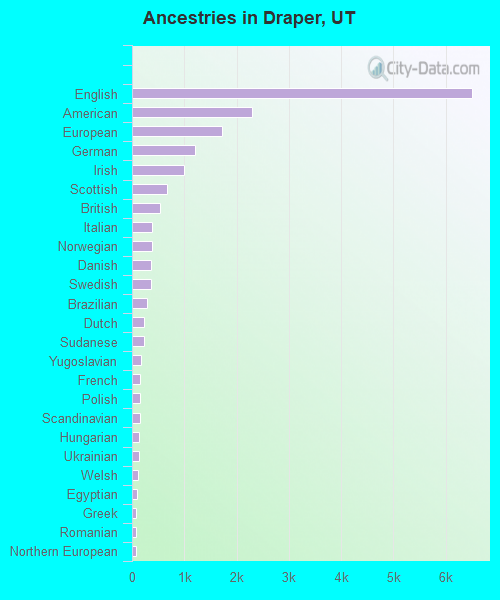
Ancestries in Draper
6,505 25.9% English2,289 9.1% American1,724 6.9% European1,204 4.8% German1,002 4.0% Irish666 2.7% Scottish544 2.2% British378 1.5% Italian377 1.5% Norwegian369 1.5% Danish362 1.4% Swedish288 1.1% Brazilian235 0.9% Dutch228 0.9% Sudanese164 0.7% Yugoslavian162 0.6% French151 0.6% Polish146 0.6% Scandinavian143 0.6% Hungarian130 0.5% Ukrainian115 0.5% Welsh101 0.4% Egyptian86 0.3% Greek85 0.3% Romanian80 0.3% Northern European71 0.3% Palestinian57 0.2% Croatian52 0.2% Somali43 0.2% Canadian42 0.2% Scotch-Irish42 0.2% Haitian41 0.2% West Indian36 0.1% Iranian35 0.1% Finnish34 0.1% Basque33 0.1% Portuguese32 0.1% Russian27 0.1% Guyanese26 0.1% Armenian25 0.10% Swiss23 0.09% Austrian21 0.08% Slovak21 0.08% Lebanese19 0.08% Bulgarian8 0.03% South African4 0.02% Eastern European4 0.02% Iraqi2 0.01% African
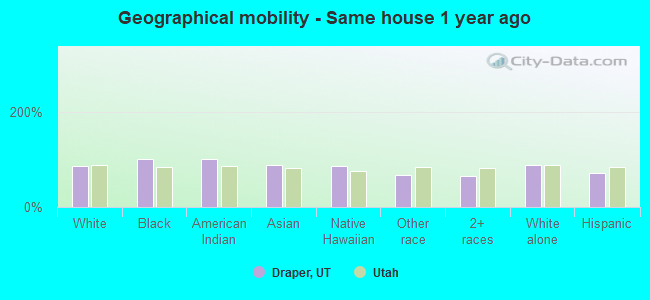
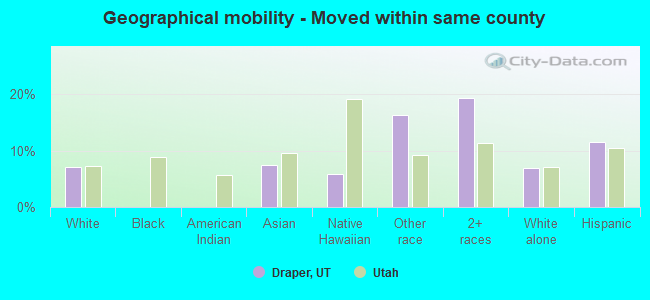
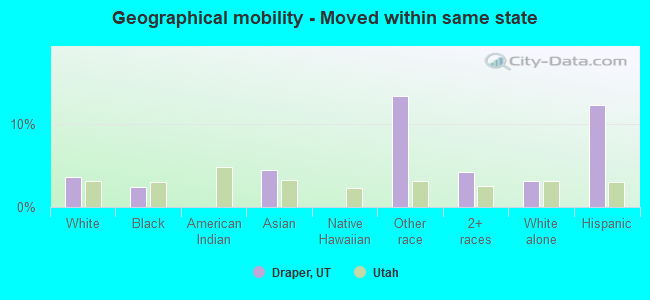
Geographical mobility in Draper Same house 1 year ago 34,695 86.3% White (Caucasian)1,068 100.0% Black or African American176 100.0% American Indian / Alaska Native1,959 89.3% Asian368 85.0% Native Hawaiian / Pacific Islander988 67.6% Other race2,479 65.8% Two or more races34,860 87.1% White alone, not Hispanic / Latino2,662 72.2% Hispanic or LatinoMoved within same county 2,870 7.1% White / Caucasian164 7.5% Asian25 5.9% Native Hawaiian / Pacific Islander239 16.3% Other race728 19.3% Two or more races2,740 6.8% White alone, not Hispanic / Latino422 11.4% Hispanic or LatinoMoved within same state 1,475 3.7% White / Caucasian25 2.4% Black or African American98 4.5% Asian197 13.5% Other race160 4.2% Two or more races1,254 3.1% White alone, not Hispanic / Latino455 12.3% Hispanic or LatinoMoved from different state 954 2.4% White / Caucasian11 1.1% Black or African American25 1.7% Other race349 9.3% Two or more races905 2.3% White alone, not Hispanic / Latino208 5.6% Hispanic or LatinoMoved from abroad 242 0.6% White25 1.7% Other race82 2.2% Two or more races265 0.7% White alone, not Hispanic / Latino22 0.6% Hispanic or Latino
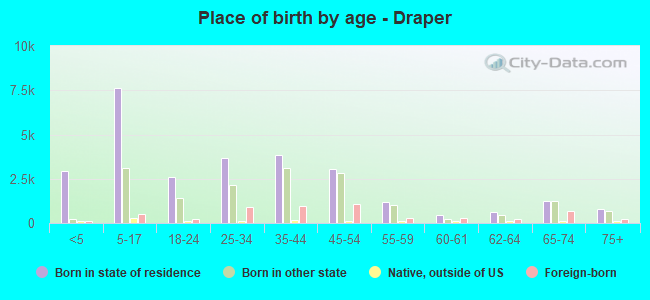
Children Nativity (place of birth) in Draper
Children under 6 years - Living with two parents Both parents native 2,455 100.0% NativeBoth parents foreign-born 314 100.0% NativeOne native, one foreign-born parent 300 100.0% NativeChildren under 6 years - Living with one parent Native parent 425 100.0% NativeForeign-born parent 5 100.0% NativeChildren 6 to 17 years - Living with two parents Both parents native 7,622 100.0% NativeBoth parents foreign-born 492 53.8% Native423 46.2% Foreign-bornOne native, one foreign-born parent 927 98.7% Native12 1.3% Foreign-bornChildren 6 to 17 years - Living with one parent Native parent 1,057 100.0% NativeForeign-born parent 223 57.5% Native165 42.5% Foreign-born
Grandparents responsible for own grandchildren in Draper
Grandparents (30 to 59 years) White / Caucasian 37 18.7% Responsible for grandchildren162 81.3% Not responsible for grandchildrenAsian 34 100.0% Not responsible for grandchildrenNative Hawaiian / Pacific Islander 22 100.0% Not responsible for grandchildrenWhite alone, not Hispanic / Latino 45 20.4% Responsible for grandchildren176 79.6% Not responsible for grandchildrenGrandparents (60 years and over) White / Caucasian 19 6.6% Responsible for grandchildren262 93.4% Not responsible for grandchildrenAsian 45 100.0% Not responsible for grandchildrenNative Hawaiian / Pacific Islander 17 100.0% Not responsible for grandchildrenWhite alone, not Hispanic / Latino 19 7.7% Responsible for grandchildren224 92.3% Not responsible for grandchildren