Races in Doyle, Texas (TX) Detailed Stats
Ancestries, Foreign-born residents, place of birth

Recent posts about races in Doyle, Texas on our local forum with over 2,400,000 registered users:
 | Houston McMansion (98 replies) |
| Overpriced Homes in Cedar Park and Leander (145 replies) |
| Dallas Restaurant News (12 replies) |
| Rain and Power (23 replies) |
| Commute time to Mopac from SH45@620 vs 183@McNeil (14 replies) |
| To have MLB in San Antonio or not to have MLB in San Antonio? That is the question! (105 replies) |
Latest news about races in Doyle, TX collected exclusively by city-data.com from local newspapers, TV, and radio stations
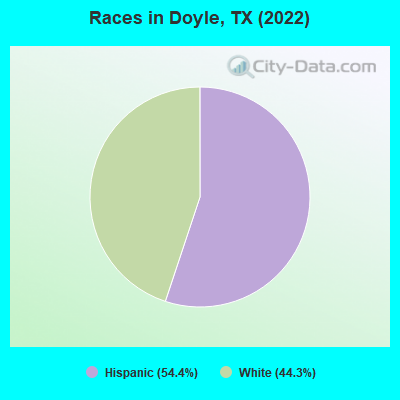
According to 2022 data, the most numerous races in Doyle, TX are Hispanic (308 residents), White alone (251 residents), and Black alone (0 residents). 52.4% of Doyle residents speak English at home.
Race distribution in Doyle

2000
2022

- 10,933,31352.4%White alone
- 6,669,66632.0%Hispanic
- 2,364,25511.3%Black alone
- 554,4452.7%Asian alone
- 230,5671.1%Two or more races
- 68,8590.3%American Indian alone
- 19,9580.10%Other race alone
- 10,7570.05%Native Hawaiian and Other
Pacific Islander alone

-
- 12,070,64240.2%Hispanic
- 11,683,43038.9%White alone
- 3,508,70611.7%Black alone
- 1,608,1735.4%Asian alone
- 956,5603.2%Two or more races
- 125,7630.4%Other race alone
- 47,0230.2%American Indian alone
- 29,2750.10%Native Hawaiian and Other
Pacific Islander alone

Income and house value in Doyle
- Median household income in 2022
- $136,529White non-Hispanic householders
- $55,705Some other race householders
- $63,494Hispanic or Latino race householders
- Median 2022 house value
- $189,061White Non-Hispanic householders
- $130,889Hispanic or Latino householders
Household income for White non-Hispanic householders

Household income for Hispanic or Latino race householders

Median age by race in Doyle
- 37.5Median age for White residents
- 54.2Males
- 36.5Females
- 51.5Median age for White alone residents
- 51.8Males
- 25.4Females
- 38.3Median age for Hispanic or Latino residents
Owner/renter occupied households by race in Doyle
- House owners and renters - White residents
- 2018.9%Owner occupied
- 8581.1%Renter occupied
- House owners and renters - White alone residents
- 2251.0%Owner occupied
- 2149.0%Renter occupied
- House owners and renters - Hispanic or Latino residents
- 94100.0%Renter occupied
Language usage in Doyle
- English speakers - Total
- 52.4% of residents of Doyle speak English at home.
- 49.5% of residents speak Spanish at home
- 283100.0%Speak English very well
- English speakers - Born in the United States
- 24.3% of residents of Doyle speak English at home.
- 74.8% of residents speak Spanish at home
- 77100.0%Speak English very well
Foreign-born residents in Doyle


Marital status for residents in Doyle
Marital status - White (Caucasian) population 15 years and over
- Males
- 0.0%Never married
- 79.9%Now married
- 0.0%Separated
- 0.0%Widowed
- 20.1%Divorced
- Females
- 66.4%Never married
- 30.6%Now married
- 0.0%Separated
- 0.0%Widowed
- 3.0%Divorced
Women who did not give birth in the past 12 months
| Now married: | 8.4% (19) |
| Unmarried: | 91.6% (208) |
Marital status - White alone, not Hispanic / Latino population 15 years and over
- Males
- 0.0%Never married
- 79.9%Now married
- 0.0%Separated
- 0.0%Widowed
- 20.1%Divorced
- Females
- 56.7%Never married
- 43.3%Now married
- 0.0%Separated
- 0.0%Widowed
- 0.0%Divorced
Women who did not give birth in the past 12 months
| Now married: | 28.0% (21) |
| Unmarried: | 72.0% (54) |
Geographical mobility in Doyle

- Same house 1 year ago
- 456100.0%White (Caucasian)
- 256100.0%White alone, not Hispanic / Latino
- 322100.0%Hispanic or Latino

Children Nativity (place of birth) in Doyle
Zip codes: 78374.