Races in Donna, Texas (TX) Detailed Stats
Data:
Races - White alone (%)
Races - White alone (% change since 2000)
Races - Black alone (%)
Races - Black alone (% change since 2000)
Races - American Indian alone (%)
Races - American Indian alone (% change since 2000)
Races - Asian alone (%)
Races - Asian alone (% change since 2000)
Races - Hispanic (%)
Races - Hispanic (% change since 2000)
Races - Native Hawaiian and Other Pacific Islander alone (%)
Races - Native Hawaiian and Other Pacific Islander alone (% change since 2000)
Races - Two or more races(%)
Races - Two or more races(% change since 2000)
Races - Other race alone (%)
Races - Other race alone (% change since 2000)
Racial diversity
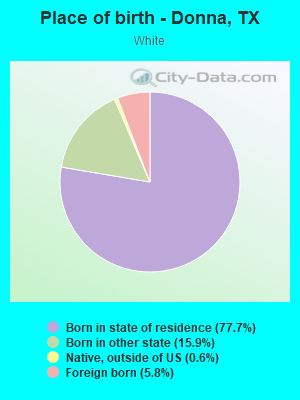
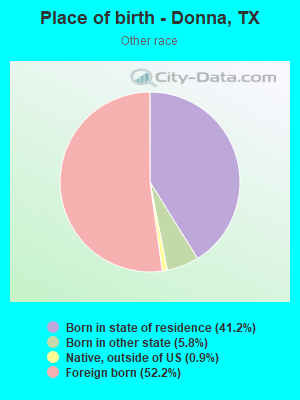
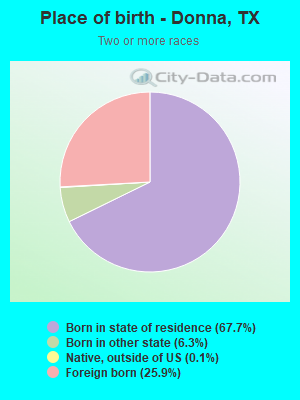
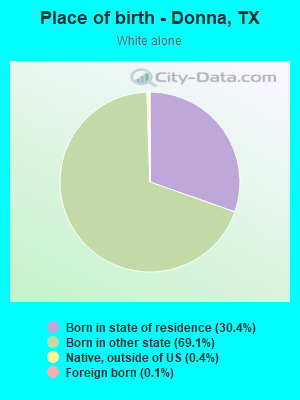
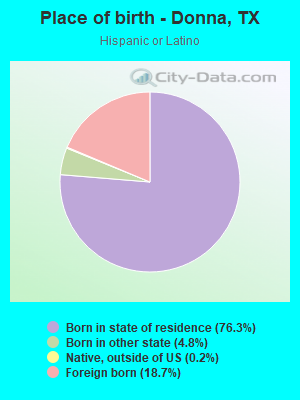
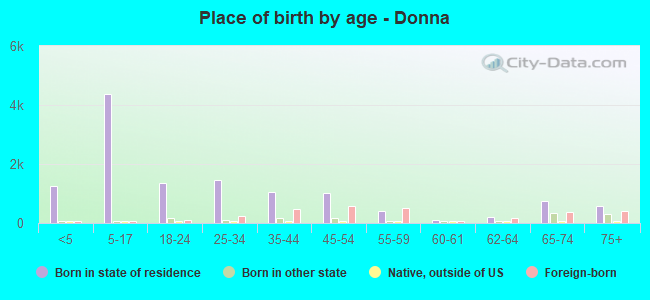
Place of birth - Born in state of residence (%)
Place of birth - Born in state of residence (%) - White
Place of birth - Born in state of residence (%) - Black or African American
Place of birth - Born in state of residence (%) - Asian
Place of birth - Born in state of residence (%) - Hispanic or Latino
Place of birth - Born in state of residence (%) - American Indian and Alaska Native
Place of birth - Born in state of residence (%) - Multirace
Place of birth - Born in state of residence (%) - Other Race
Place of birth - Born in other state (%)
Place of birth - Born in other state (%) - White
Place of birth - Born in other state (%) - Black or African American
Place of birth - Born in other state (%) - Asian
Place of birth - Born in other state (%) - Hispanic or Latino
Place of birth - Born in other state (%) - American Indian and Alaska Native
Place of birth - Born in other state (%) - Multirace
Place of birth - Born in other state (%) - Other Race
Place of birth - Native, outside of US (%)
Place of birth - Native, outside of US (%) - White
Place of birth - Native, outside of US (%) - Black or African American
Place of birth - Native, outside of US (%) - Asian
Place of birth - Native, outside of US (%) - Hispanic or Latino
Place of birth - Native, outside of US (%) - American Indian and Alaska Native
Place of birth - Native, outside of US (%) - Multirace
Place of birth - Native, outside of US (%) - Other Race
Place of birth - Foreign born (%)
Place of birth - Foreign born (%) - White
Place of birth - Foreign born (%) - Black or African American
Place of birth - Foreign born (%) - Asian
Place of birth - Foreign born (%) - Hispanic or Latino
Place of birth - Foreign born (%) - American Indian and Alaska Native
Place of birth - Foreign born (%) - Multirace
Place of birth - Foreign born (%) - Other Race
Residents speaking English at home (%)
Residents speaking English at home - Born in the United States (%)
Residents speaking English at home - Native, born elsewhere (%)
Residents speaking English at home - Foreign born (%)
Residents speaking Spanish at home (%)
Residents speaking Spanish at home - Born in the United States (%)
Residents speaking Spanish at home - Native, born elsewhere (%)
Residents speaking Spanish at home - Foreign born (%)
Residents speaking other language at home (%)
Residents speaking other language at home - Born in the United States (%)
Residents speaking other language at home - Native, born elsewhere (%)
Residents speaking other language at home - Foreign born (%)
Marital status - Never married (%)
Marital status - Now married (%)
Marital status - Separated (%)
Marital status - Widowed (%)
Marital status - Divorced (%)
Ancestries Reported - Arab (%)
Ancestries Reported - Czech (%)
Ancestries Reported - Danish (%)
Ancestries Reported - Dutch (%)
Ancestries Reported - English (%)
Ancestries Reported - French (%)
Ancestries Reported - French Canadian (%)
Ancestries Reported - German (%)
Ancestries Reported - Greek (%)
Ancestries Reported - Hungarian (%)
Ancestries Reported - Irish (%)
Ancestries Reported - Italian (%)
Ancestries Reported - Lithuanian (%)
Ancestries Reported - Norwegian (%)
Ancestries Reported - Polish (%)
Ancestries Reported - Portuguese (%)
Ancestries Reported - Russian (%)
Ancestries Reported - Scotch-Irish (%)
Ancestries Reported - Scottish (%)
Ancestries Reported - Slovak (%)
Ancestries Reported - Subsaharan African (%)
Ancestries Reported - Swedish (%)
Ancestries Reported - Swiss (%)
Ancestries Reported - Ukrainian (%)
Ancestries Reported - United States (%)
Ancestries Reported - Welsh (%)
Ancestries Reported - West Indian (%)
Ancestries Reported - Other (%)
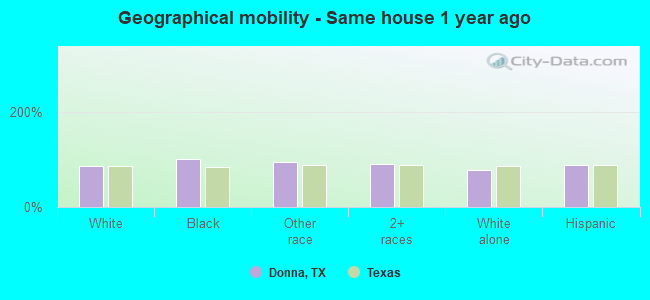
Geographical mobility - Same house 1 year ago (%)
Geographical mobility - Same house 1 year ago (%) - White
Geographical mobility - Same house 1 year ago (%) - Black or African American
Geographical mobility - Same house 1 year ago (%) - Asian
Geographical mobility - Same house 1 year ago (%) - Hispanic or Latino
Geographical mobility - Same house 1 year ago (%) - American Indian and Alaska Native
Geographical mobility - Same house 1 year ago (%) - Multirace
Geographical mobility - Same house 1 year ago (%) - Other Race
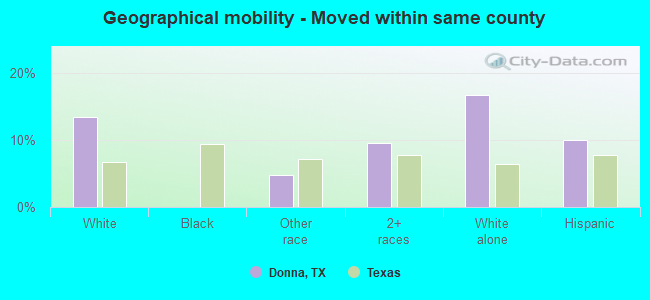
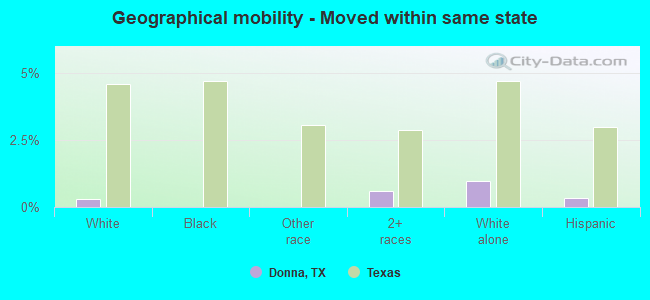
Geographical mobility - Moved within same county (%)
Geographical mobility - Moved within same county (%) - White
Geographical mobility - Moved within same county (%) - Black or African American
Geographical mobility - Moved within same county (%) - Asian
Geographical mobility - Moved within same county (%) - Hispanic or Latino
Geographical mobility - Moved within same county (%) - American Indian and Alaska Native
Geographical mobility - Moved within same county (%) - Multirace
Geographical mobility - Moved within same county (%) - Other Race
Geographical mobility - Moved from different county within same state (%)
Geographical mobility - Moved from different county within same state (%) - White
Geographical mobility - Moved from different county within same state (%) - Black or African American
Geographical mobility - Moved from different county within same state (%) - Asian
Geographical mobility - Moved from different county within same state (%) - Hispanic or Latino
Geographical mobility - Moved from different county within same state (%) - American Indian and Alaska Native
Geographical mobility - Moved from different county within same state (%) - Multirace
Geographical mobility - Moved from different county within same state (%) - Other Race
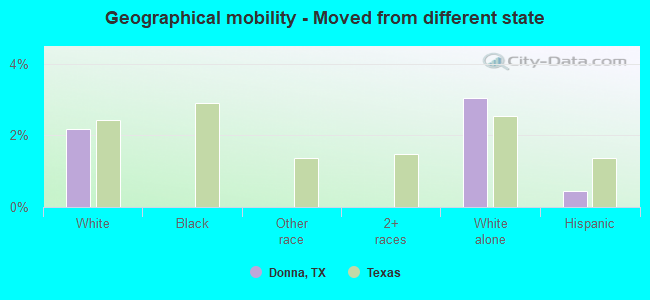
Geographical mobility - Moved from different state (%)
Geographical mobility - Moved from different state (%) - White
Geographical mobility - Moved from different state (%) - Black or African American
Geographical mobility - Moved from different state (%) - Asian
Geographical mobility - Moved from different state (%) - Hispanic or Latino
Geographical mobility - Moved from different state (%) - American Indian and Alaska Native
Geographical mobility - Moved from different state (%) - Multirace
Geographical mobility - Moved from different state (%) - Other Race
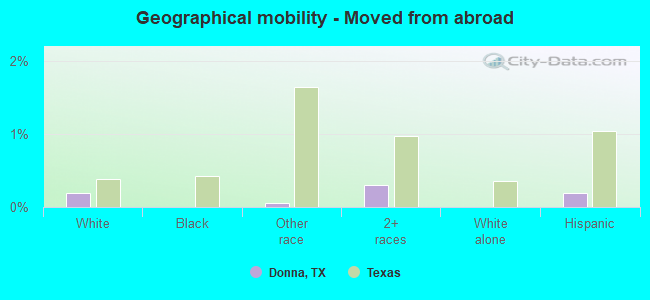
Geographical mobility - Moved from abroad (%)
Geographical mobility - Moved from abroad (%) - White
Geographical mobility - Moved from abroad (%) - Black or African American
Geographical mobility - Moved from abroad (%) - Asian
Geographical mobility - Moved from abroad (%) - Hispanic or Latino
Geographical mobility - Moved from abroad (%) - American Indian and Alaska Native
Geographical mobility - Moved from abroad (%) - Multirace
Geographical mobility - Moved from abroad (%) - Other Race
Place of birth for the foreign-born population - Ireland (%)
Place of birth for the foreign-born population - Denmark (%)
Place of birth for the foreign-born population - Norway (%)
Place of birth for the foreign-born population - Sweden (%)
Place of birth for the foreign-born population - United Kingdom (%)
Place of birth for the foreign-born population - England (%)
Place of birth for the foreign-born population - Scotland (%)
Place of birth for the foreign-born population - Other Northern Europe (%)
Place of birth for the foreign-born population - Austria (%)
Place of birth for the foreign-born population - Belgium (%)
Place of birth for the foreign-born population - France (%)
Place of birth for the foreign-born population - Germany (%)
Place of birth for the foreign-born population - Netherlands (%)
Place of birth for the foreign-born population - Switzerland (%)
Place of birth for the foreign-born population - Other Western Europe (%)
Place of birth for the foreign-born population - Greece (%)
Place of birth for the foreign-born population - Italy (%)
Place of birth for the foreign-born population - Portugal (%)
Place of birth for the foreign-born population - Spain (%)
Place of birth for the foreign-born population - Other Southern Europe (%)
Place of birth for the foreign-born population - Albania (%)
Place of birth for the foreign-born population - Belarus (%)
Place of birth for the foreign-born population - Bosnia and Herzegovina (%)
Place of birth for the foreign-born population - Bulgaria (%)
Place of birth for the foreign-born population - Croatia (%)
Place of birth for the foreign-born population - Czechoslovakia (%)
Place of birth for the foreign-born population - Hungary (%)
Place of birth for the foreign-born population - Latvia (%)
Place of birth for the foreign-born population - Lithuania (%)
Place of birth for the foreign-born population - North Macedonia (Macedonia) (%)
Place of birth for the foreign-born population - Moldova (%)
Place of birth for the foreign-born population - Poland (%)
Place of birth for the foreign-born population - Romania (%)
Place of birth for the foreign-born population - Russia (%)
Place of birth for the foreign-born population - Serbia (%)
Place of birth for the foreign-born population - Ukraine (%)
Place of birth for the foreign-born population - Other Eastern Europe (%)
Place of birth for the foreign-born population - China (%)
Place of birth for the foreign-born population - Hong Kong (%)
Place of birth for the foreign-born population - Taiwan (%)
Place of birth for the foreign-born population - Japan (%)
Place of birth for the foreign-born population - Korea (%)
Place of birth for the foreign-born population - Other Eastern Asia (%)
Place of birth for the foreign-born population - Afghanistan (%)
Place of birth for the foreign-born population - Bangladesh (%)
Place of birth for the foreign-born population - India (%)
Place of birth for the foreign-born population - Iran (%)
Place of birth for the foreign-born population - Kazakhstan (%)
Place of birth for the foreign-born population - Nepal (%)
Place of birth for the foreign-born population - Pakistan (%)
Place of birth for the foreign-born population - Sri Lanka (%)
Place of birth for the foreign-born population - Uzbekistan (%)
Place of birth for the foreign-born population - Other South Central Asia (%)
Place of birth for the foreign-born population - Burma (%)
Place of birth for the foreign-born population - Cambodia (%)
Place of birth for the foreign-born population - Indonesia (%)
Place of birth for the foreign-born population - Laos (%)
Place of birth for the foreign-born population - Malaysia (%)
Place of birth for the foreign-born population - Philippines (%)
Place of birth for the foreign-born population - Singapore (%)
Place of birth for the foreign-born population - Thailand (%)
Place of birth for the foreign-born population - Vietnam (%)
Place of birth for the foreign-born population - Other South Eastern Asia (%)
Place of birth for the foreign-born population - Armenia (%)
Place of birth for the foreign-born population - Iraq (%)
Place of birth for the foreign-born population - Israel (%)
Place of birth for the foreign-born population - Jordan (%)
Place of birth for the foreign-born population - Kuwait (%)
Place of birth for the foreign-born population - Lebanon (%)
Place of birth for the foreign-born population - Saudi Arabia (%)
Place of birth for the foreign-born population - Syria (%)
Place of birth for the foreign-born population - Turkey (%)
Place of birth for the foreign-born population - Yemen (%)
Place of birth for the foreign-born population - Other Western Asia (%)
Place of birth for the foreign-born population - Eritrea (%)
Place of birth for the foreign-born population - Ethiopia (%)
Place of birth for the foreign-born population - Kenya (%)
Place of birth for the foreign-born population - Somalia (%)
Place of birth for the foreign-born population - Uganda (%)
Place of birth for the foreign-born population - Zimbabwe (%)
Place of birth for the foreign-born population - Other Eastern Africa (%)
Place of birth for the foreign-born population - Cameroon (%)
Place of birth for the foreign-born population - Congo (%)
Place of birth for the foreign-born population - Democratic Republic of Congo (Zaire) (%)
Place of birth for the foreign-born population - Other Middle Africa (%)
Place of birth for the foreign-born population - Egypt (%)
Place of birth for the foreign-born population - Morocco (%)
Place of birth for the foreign-born population - Sudan (%)
Place of birth for the foreign-born population - Other Northern Africa (%)
Place of birth for the foreign-born population - South Africa (%)
Place of birth for the foreign-born population - Other Southern Africa (%)
Place of birth for the foreign-born population - Cabo Verde (%)
Place of birth for the foreign-born population - Ghana (%)
Place of birth for the foreign-born population - Liberia (%)
Place of birth for the foreign-born population - Nigeria (%)
Place of birth for the foreign-born population - Senegal (%)
Place of birth for the foreign-born population - Sierra Leone (%)
Place of birth for the foreign-born population - Other Western Africa (%)
Place of birth for the foreign-born population - Australia (%)
Place of birth for the foreign-born population - New Zealand (%)
Place of birth for the foreign-born population - Fiji (%)
Place of birth for the foreign-born population - Micronesia (%)
Place of birth for the foreign-born population - Bahamas (%)
Place of birth for the foreign-born population - Barbados (%)
Place of birth for the foreign-born population - Cuba (%)
Place of birth for the foreign-born population - Dominica (%)
Place of birth for the foreign-born population - Dominican Republic (%)
Place of birth for the foreign-born population - Grenada (%)
Place of birth for the foreign-born population - Haiti (%)
Place of birth for the foreign-born population - Jamaica (%)
Place of birth for the foreign-born population - St. Vincent and the Grenadines (%)
Place of birth for the foreign-born population - Trinidad and Tobago (%)
Place of birth for the foreign-born population - West Indies (%)
Place of birth for the foreign-born population - Other Caribbean (%)
Place of birth for the foreign-born population - Belize (%)
Place of birth for the foreign-born population - Costa Rica (%)
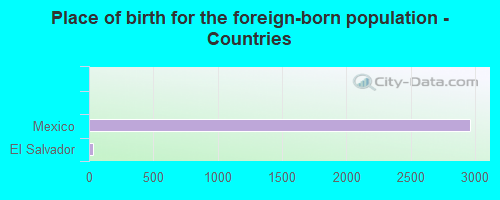
Place of birth for the foreign-born population - El Salvador (%)
Place of birth for the foreign-born population - Guatemala (%)
Place of birth for the foreign-born population - Honduras (%)
Place of birth for the foreign-born population - Mexico (%)
Place of birth for the foreign-born population - Nicaragua (%)
Place of birth for the foreign-born population - Panama (%)
Place of birth for the foreign-born population - Other Central America (%)
Place of birth for the foreign-born population - Argentina (%)
Place of birth for the foreign-born population - Bolivia (%)
Place of birth for the foreign-born population - Brazil (%)
Place of birth for the foreign-born population - Chile (%)
Place of birth for the foreign-born population - Colombia (%)
Place of birth for the foreign-born population - Ecuador (%)
Place of birth for the foreign-born population - Guyana (%)
Place of birth for the foreign-born population - Peru (%)
Place of birth for the foreign-born population - Uruguay (%)
Place of birth for the foreign-born population - Venezuela (%)
Place of birth for the foreign-born population - Other South America (%)
Place of birth for the foreign-born population - Canada (%)
Place of birth for the foreign-born population - Other Northern America (%)
Place of birth for the foreign-born population - Other (%)
Latest news about races in Donna, TX collected exclusively by city-data.com from local newspapers, TV, and radio stations
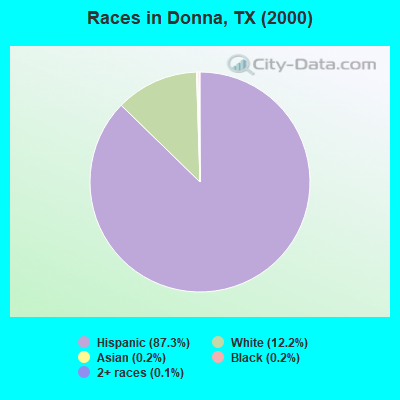
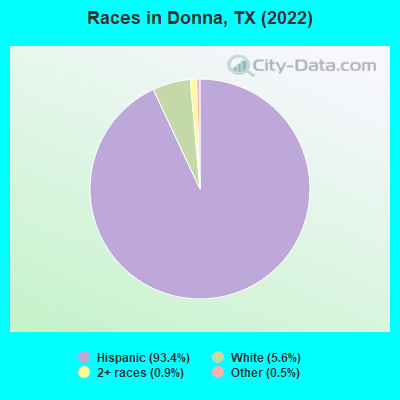
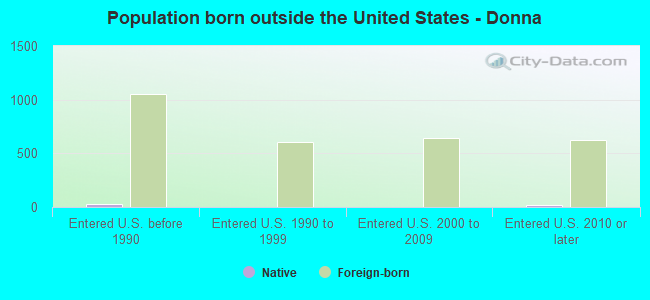
According to 2022 data, the most numerous races in Donna, TX are Hispanic (15,911 residents), White alone (961 residents), and Black alone (0 residents). 20.4% of Donna residents speak English at home. 17.8% of Donna, TX residents are foreign-born (17.4% born in Latin America), which is 4.5% greater than the foreign-born rate of 17.0% across the entire state of Texas.
Race distribution in Donna
2000 2022
10,933,313 52.4% White alone 6,669,666 32.0% Hispanic 2,364,255 11.3% Black alone 554,445 2.7% Asian alone 230,567 1.1% Two or more races 68,859 0.3% American Indian alone 19,958 0.10% Other race alone 10,757 0.05% Native Hawaiian and Other
12,070,642 40.2% Hispanic 11,683,430 38.9% White alone 3,508,706 11.7% Black alone 1,608,173 5.4% Asian alone 956,560 3.2% Two or more races 125,763 0.4% Other race alone 47,023 0.2% American Indian alone 29,275 0.10% Native Hawaiian and Other
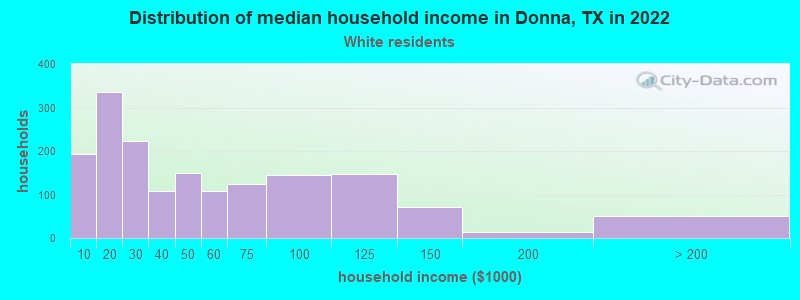
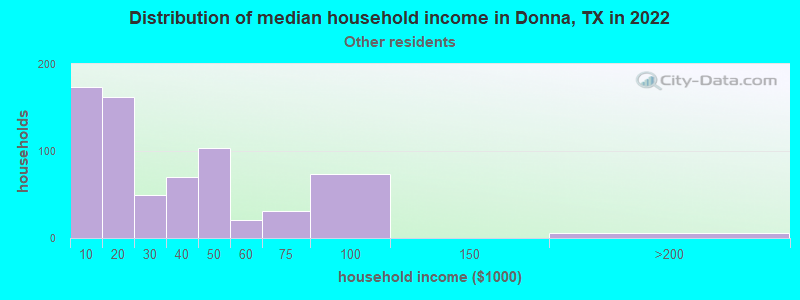
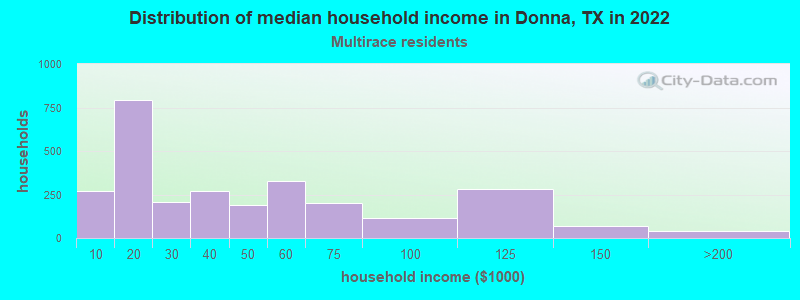
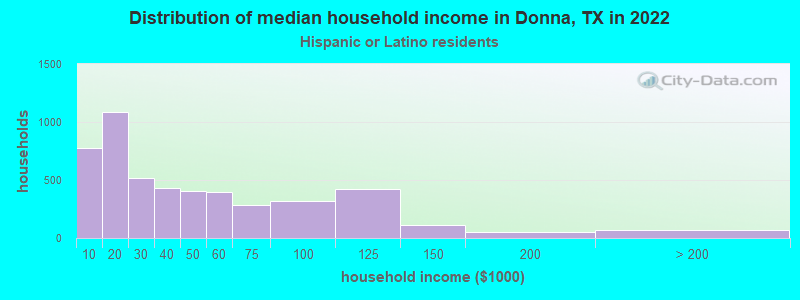
Income and house value in Donna Median household income in 2022 $58,487 White non-Hispanic householders$31,659 Two or more races householders$29,767 Hispanic or Latino race householdersMedian 2022 house value $134,867 White Non-Hispanic householders$82,236 American Indian or Alaska Native householders$67,068 Some other race householders$88,084 Two or more races householders$72,002 Hispanic or Latino householders
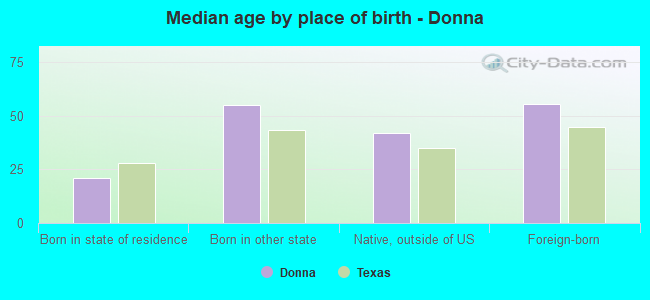
Median age by race in Donna
26.8 Median age for White residents25.3 29.0 1.9 Median age for Black or African American residents-682,648,401.1 -489,388,264.2 -560,747,663.0 Median age for American Indian / Alaska Native residents-575,645,755.9 -627,650,550.7 -666,666,666.0 Median age for Asian residents-602,763,384.5 -710,659,897.8 -581,560,283.1 Median age for Native Hawaiian / Pacific Islander residents-612,729,233.5 -577,777,777.2 43.2 Median age for Other race residents45.0 41.8 34.4 Median age for Two or more races residents38.1 29.5 64.7 Median age for White alone residents63.4 67.3 29.3 Median age for Hispanic or Latino residents29.9 28.8
Owner/renter occupied households by race in Donna
House owners and renters - White residents 940 61.8% Owner occupied582 38.2% Renter occupiedHouse owners and renters - Other race residents 352 47.6% Owner occupied387 52.4% Renter occupiedHouse owners and renters - Two or more races residents 1,685 60.7% Owner occupied1,092 39.3% Renter occupiedHouse owners and renters - White alone residents 471 94.5% Owner occupied27 5.5% Renter occupiedHouse owners and renters - Hispanic or Latino residents 2,691 54.8% Owner occupied2,216 45.2% Renter occupied
Language usage in Donna
English speakers - Total 20.4% of residents of Donna speak English at home.
79.8% of residents speak Spanish at home 8,810 70.1% Speak English very well3,754 29.9% Speak English less than very well
English speakers - Born in the United States 54.3% of residents of Donna speak English at home.
46.1% of residents speak Spanish at home 575 84.4% Speak English very well106 15.6% Speak English less than very well
English speakers - Native, born elsewhere 11.9% of residents of Donna speak English at home.
76.2% of residents speak Spanish at home 18 56.2% Speak English very well14 43.8% Speak English less than very well14.3% of residents speak other language at home 6 100.0% Speak English very well
English speakers - Foreign-born 1.1% of residents of Donna speak English at home.
98.0% of residents speak Spanish at home 688 23.4% Speak English very well2,253 76.6% Speak English less than very well
White (Caucasian) - Speak only English Native:
41.5% (2,005)Foreign-born:
1.7% (5)
White (Caucasian) - Speak another language Native:
58.4% (2,818)Foreign-born:
87.0% (272)
Other race - Speak another language Native:
62.7% (423)Foreign-born:
99.5% (808)
Two or more races - Speak only English Native:
10.0% (557)Foreign-born:
2.1% (47)
Two or more races - Speak another language Native:
90.6% (5,025)Foreign-born:
97.6% (2,216)
White alone - Speak another language Native:
18.9% (174)Foreign-born:
100.0% (1)
Hispanic or Latino - Speak only English Native:
19.4% (2,260)Foreign-born:
1.2% (36)
Hispanic or Latino - Speak another language Native:
80.6% (9,402)Foreign-born:
98.3% (2,933)
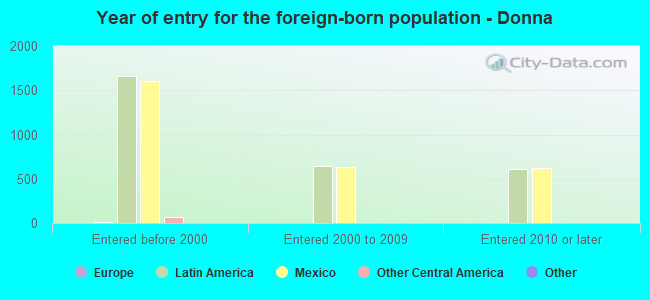
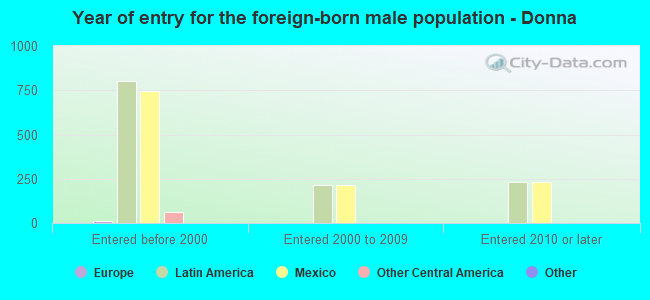
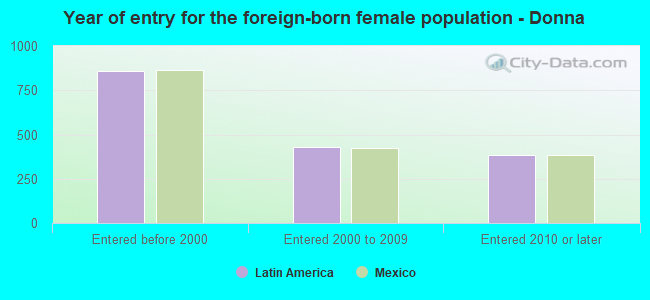
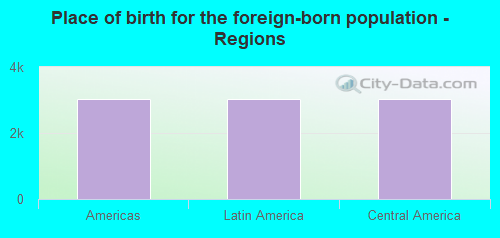
Foreign-born residents in Donna 3,031 residents are foreign born (17.4% Latin America ).
This city:
17.8%Texas:
17.1%
Marital status for residents in Donna Marital status - White (Caucasian) population 15 years and over
Males 41.0% Never married44.9% Now married2.6% Separated3.6% Widowed7.9% DivorcedFemales 34.7% Never married36.7% Now married5.7% Separated14.6% Widowed8.3% DivorcedWomen who gave birth in the past 12 months Now married:
73.5% (44)Unmarried:
26.5% (16)
Women who did not give birth in the past 12 months Now married:
33.1% (259)Unmarried:
66.9% (523)
Marital status - Other race population 15 years and over
Males 18.0% Never married54.4% Now married0.0% Separated13.3% Widowed14.3% DivorcedFemales 13.6% Never married47.6% Now married10.5% Separated18.4% Widowed9.9% DivorcedWomen who gave birth in the past 12 months Now married:
59.5% (19)Unmarried:
40.5% (13)
Women who did not give birth in the past 12 months Now married:
64.9% (216)Unmarried:
35.1% (117)
Marital status - Two or more races population 15 years and over
Males 30.2% Never married53.3% Now married6.8% Separated4.3% Widowed5.4% DivorcedFemales 40.4% Never married35.4% Now married6.2% Separated5.9% Widowed12.0% DivorcedWomen who gave birth in the past 12 months Now married:
100.0% (175)Unmarried:
0.0% (0)
Women who did not give birth in the past 12 months Now married:
32.7% (728)Unmarried:
67.3% (1,502)
Marital status - White alone, not Hispanic / Latino population 15 years and over
Males 2.8% Never married70.1% Now married0.0% Separated10.5% Widowed16.7% DivorcedFemales 3.6% Never married56.3% Now married0.0% Separated24.4% Widowed15.7% DivorcedWomen who did not give birth in the past 12 months Now married:
61.9% (14)Unmarried:
38.1% (9)
Marital status - Hispanic or Latino population 15 years and over
Males 36.8% Never married46.8% Now married3.6% Separated5.0% Widowed7.7% DivorcedFemales 36.2% Never married36.2% Now married7.0% Separated11.2% Widowed9.4% DivorcedWomen who gave birth in the past 12 months Now married:
81.0% (222)Unmarried:
19.0% (52)
Women who did not give birth in the past 12 months Now married:
36.2% (1,235)Unmarried:
63.8% (2,180)
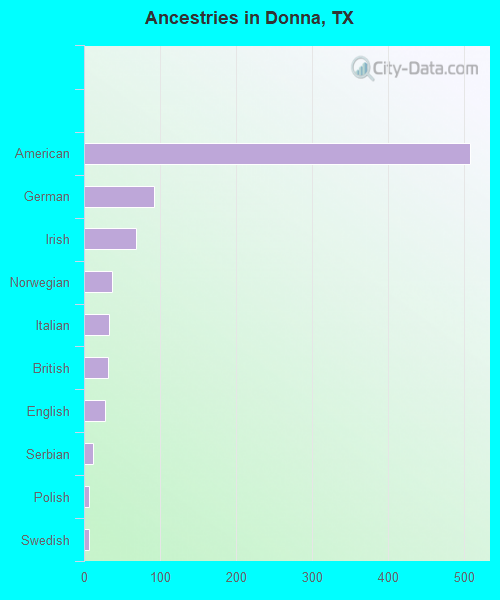
Ancestries in Donna
507 3.7% American92 0.7% German68 0.5% Irish37 0.3% Norwegian33 0.2% Italian32 0.2% British28 0.2% English12 0.09% Serbian6 0.04% Polish6 0.04% Swedish1 0.01% Egyptian
Children Nativity (place of birth) in Donna
Children under 6 years - Living with two parents Both parents native 403 100.0% NativeBoth parents foreign-born 9 100.0% NativeOne native, one foreign-born parent 171 100.0% NativeChildren under 6 years - Living with one parent Native parent 850 100.0% NativeForeign-born parent 160 100.0% NativeChildren 6 to 17 years - Living with two parents Both parents native 597 99.9% Native1 0.1% Foreign-bornBoth parents foreign-born 228 82.1% Native50 17.9% Foreign-bornOne native, one foreign-born parent 915 99.0% Native9 1.0% Foreign-bornChildren 6 to 17 years - Living with one parent Native parent 1,664 100.0% NativeForeign-born parent 395 50.6% Native385 49.4% Foreign-born
Grandparents responsible for own grandchildren in Donna
Grandparents (30 to 59 years) White / Caucasian 20 31.5% Responsible for grandchildren44 68.5% Not responsible for grandchildrenOther race 22 45.3% Responsible for grandchildren26 54.7% Not responsible for grandchildrenTwo or more races 110 100.0% Not responsible for grandchildrenHispanic or Latino 85 32.8% Responsible for grandchildren175 67.2% Not responsible for grandchildrenGrandparents (60 years and over) White / Caucasian 52 53.6% Responsible for grandchildren45 46.4% Not responsible for grandchildrenOther race 85 82.6% Responsible for grandchildren18 17.4% Not responsible for grandchildrenTwo or more races 8 4.1% Responsible for grandchildren183 95.9% Not responsible for grandchildrenHispanic or Latino 175 49.5% Responsible for grandchildren179 50.5% Not responsible for grandchildren