Races in Del City, Oklahoma (OK) Detailed Stats
Data:
Races - White alone (%)
Races - White alone (% change since 2000)
Races - Black alone (%)
Races - Black alone (% change since 2000)
Races - American Indian alone (%)
Races - American Indian alone (% change since 2000)
Races - Asian alone (%)
Races - Asian alone (% change since 2000)
Races - Hispanic (%)
Races - Hispanic (% change since 2000)
Races - Native Hawaiian and Other Pacific Islander alone (%)
Races - Native Hawaiian and Other Pacific Islander alone (% change since 2000)
Races - Two or more races(%)
Races - Two or more races(% change since 2000)
Races - Other race alone (%)
Races - Other race alone (% change since 2000)
Racial diversity
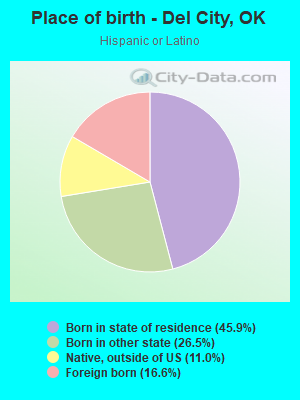
Place of birth - Born in state of residence (%)
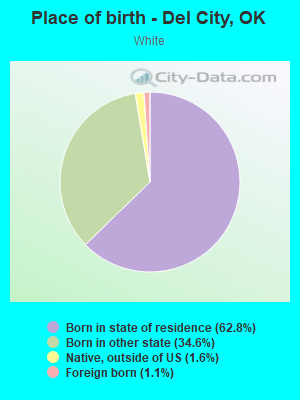
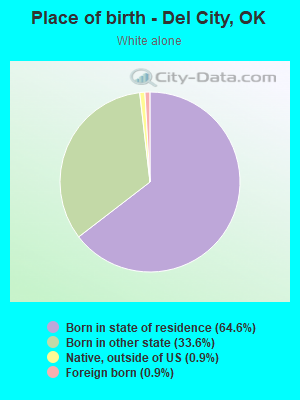
Place of birth - Born in state of residence (%) - White
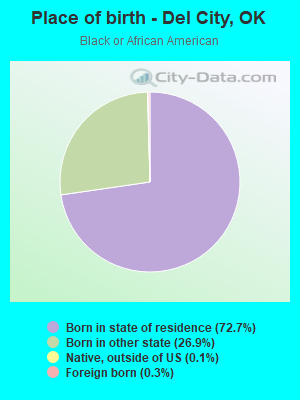
Place of birth - Born in state of residence (%) - Black or African American
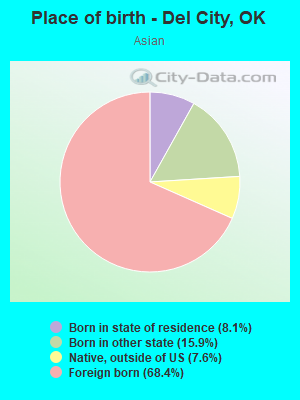
Place of birth - Born in state of residence (%) - Asian
Place of birth - Born in state of residence (%) - Hispanic or Latino
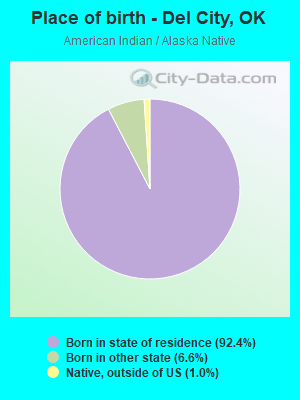
Place of birth - Born in state of residence (%) - American Indian and Alaska Native
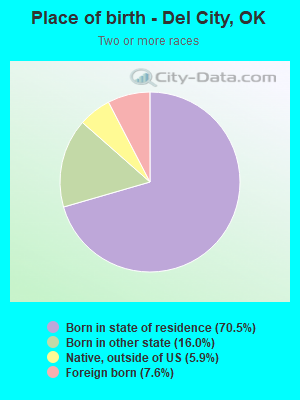
Place of birth - Born in state of residence (%) - Multirace
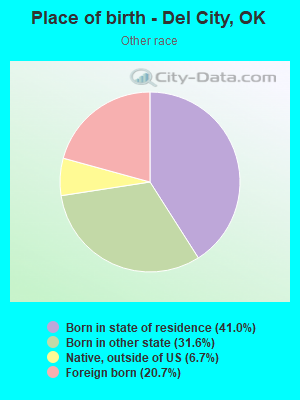
Place of birth - Born in state of residence (%) - Other Race
Place of birth - Born in other state (%)
Place of birth - Born in other state (%) - White
Place of birth - Born in other state (%) - Black or African American
Place of birth - Born in other state (%) - Asian
Place of birth - Born in other state (%) - Hispanic or Latino
Place of birth - Born in other state (%) - American Indian and Alaska Native
Place of birth - Born in other state (%) - Multirace
Place of birth - Born in other state (%) - Other Race
Place of birth - Native, outside of US (%)
Place of birth - Native, outside of US (%) - White
Place of birth - Native, outside of US (%) - Black or African American
Place of birth - Native, outside of US (%) - Asian
Place of birth - Native, outside of US (%) - Hispanic or Latino
Place of birth - Native, outside of US (%) - American Indian and Alaska Native
Place of birth - Native, outside of US (%) - Multirace
Place of birth - Native, outside of US (%) - Other Race
Place of birth - Foreign born (%)
Place of birth - Foreign born (%) - White
Place of birth - Foreign born (%) - Black or African American
Place of birth - Foreign born (%) - Asian
Place of birth - Foreign born (%) - Hispanic or Latino
Place of birth - Foreign born (%) - American Indian and Alaska Native
Place of birth - Foreign born (%) - Multirace
Place of birth - Foreign born (%) - Other Race
Residents speaking English at home (%)
Residents speaking English at home - Born in the United States (%)
Residents speaking English at home - Native, born elsewhere (%)
Residents speaking English at home - Foreign born (%)
Residents speaking Spanish at home (%)
Residents speaking Spanish at home - Born in the United States (%)
Residents speaking Spanish at home - Native, born elsewhere (%)
Residents speaking Spanish at home - Foreign born (%)
Residents speaking other language at home (%)
Residents speaking other language at home - Born in the United States (%)
Residents speaking other language at home - Native, born elsewhere (%)
Residents speaking other language at home - Foreign born (%)
Marital status - Never married (%)
Marital status - Now married (%)
Marital status - Separated (%)
Marital status - Widowed (%)
Marital status - Divorced (%)
Ancestries Reported - Arab (%)
Ancestries Reported - Czech (%)
Ancestries Reported - Danish (%)
Ancestries Reported - Dutch (%)
Ancestries Reported - English (%)
Ancestries Reported - French (%)
Ancestries Reported - French Canadian (%)
Ancestries Reported - German (%)
Ancestries Reported - Greek (%)
Ancestries Reported - Hungarian (%)
Ancestries Reported - Irish (%)
Ancestries Reported - Italian (%)
Ancestries Reported - Lithuanian (%)
Ancestries Reported - Norwegian (%)
Ancestries Reported - Polish (%)
Ancestries Reported - Portuguese (%)
Ancestries Reported - Russian (%)
Ancestries Reported - Scotch-Irish (%)
Ancestries Reported - Scottish (%)
Ancestries Reported - Slovak (%)
Ancestries Reported - Subsaharan African (%)
Ancestries Reported - Swedish (%)
Ancestries Reported - Swiss (%)
Ancestries Reported - Ukrainian (%)
Ancestries Reported - United States (%)
Ancestries Reported - Welsh (%)
Ancestries Reported - West Indian (%)
Ancestries Reported - Other (%)
Geographical mobility - Same house 1 year ago (%)
Geographical mobility - Same house 1 year ago (%) - White
Geographical mobility - Same house 1 year ago (%) - Black or African American
Geographical mobility - Same house 1 year ago (%) - Asian
Geographical mobility - Same house 1 year ago (%) - Hispanic or Latino
Geographical mobility - Same house 1 year ago (%) - American Indian and Alaska Native
Geographical mobility - Same house 1 year ago (%) - Multirace
Geographical mobility - Same house 1 year ago (%) - Other Race
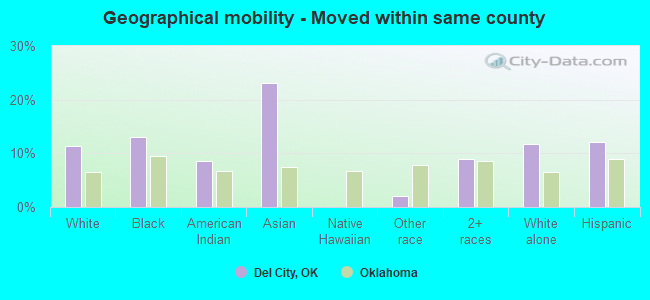
Geographical mobility - Moved within same county (%)
Geographical mobility - Moved within same county (%) - White
Geographical mobility - Moved within same county (%) - Black or African American
Geographical mobility - Moved within same county (%) - Asian
Geographical mobility - Moved within same county (%) - Hispanic or Latino
Geographical mobility - Moved within same county (%) - American Indian and Alaska Native
Geographical mobility - Moved within same county (%) - Multirace
Geographical mobility - Moved within same county (%) - Other Race
Geographical mobility - Moved from different county within same state (%)
Geographical mobility - Moved from different county within same state (%) - White
Geographical mobility - Moved from different county within same state (%) - Black or African American
Geographical mobility - Moved from different county within same state (%) - Asian
Geographical mobility - Moved from different county within same state (%) - Hispanic or Latino
Geographical mobility - Moved from different county within same state (%) - American Indian and Alaska Native
Geographical mobility - Moved from different county within same state (%) - Multirace
Geographical mobility - Moved from different county within same state (%) - Other Race
Geographical mobility - Moved from different state (%)
Geographical mobility - Moved from different state (%) - White
Geographical mobility - Moved from different state (%) - Black or African American
Geographical mobility - Moved from different state (%) - Asian
Geographical mobility - Moved from different state (%) - Hispanic or Latino
Geographical mobility - Moved from different state (%) - American Indian and Alaska Native
Geographical mobility - Moved from different state (%) - Multirace
Geographical mobility - Moved from different state (%) - Other Race
Geographical mobility - Moved from abroad (%)
Geographical mobility - Moved from abroad (%) - White
Geographical mobility - Moved from abroad (%) - Black or African American
Geographical mobility - Moved from abroad (%) - Asian
Geographical mobility - Moved from abroad (%) - Hispanic or Latino
Geographical mobility - Moved from abroad (%) - American Indian and Alaska Native
Geographical mobility - Moved from abroad (%) - Multirace
Geographical mobility - Moved from abroad (%) - Other Race
Place of birth for the foreign-born population - Ireland (%)
Place of birth for the foreign-born population - Denmark (%)
Place of birth for the foreign-born population - Norway (%)
Place of birth for the foreign-born population - Sweden (%)
Place of birth for the foreign-born population - United Kingdom (%)
Place of birth for the foreign-born population - England (%)
Place of birth for the foreign-born population - Scotland (%)
Place of birth for the foreign-born population - Other Northern Europe (%)
Place of birth for the foreign-born population - Austria (%)
Place of birth for the foreign-born population - Belgium (%)
Place of birth for the foreign-born population - France (%)
Place of birth for the foreign-born population - Germany (%)
Place of birth for the foreign-born population - Netherlands (%)
Place of birth for the foreign-born population - Switzerland (%)
Place of birth for the foreign-born population - Other Western Europe (%)
Place of birth for the foreign-born population - Greece (%)
Place of birth for the foreign-born population - Italy (%)
Place of birth for the foreign-born population - Portugal (%)
Place of birth for the foreign-born population - Spain (%)
Place of birth for the foreign-born population - Other Southern Europe (%)
Place of birth for the foreign-born population - Albania (%)
Place of birth for the foreign-born population - Belarus (%)
Place of birth for the foreign-born population - Bosnia and Herzegovina (%)
Place of birth for the foreign-born population - Bulgaria (%)
Place of birth for the foreign-born population - Croatia (%)
Place of birth for the foreign-born population - Czechoslovakia (%)
Place of birth for the foreign-born population - Hungary (%)
Place of birth for the foreign-born population - Latvia (%)
Place of birth for the foreign-born population - Lithuania (%)
Place of birth for the foreign-born population - North Macedonia (Macedonia) (%)
Place of birth for the foreign-born population - Moldova (%)
Place of birth for the foreign-born population - Poland (%)
Place of birth for the foreign-born population - Romania (%)
Place of birth for the foreign-born population - Russia (%)
Place of birth for the foreign-born population - Serbia (%)
Place of birth for the foreign-born population - Ukraine (%)
Place of birth for the foreign-born population - Other Eastern Europe (%)
Place of birth for the foreign-born population - China (%)
Place of birth for the foreign-born population - Hong Kong (%)
Place of birth for the foreign-born population - Taiwan (%)
Place of birth for the foreign-born population - Japan (%)
Place of birth for the foreign-born population - Korea (%)
Place of birth for the foreign-born population - Other Eastern Asia (%)
Place of birth for the foreign-born population - Afghanistan (%)
Place of birth for the foreign-born population - Bangladesh (%)
Place of birth for the foreign-born population - India (%)
Place of birth for the foreign-born population - Iran (%)
Place of birth for the foreign-born population - Kazakhstan (%)
Place of birth for the foreign-born population - Nepal (%)
Place of birth for the foreign-born population - Pakistan (%)
Place of birth for the foreign-born population - Sri Lanka (%)
Place of birth for the foreign-born population - Uzbekistan (%)
Place of birth for the foreign-born population - Other South Central Asia (%)
Place of birth for the foreign-born population - Burma (%)
Place of birth for the foreign-born population - Cambodia (%)
Place of birth for the foreign-born population - Indonesia (%)
Place of birth for the foreign-born population - Laos (%)
Place of birth for the foreign-born population - Malaysia (%)
Place of birth for the foreign-born population - Philippines (%)
Place of birth for the foreign-born population - Singapore (%)
Place of birth for the foreign-born population - Thailand (%)
Place of birth for the foreign-born population - Vietnam (%)
Place of birth for the foreign-born population - Other South Eastern Asia (%)
Place of birth for the foreign-born population - Armenia (%)
Place of birth for the foreign-born population - Iraq (%)
Place of birth for the foreign-born population - Israel (%)
Place of birth for the foreign-born population - Jordan (%)
Place of birth for the foreign-born population - Kuwait (%)
Place of birth for the foreign-born population - Lebanon (%)
Place of birth for the foreign-born population - Saudi Arabia (%)
Place of birth for the foreign-born population - Syria (%)
Place of birth for the foreign-born population - Turkey (%)
Place of birth for the foreign-born population - Yemen (%)
Place of birth for the foreign-born population - Other Western Asia (%)
Place of birth for the foreign-born population - Eritrea (%)
Place of birth for the foreign-born population - Ethiopia (%)
Place of birth for the foreign-born population - Kenya (%)
Place of birth for the foreign-born population - Somalia (%)
Place of birth for the foreign-born population - Uganda (%)
Place of birth for the foreign-born population - Zimbabwe (%)
Place of birth for the foreign-born population - Other Eastern Africa (%)
Place of birth for the foreign-born population - Cameroon (%)
Place of birth for the foreign-born population - Congo (%)
Place of birth for the foreign-born population - Democratic Republic of Congo (Zaire) (%)
Place of birth for the foreign-born population - Other Middle Africa (%)
Place of birth for the foreign-born population - Egypt (%)
Place of birth for the foreign-born population - Morocco (%)
Place of birth for the foreign-born population - Sudan (%)
Place of birth for the foreign-born population - Other Northern Africa (%)
Place of birth for the foreign-born population - South Africa (%)
Place of birth for the foreign-born population - Other Southern Africa (%)
Place of birth for the foreign-born population - Cabo Verde (%)
Place of birth for the foreign-born population - Ghana (%)
Place of birth for the foreign-born population - Liberia (%)
Place of birth for the foreign-born population - Nigeria (%)
Place of birth for the foreign-born population - Senegal (%)
Place of birth for the foreign-born population - Sierra Leone (%)
Place of birth for the foreign-born population - Other Western Africa (%)
Place of birth for the foreign-born population - Australia (%)
Place of birth for the foreign-born population - New Zealand (%)
Place of birth for the foreign-born population - Fiji (%)
Place of birth for the foreign-born population - Micronesia (%)
Place of birth for the foreign-born population - Bahamas (%)
Place of birth for the foreign-born population - Barbados (%)
Place of birth for the foreign-born population - Cuba (%)
Place of birth for the foreign-born population - Dominica (%)
Place of birth for the foreign-born population - Dominican Republic (%)
Place of birth for the foreign-born population - Grenada (%)
Place of birth for the foreign-born population - Haiti (%)
Place of birth for the foreign-born population - Jamaica (%)
Place of birth for the foreign-born population - St. Vincent and the Grenadines (%)
Place of birth for the foreign-born population - Trinidad and Tobago (%)
Place of birth for the foreign-born population - West Indies (%)
Place of birth for the foreign-born population - Other Caribbean (%)
Place of birth for the foreign-born population - Belize (%)
Place of birth for the foreign-born population - Costa Rica (%)
Place of birth for the foreign-born population - El Salvador (%)
Place of birth for the foreign-born population - Guatemala (%)
Place of birth for the foreign-born population - Honduras (%)
Place of birth for the foreign-born population - Mexico (%)
Place of birth for the foreign-born population - Nicaragua (%)
Place of birth for the foreign-born population - Panama (%)
Place of birth for the foreign-born population - Other Central America (%)
Place of birth for the foreign-born population - Argentina (%)
Place of birth for the foreign-born population - Bolivia (%)
Place of birth for the foreign-born population - Brazil (%)
Place of birth for the foreign-born population - Chile (%)
Place of birth for the foreign-born population - Colombia (%)
Place of birth for the foreign-born population - Ecuador (%)
Place of birth for the foreign-born population - Guyana (%)
Place of birth for the foreign-born population - Peru (%)
Place of birth for the foreign-born population - Uruguay (%)
Place of birth for the foreign-born population - Venezuela (%)
Place of birth for the foreign-born population - Other South America (%)
Place of birth for the foreign-born population - Canada (%)
Place of birth for the foreign-born population - Other Northern America (%)
Place of birth for the foreign-born population - Other (%)
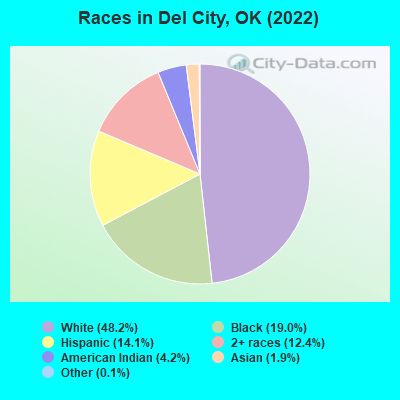
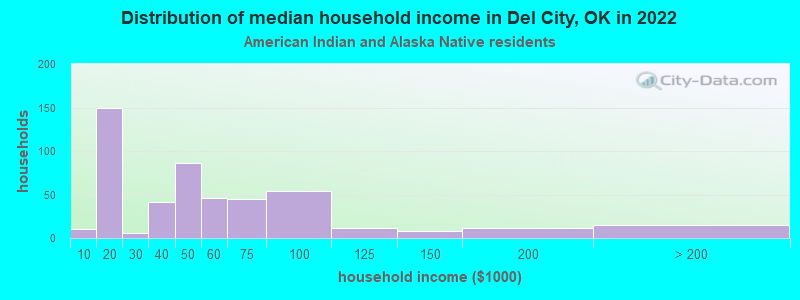
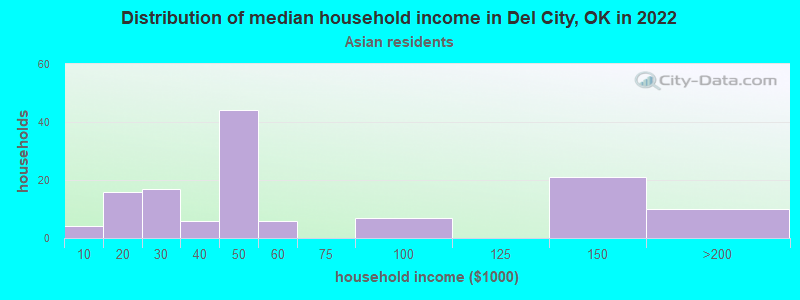
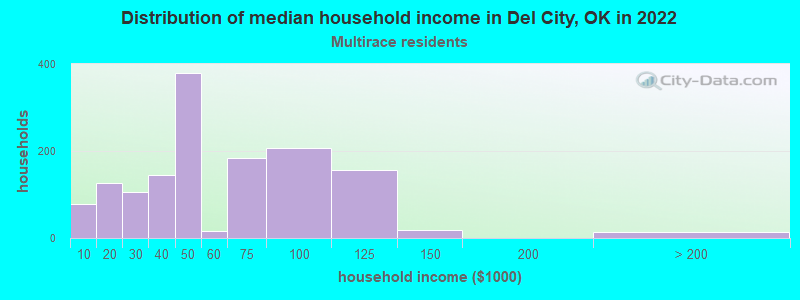
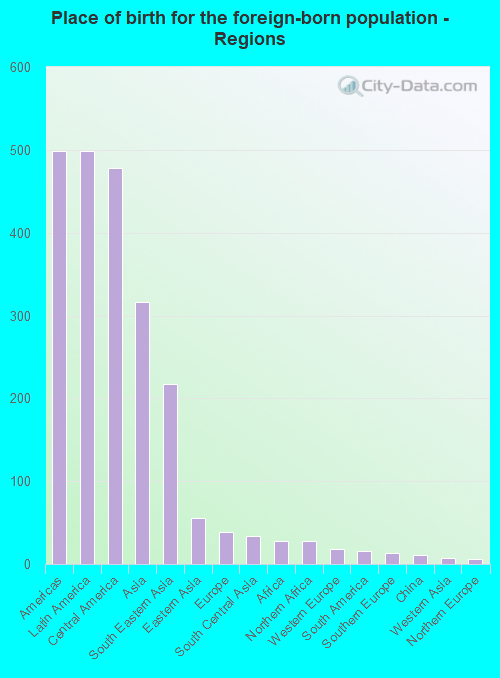
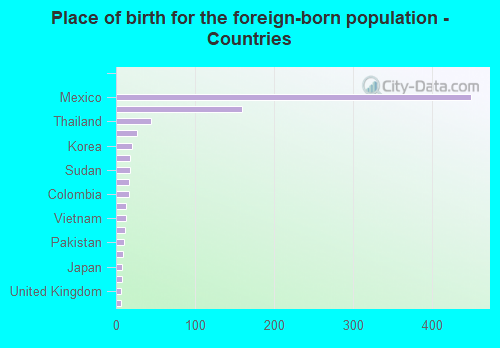
According to 2022 data, the most numerous races in Del City, OK are White alone (10,546 residents), Hispanic (3,088 residents), and Two or more races (2,714 residents). 90.8% of Del City residents speak English at home. 4.0% of Del City, OK residents are foreign-born (2.3% born in Latin America, 1.5% born in Asia), which is 48.4% less than the foreign-born rate of 6.0% across the entire state of Oklahoma.
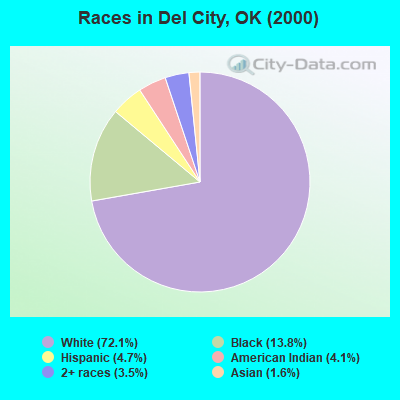
Race distribution in Del City
2000 2022
2,556,368 74.1% White alone 266,158 7.7% American Indian alone 257,981 7.5% Black alone 179,304 5.2% Hispanic 140,249 4.1% Two or more races 46,172 1.3% Asian alone 2,322 0.07% Other race alone 2,100 0.06% Native Hawaiian and Other
2,517,403 62.6% White alone 486,692 12.1% Hispanic 364,453 9.1% Two or more races 273,650 6.8% American Indian alone 268,543 6.7% Black alone 92,672 2.3% Asian alone 10,786 0.3% Other race alone 5,601 0.1% Native Hawaiian and Other
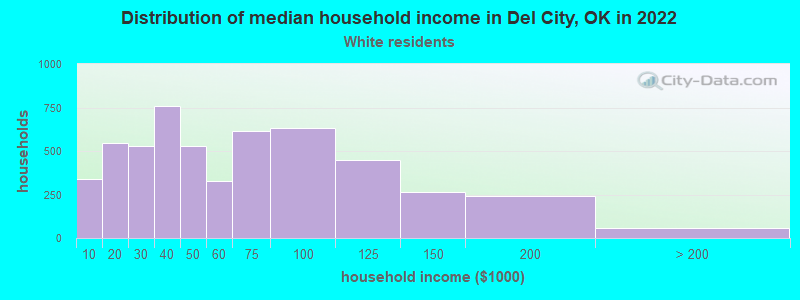
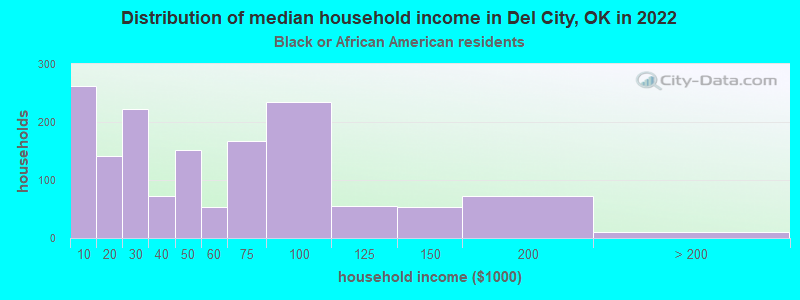
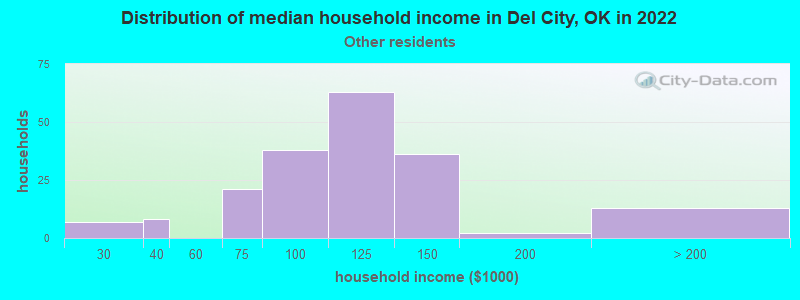
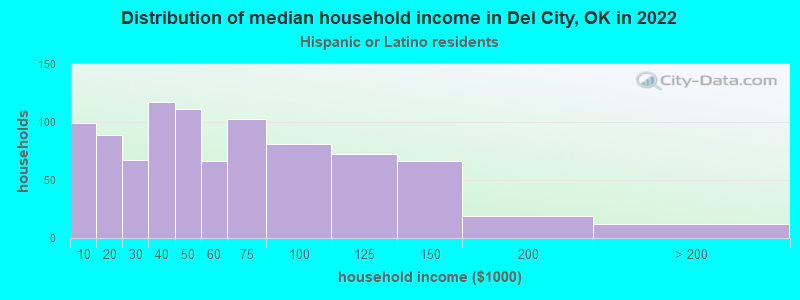
Income and house value in Del City Median household income in 2022 $50,460 White non-Hispanic householders$43,531 Black householders$45,369 American Indian and Alaska Native householders$44,971 Asian householders$96,448 Some other race householders$45,089 Two or more races householders$45,558 Hispanic or Latino race householdersMedian 2022 house value $121,515 White Non-Hispanic householders$149,357 Black or African American householders$103,346 American Indian or Alaska Native householders $103,346 Asian householders$135,672 Some other race householders$104,054 Two or more races householders$139,683 Hispanic or Latino householders
Median age by race in Del City
41.6 Median age for White residents42.0 40.9 29.0 Median age for Black or African American residents28.0 30.7 37.8 Median age for American Indian / Alaska Native residents34.1 41.9 42.2 Median age for Asian residents38.0 58.1 -725,225,224.5 Median age for Native Hawaiian / Pacific Islander residents-675,324,674.6 -767,251,461.2 24.6 Median age for Other race residents23.4 26.8 21.3 Median age for Two or more races residents23.0 19.9 41.1 Median age for White alone residents41.3 40.9 21.3 Median age for Hispanic or Latino residents20.5 23.5
Owner/renter occupied households by race in Del City
House owners and renters - White residents 3,595 68.4% Owner occupied1,658 31.6% Renter occupiedHouse owners and renters - Black or African American residents 439 27.6% Owner occupied1,153 72.4% Renter occupiedHouse owners and renters - American Indian / Alaska Native residents 130 26.2% Owner occupied366 73.8% Renter occupiedHouse owners and renters - Asian residents 36 21.2% Owner occupied134 78.8% Renter occupiedHouse owners and renters - Other race residents 99 59.5% Owner occupied67 40.5% Renter occupiedHouse owners and renters - Two or more races residents 792 57.8% Owner occupied577 42.2% Renter occupiedHouse owners and renters - White alone residents 3,570 69.3% Owner occupied1,581 30.7% Renter occupiedHouse owners and renters - Hispanic or Latino residents 366 41.1% Owner occupied524 58.9% Renter occupied
Language usage in Del City
English speakers - Total 90.8% of residents of Del City speak English at home.
7.3% of residents speak Spanish at home 949 65.2% Speak English very well507 34.8% Speak English less than very well1.7% of residents speak other language at home 224 66.1% Speak English very well115 33.9% Speak English less than very well
English speakers - Born in the United States 92.2% of residents of Del City speak English at home.
6.7% of residents speak Spanish at home 283 72.2% Speak English very well109 27.8% Speak English less than very well1.2% of residents speak other language at home 71 100.0% Speak English very well
English speakers - Native, born elsewhere 43.4% of residents of Del City speak English at home.
54.7% of residents speak Spanish at home 153 66.8% Speak English very well76 33.2% Speak English less than very well
English speakers - Foreign-born 19.4% of residents of Del City speak English at home.
53.2% of residents speak Spanish at home 213 44.9% Speak English very well261 55.1% Speak English less than very well26.5% of residents speak other language at home 136 57.6% Speak English very well100 42.4% Speak English less than very well
White (Caucasian) - Speak only English Native:
99.2% (10,284)Foreign-born:
43.0% (50)
White (Caucasian) - Speak another language Native:
2.0% (212)Foreign-born:
84.8% (99)
Black or African American - Speak another language Native:
1.4% (54)Foreign-born:
100.0% (15)
Asian - Speak only English Native:
68.5% (86)Foreign-born:
32.7% (95)
Asian - Speak another language Native:
32.7% (41)Foreign-born:
64.4% (186)
Other race - Speak only English Native:
60.2% (343)Foreign-born:
6.5% (11)
Other race - Speak another language Native:
35.7% (204)Foreign-born:
93.7% (163)
Two or more races - Speak only English Native:
79.8% (2,723)Foreign-born:
6.7% (23)
Two or more races - Speak another language Native:
17.6% (601)Foreign-born:
92.8% (320)
White alone - Speak only English Native:
98.2% (9,839)Foreign-born:
59.1% (55)
White alone - Speak another language Native:
1.7% (173)Foreign-born:
41.5% (39)
Hispanic or Latino - Speak only English Native:
63.8% (1,352)Foreign-born:
9.1% (46)
Hispanic or Latino - Speak another language Native:
36.6% (775)Foreign-born:
91.8% (468)
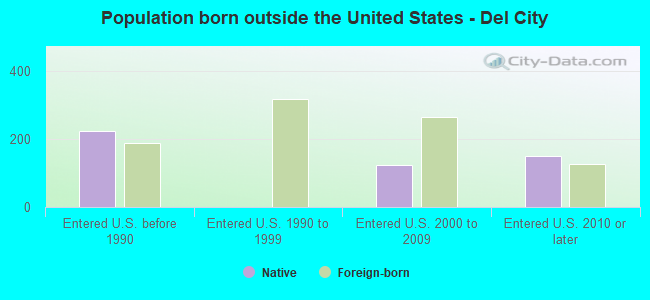
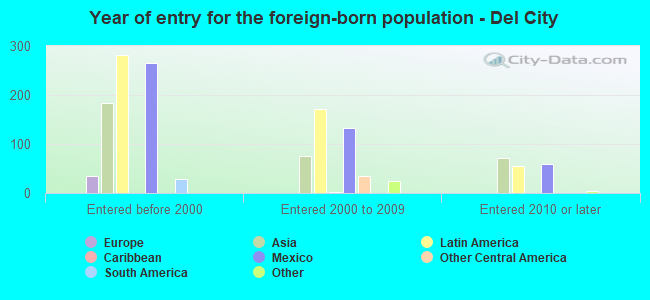
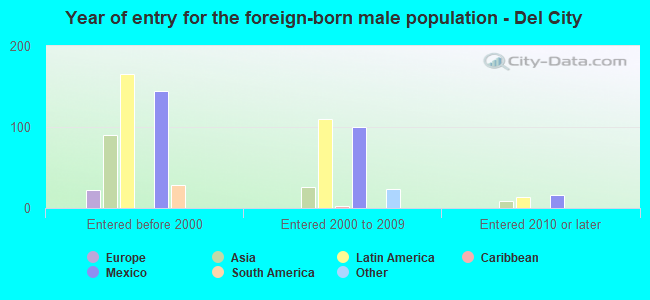
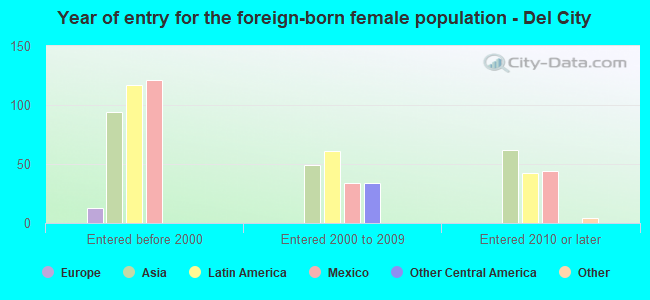
Foreign-born residents in Del City 884 residents are foreign born (2.3% Latin America , 1.5% Asia ).
This city:
4.0%Oklahoma:
6.1%
Marital status for residents in Del City Marital status - White (Caucasian) population 15 years and over
Males 32.7% Never married45.7% Now married1.4% Separated4.8% Widowed15.3% DivorcedFemales 31.3% Never married37.8% Now married1.5% Separated12.1% Widowed17.3% DivorcedWomen who gave birth in the past 12 months Now married:
48.5% (116)Unmarried:
51.5% (124)
Women who did not give birth in the past 12 months Now married:
33.6% (820)Unmarried:
66.4% (1,617)
Marital status - Black or African American population 15 years and over
Males 44.8% Never married37.6% Now married0.9% Separated3.8% Widowed12.9% DivorcedFemales 46.1% Never married36.9% Now married3.0% Separated1.6% Widowed12.4% DivorcedWomen who gave birth in the past 12 months Now married:
43.1% (96)Unmarried:
56.9% (127)
Women who did not give birth in the past 12 months Now married:
33.2% (280)Unmarried:
66.8% (563)
Marital status - American Indian / Alaska Native population 15 years and over
Males 35.4% Never married52.7% Now married5.4% Separated3.7% Widowed2.7% DivorcedFemales 36.0% Never married28.6% Now married0.0% Separated1.3% Widowed34.2% DivorcedWomen who gave birth in the past 12 months Now married:
100.0% (5)Unmarried:
0.0% (0)
Women who did not give birth in the past 12 months Now married:
29.4% (110)Unmarried:
70.6% (264)
Marital status - Asian population 15 years and over
Males 41.9% Never married33.1% Now married6.4% Separated0.0% Widowed18.6% DivorcedFemales 6.5% Never married51.3% Now married22.1% Separated1.0% Widowed19.1% DivorcedWomen who did not give birth in the past 12 months Now married:
84.1% (72)Unmarried:
15.9% (14)
Marital status - Other race population 15 years and over
Males 37.7% Never married62.3% Now married0.0% Separated0.0% Widowed0.0% DivorcedFemales 34.6% Never married64.8% Now married0.0% Separated0.0% Widowed0.5% DivorcedWomen who gave birth in the past 12 months Now married:
100.0% (9)Unmarried:
0.0% (0)
Women who did not give birth in the past 12 months Now married:
50.0% (75)Unmarried:
50.0% (75)
Marital status - Two or more races population 15 years and over
Males 51.5% Never married39.9% Now married1.3% Separated2.0% Widowed5.2% DivorcedFemales 31.3% Never married39.2% Now married2.3% Separated14.6% Widowed12.6% DivorcedWomen who gave birth in the past 12 months Now married:
80.5% (154)Unmarried:
19.5% (37)
Women who did not give birth in the past 12 months Now married:
36.4% (324)Unmarried:
63.6% (565)
Marital status - White alone, not Hispanic / Latino population 15 years and over
Males 31.8% Never married46.7% Now married1.0% Separated4.9% Widowed15.7% DivorcedFemales 30.9% Never married37.3% Now married1.6% Separated12.3% Widowed17.9% DivorcedWomen who gave birth in the past 12 months Now married:
43.7% (104)Unmarried:
56.3% (134)
Women who did not give birth in the past 12 months Now married:
32.6% (777)Unmarried:
67.4% (1,610)
Marital status - Hispanic or Latino population 15 years and over
Males 46.5% Never married45.2% Now married3.0% Separated1.6% Widowed3.7% DivorcedFemales 35.5% Never married51.7% Now married0.0% Separated8.9% Widowed3.8% DivorcedWomen who gave birth in the past 12 months Now married:
100.0% (58)Unmarried:
0.0% (0)
Women who did not give birth in the past 12 months Now married:
47.8% (346)Unmarried:
52.2% (377)
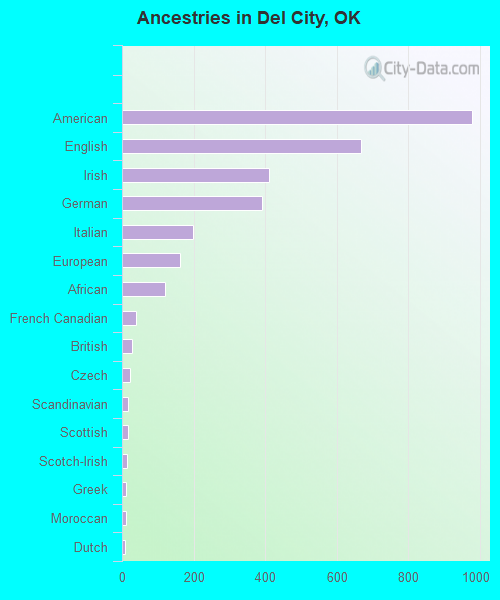
Ancestries in Del City
976 9.0% American668 6.1% English411 3.8% Irish391 3.6% German197 1.8% Italian161 1.5% European120 1.1% African38 0.3% French Canadian28 0.3% British21 0.2% Czech17 0.2% Scandinavian16 0.1% Scottish15 0.1% Scotch-Irish11 0.1% Greek10 0.09% Moroccan9 0.08% Dutch8 0.07% Nigerian6 0.06% Dutch West Indian5 0.05% Iranian3 0.03% Welsh
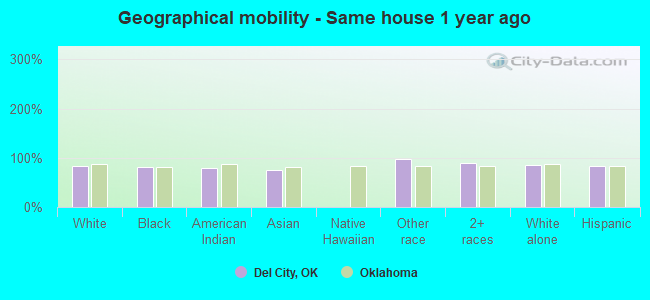
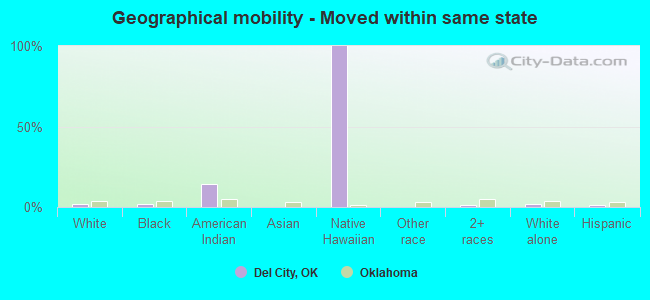
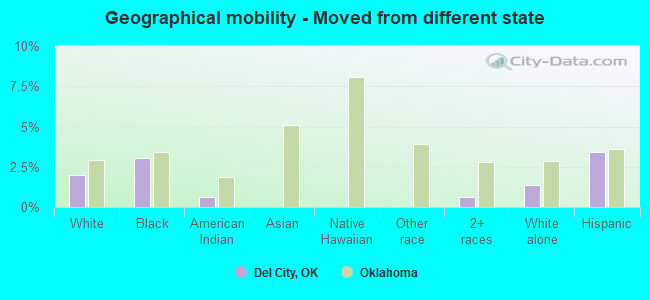
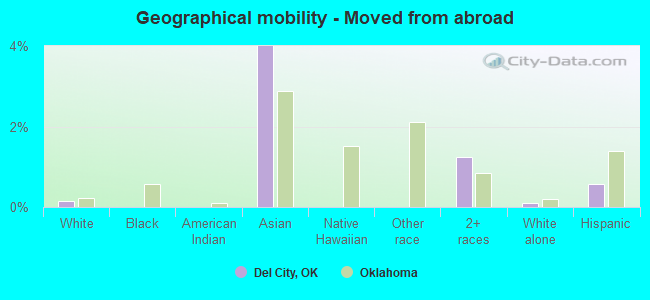
Geographical mobility in Del City Same house 1 year ago 8,851 84.0% White (Caucasian)3,367 81.2% Black or African American836 79.1% American Indian / Alaska Native318 76.3% Asian769 97.3% Other race4,034 88.6% Two or more races8,795 84.5% White alone, not Hispanic / Latino2,467 83.1% Hispanic or LatinoMoved within same county 1,202 11.4% White / Caucasian539 13.0% Black or African American91 8.6% American Indian / Alaska Native96 23.0% Asian16 2.0% Other race406 8.9% Two or more races1,223 11.8% White alone, not Hispanic / Latino358 12.0% Hispanic or LatinoMoved within same state 185 1.8% White / Caucasian98 2.4% Black or African American143 13.5% American Indian / Alaska Native4 100.0% Native Hawaiian / Pacific Islander60 1.3% Two or more races172 1.7% White alone, not Hispanic / Latino18 0.6% Hispanic or LatinoMoved from different state 207 2.0% White / Caucasian127 3.1% Black or African American7 0.6% American Indian / Alaska Native29 0.6% Two or more races140 1.3% White alone, not Hispanic / Latino101 3.4% Hispanic or LatinoMoved from abroad 15 0.1% White17 4.0% Asian56 1.2% Two or more races10 0.1% White alone, not Hispanic / Latino17 0.6% Hispanic or Latino
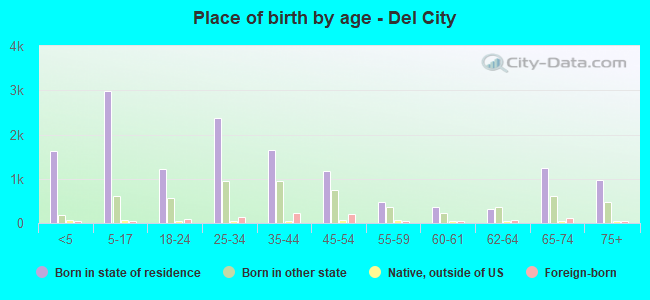
Children Nativity (place of birth) in Del City
Children under 6 years - Living with two parents Both parents native 1,089 100.0% NativeBoth parents foreign-born 7 100.0% NativeOne native, one foreign-born parent 29 100.0% NativeChildren under 6 years - Living with one parent Native parent 1,096 100.0% NativeForeign-born parent 43 100.0% NativeChildren 6 to 17 years - Living with two parents Both parents native 1,094 99.7% Native3 0.3% Foreign-bornBoth parents foreign-born 140 100.0% NativeOne native, one foreign-born parent 66 94.5% Native4 5.5% Foreign-bornChildren 6 to 17 years - Living with one parent Native parent 1,633 100.0% NativeForeign-born parent 33 50.3% Native32 49.7% Foreign-born
Grandparents responsible for own grandchildren in Del City
Grandparents (30 to 59 years) White / Caucasian 67 87.6% Responsible for grandchildren10 12.4% Not responsible for grandchildrenBlack or African American 17 100.0% Responsible for grandchildrenAmerican Indian / Alaska Native 4 100.0% Responsible for grandchildrenOther race 31 100.0% Not responsible for grandchildrenTwo or more races 46 100.0% Responsible for grandchildrenWhite alone, not Hispanic / Latino 81 86.2% Responsible for grandchildren13 13.8% Not responsible for grandchildrenHispanic or Latino 14 100.0% Not responsible for grandchildrenGrandparents (60 years and over) White / Caucasian 276 77.6% Responsible for grandchildren80 22.4% Not responsible for grandchildrenBlack or African American 28 65.0% Responsible for grandchildren15 35.0% Not responsible for grandchildrenTwo or more races 8 46.1% Responsible for grandchildren9 53.9% Not responsible for grandchildrenWhite alone, not Hispanic / Latino 267 75.5% Responsible for grandchildren87 24.5% Not responsible for grandchildren